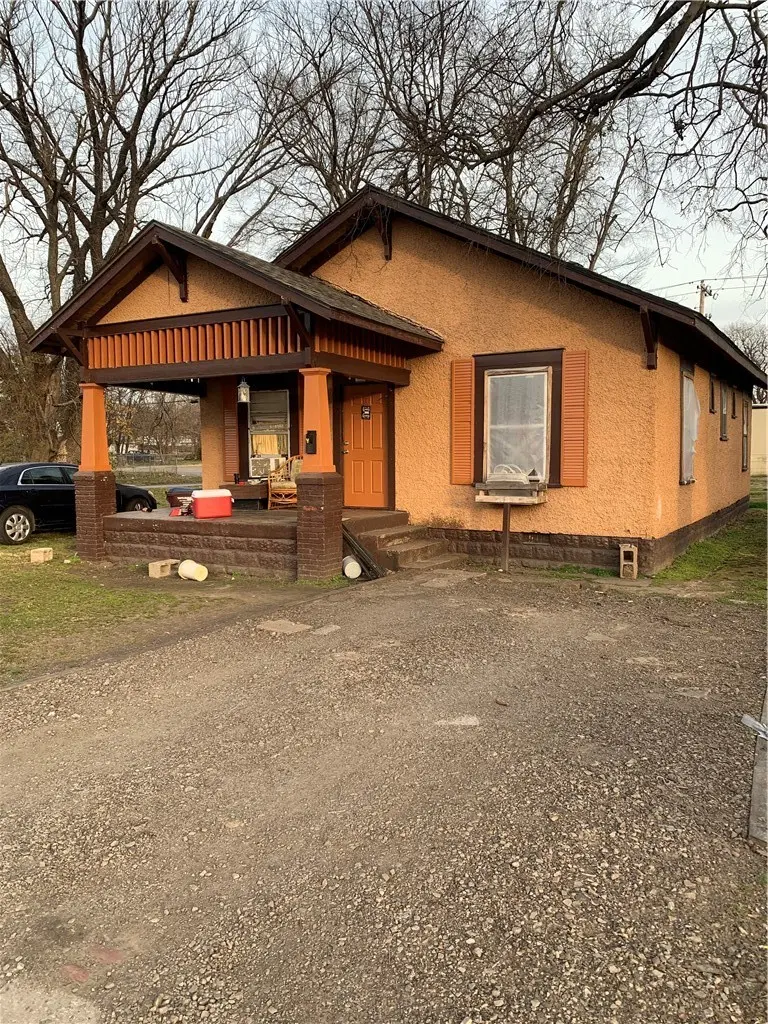
614 N 8th St · Fort Smith, AR
Flood risk 6/10 · Moderate
- FEMA flood zone
- X (unshaded)
- Chance of flooding over 30 yrs
- 0.74%
- Est. flood insurance / yr
- $507 – $1,088
Fire risk 3/10 · Minor
- Est. fire insurance / yr
- $1,499 – $2,785
Heat risk 7/10 · Major
- Hot days now (above 111°F)
- 7 days/yr
- Hot days in 30 yrs
- 20 days/yr
Wind risk 2/10 · Minimal
- Chance of severe wind over 30 yrs
- 2.0%
Air-quality risk 2/10 · Minimal
- Unhealthy air days now
- 0 days/yr
- Unhealthy air days in 30 yrs
- 1 days/yr
Risk factors via First Street. Map © Google.
Why this score? — see what drove the B- grade
The composite is a weighted blend of 9 inputs, each scored 0–100. Each bar is that input's sub-score; the figure is the points it added to the 100-point composite (weight × sub-score).
- Cash flow +30.0/30.0
- 1% rule +10.0/10.0
- DSCR +10.0/10.0
- ARV discount +4.7/15.0
- Rent growth +3.6/5.0
- Livability +3.2/5.0
- Schools +3.1/10.0
- Condition / age +2.5/5.0
- Appreciation +0.0/10.0
$57,999
🖨 Deal sheet (PDF) 📄 Offer letter ✓ Due diligence
Listing remarks MLS
Older 1,092 sq. ft. home with 2 bedrooms & 1 bath. Priced to sell
Key facts
- 7,841 sq ft lot
- Listed 33 days
Neighborhood map
What this means for you Summary
Snapshot
- This is a 2-bed/1.0-bath single-family listed at $58k.
Deal economics
- At list price, monthly cash flow is $371 ($4k/yr) — positive.
- The deal already cash-flows at list — no discount required.
- Meets the 1% rule at list price ($934 rent vs $58k).
- Recommended offer: $56k (3.0% below list) — sets the bar for market timing.
- Cap rate 14.0% vs local median 4.3% in Fort Smith — top-decile yield for the area; either an underpriced asset or a hidden risk that comps aren't pricing in. Stress-test before assuming the spread holds.
Location & tenants
- Location reads 65/100 on livability (#151 in AR) — a middle-class / working-renter tenant base. Strengths: cost of living A+, housing A+, health & safety A+; Watch: crime F, amenities F, commute F.
- Fort Smith School District (urban): math 35% / reading 39% proficiency, ranked #106 of 238 in AR (top 44%) — families likely to look elsewhere, expect single-tenant / working-renter base with shorter leases; 64% free/reduced lunch — lower-income household profile, screen leases tightly.
- Zoned schools: Howard Elementary School (math 22% / reading 22%, grade F, #365 of 454 statewide, top 82%, 263 students, 92% FRL); William O. Darby Jr. High Sch. (math 20% / reading 30%, grade F, #164 of 201 statewide, top 82%, 700 students, 87% FRL); Northside High School (math 12% / reading 27%, grade F, #239 of 292 statewide, top 85%, 2,433 students, 74% FRL) — zoned schools average 84% FRL vs 64% district-wide (20 pts higher); higher-poverty schools than district average — tighter screening recommended.
- Zoned-school proficiency averages 22% at this address vs 37% district-wide (-15 pts) — the specific schools serving this property underperform the Fort Smith School District average; the district grade overstates school quality for this exact location.
- Market conditions: Rents rising fast (+4.4%/yr); 174 active listings in the ZIP; 17 comparable units currently listed for rent nearby; rentals at typical pace (median 14d on market — plan ~3-4 weeks tenant-placement turnaround); lower-income renter base — watch delinquency; 388 units permitted in Sebastian County in 2024 (16 in 5+ unit buildings).
Forward outlook
- Local home prices are declining (-3.0%/yr); year-one equity from $401 of loan paydown is wiped out by about $2k of value loss. Plan a longer hold.
- Sebastian County population projected at +7% by 2050 — modest demand growth; plan on rents tracking national, not racing it.
- At projected returns (-3.0% appreciation + 4.4% rent growth), your $16k cash investment doubles in ~5 years — after that, you're playing with house money.
Negotiation context
- It's been on market 33 days — a 3% lower offer ($56k) is reasonable based on typical stale-listing flexibility.
- 3 sale attempts; this cycle's ask has dropped $7k (11%) from the opening price — seller is motivated, your offer sets the floor, not the list.
Risks & watch-outs
- Climate carrying-cost: major flood risk; extreme-heat days projected 7→20/yr by 2055 (HVAC capex compounding) — expect insurance premiums to compound above CPI over the hold.
Questions for the listing agent
- It's been on market 33 days. Have you received any prior offers? Is the seller open to a 3% concession, seller financing, or rate buy-down credit?
- Is there a deadline driving the sale (1031 exchange, divorce, estate, relocation)? That informs how much negotiation room exists.
- Schools are D-rated, which usually means shorter tenancies and higher turnover. Who's the typical renter profile here, and what's been the actual vacancy rate?
- Crime grade is F in this area — have there been break-ins, vandalism, or insurance claims at this property in the last 3 years? What carrier currently insures it and at what premium?
- What's the average days-on-market for RENTAL listings here right now (not sales)? A rising rental-DOM trend means longer vacancies and softer asking-rent achievability than the comps imply.
- What's the recent tenant-quality profile in this submarket — average credit score on applications, eviction rate, late-payment / NSF rate, and stable-employment percentage? A property-management company in the area should have these aggregated.
- How much new for-sale + rental construction is in the pipeline within 1–3 miles? Heavy new supply typically softens prices + rents 12–24 months out; constrained supply supports both.
Investment metrics
- 1% rule
- 1.61% ✓
- Cap rate
- 13.97%
- Cash-on-cash
- 27.43%
- DSCR
- 2.22
- GRM
- 5.2
CMA / ARV
- ARV (on-the-fly)
- $54,600
- Comps found
- 10
Show comp detail 10 sales within ~0.75 mi
| Address | Dist | Beds/Ba | Sqft | Sold | Price | $/sf | Match |
|---|---|---|---|---|---|---|---|
| 614 N 8th St | 0.00mi | 2/1.0 | 1,092 (0%) | 1mo | $55,000 | $50 | 99 |
| 902 N 7th St | 0.18mi | 2/1.0 | 1,098 (+0%) | 8mo | $110,000 | $100 | 84 |
| 913 N 7th St | 0.20mi | 2/2.0 | 1,154 (+6%) | 10mo | $155,000 | $134 | 69 |
| 1110 N 5th St | 0.37mi | 1/1.0 (-1) | 1,166 (+7%) | 2mo | $96,800 | $83 | 65 |
| 1711 N J St | 0.60mi | 2/1.0 | 1,028 (-6%) | 3mo | $50,000 | $49 | 60 |
| 1808 N M St | 0.64mi | 3/1.0 (+1) | 1,088 (-0%) | 8mo | $27,000 | $25 | 58 |
| 1216 N 12th St | 0.48mi | 3/1.0 (+1) | 1,045 (-4%) | 17mo | $8,000 | $8 | 52 |
| 1221 14th St | 0.55mi | 3/1.0 (+1) | 1,120 (+3%) | 19mo | $80,000 | $71 | 50 |
| 1716 N J St | 0.61mi | 3/1.5 (+1) | 1,196 (+10%) | 5mo | $60,000 | $50 | 45 |
| 1809 N Short L St | 0.64mi | 3/1.0 (+1) | 960 (-12%) | 21mo | $45,650 | $48 | 28 |
Match score weights: distance 35% · size 25% · config 20% · recency 20%. Top-matched comps best support the ARV.
Projected returns pro-forma
-3.0% appreciation · 4.37% rent growth · sell at horizon
- IRR
- 22.9%
- Equity multiple
- 1.96×
- Total profit
- $15,546
- Equity at exit
- $8,648
- IRR
- 31.7%
- Equity multiple
- 4.05×
- Total profit
- $49,464
- Equity at exit
- $5,015
Cash invested: $16,240 (down + closing). Projections, not guarantees.
Landlord ↔ Tenant lean methodology
- Overall (STATE)
- 92 Strongly Landlord-Friendly
- State Arkansas
- 92 Strongly Landlord-Friendly · R+14
- County
- — inherits STATE
- City
- — inherits STATE
ZIP-level market 72901
- Rents YoY
- 4.4%
- Active inventory
- 174
- Price-to-rent
- 5.2×
Monthly cashflow live
- Estimated rent
- $934 high interval (Pro) →
- Mortgage (P&I)
- −$304
- Tax from tax record
- −$38 /mo · $462/yr
- Insurance
- −$24
- HOA
- −$0
- Vacancy / Maint / Mgmt
- −$196
- Net cashflow
- $371
Break-even live
Sensitivity live
| Price | -10% $404 | -5% $388 | +0% $371 | +5% $355 | +10% $338 |
|---|---|---|---|---|---|
| Rent | -10% $297 | -5% $334 | +0% $371 | +5% $408 | +10% $445 |
| Rate | -1.0pp $400 | -0.5pp $386 | base $371 | +0.5pp $356 | +1.0pp $341 |
UW: 25.0% down · 7.5% · 30yr · 1.5% tax · 5.0% vac · 8.0% maint · 8.0% mgmt
Financing live
Cash to close
- Down payment
- $14,500
- Closing costs
- $1,740
- Reserves months
- —
- Total cash needed
- —
Loan-product check · same deal, 3 products live
Conventional
25% down · 7.5% · 30yr
- Down + closing
- —
- Monthly P&I
- —
- Monthly cashflow
- —
- DSCR
- —
- Eligible?
- —
Personal DTI + credit; lowest rate.
DSCR
20% down · 8.5% · 30yr
- Down + closing
- —
- Monthly P&I
- —
- Monthly cashflow
- —
- DSCR
- —
- Eligible?
- —
No personal income docs; deal must DSCR.
Hard money
10% down · 12.0% · 12mo
- Down + closing
- —
- Monthly P&I
- —
- Monthly cashflow
- —
- DSCR
- —
- Eligible?
- —
Short-term bridge; refi at stabilization.
Rent comps 17 comps
| Address | Beds | Baths | Sqft | Rent | $/sqft | DOM | Units | Dist |
|---|---|---|---|---|---|---|---|---|
| 1218 D St N Unit 1218 Fort Smith, AR | 1.0 | 1.0 | 726 | $550 | $0.76 | 21d | 1 | 0.35mi |
| 101 N 11th St Fort Smith, AR | 1.0–2.0 | 1.0–2.0 | 806 | $1,115 | $1.38 | 4d | 9 | 0.38mi |
| 101 N 11th St Unit 112 Fort Smith, AR | 2.0 | 2.0 | 1040 | $1,240 | $1.19 | 21d | 1 | 0.39mi |
| 109 N 3rd St Fort Smith, AR | 1.0–2.0 | 1.0–2.5 | 1066 | $1,300 | $1.22 | 4d | 2 | 0.52mi |
| 601 S 14th St Unit 8 Fort Smith, AR | 1.0 | 1.0 | 700 | $495 | $0.71 | 21d | 1 | 0.90mi |
| 800 S 19th St Fort Smith, AR | 2.0 | 1.0 | 1286 | $1,095 | $0.85 | 4d | 1 | 1.06mi |
| 2905 Alabama Ave Fort Smith, AR | 1.0 | 1.0 | 711 | $795 | $1.12 | 4d | 1 | 1.08mi |
| 501 N May Ave Fort Smith, AR | 2.0 | 1.0 | 1022 | $825 | $0.81 | 21d | 1 | 1.15mi |
| 1117 N 32nd St Fort Smith, AR | 2.0 | 1.0 | 744 | $850 | $1.14 | 14d | 1 | 1.17mi |
| 1801 Wirsing Ave Unit B Fort Smith, AR | 2.0 | 1.0 | 896 | $995 | $1.11 | 14d | 1 | 1.19mi |
| 802 S 25th St Fort Smith, AR | 1.0 | 1.0 | 716 | $745 | $1.04 | 12d | 2 | 1.24mi |
| 2322 S I St Fort Smith, AR | 1.0–2.0 | 1.0 | 755 | $895 | $1.19 | 12d | 2 | 1.31mi |
| 1453 N 35th St Fort Smith, AR | 2.0 | 1.0 | 913 | $900 | $0.99 | 21d | 1 | 1.37mi |
| 2409 N 30th St Unit 1 Fort Smith, AR | 2.0 | 2.5 | 1258 | $950 | $0.76 | 21d | 1 | 1.37mi |
| 1307 S 17th St Fort Smith, AR | 3.0 | 1.5 | 1161 | $1,150 | $0.99 | 21d | 1 | 1.39mi |
| 2500 Dodson Ave Unit 1 Fort Smith, AR | 2.0 | 1.0 | 700 | $695 | $0.99 | 14d | 1 | 1.48mi |
| 1907 S N St Fort Smith, AR | 2.0 | 1.0 | 1114 | $950 | $0.85 | 21d | 1 | 1.49mi |
Listing history 9 events
-
2026-04-27status Pending
Show marketing remark (71 chars)
Older 1,092 sq. ft. home with 2 bedrooms & 1 bath. Priced to sell
-
2026-04-27status Pending 71-char remark
Show marketing remark (71 chars)
Older 1,092 sq. ft. home with 2 bedrooms & 1 bath. Priced to sell
-
2026-04-21price $57,999 71-char remark
Show marketing remark (71 chars)
Older 1,092 sq. ft. home with 2 bedrooms & 1 bath. Priced to sell
-
2026-04-13price $57,999
-
2026-03-23status Active 71-char remark
Show marketing remark (71 chars)
Older 1,092 sq. ft. home with 2 bedrooms & 1 bath. Priced to sell
-
2026-03-23price $64,999 71-char remark
Show marketing remark (71 chars)
Older 1,092 sq. ft. home with 2 bedrooms & 1 bath. Priced to sell
-
2026-03-23$64,999 Active
Show marketing remark (71 chars)
Older 1,092 sq. ft. home with 2 bedrooms & 1 bath. Priced to sell
-
2026-03-21historical 71-char remark
Show marketing remark (71 chars)
Older 1,092 sq. ft. home with 2 bedrooms & 1 bath. Priced to sell
-
2026-02-23$1 Active 71-char remark
Show marketing remark (71 chars)
Older 1,092 sq. ft. home with 2 bedrooms & 1 bath. Priced to sell
ⓘ Source: listings_history table (triggers on properties + properties_extension) + one-shot
backfill from property_details.listing_events for pre-trigger history.
Tax reassessment forecast AR · Resets to sale price
- Current annual tax
- $462 · $38/mo
- Projected year-2 tax
- $462 · $38/mo
- Expected delta
- $0/yr ($0/mo · 0.0%)
ⓘ Screening estimate from a state-policy table — verify with the county assessor before closing.
Climate risk First Street
- Flood 6/10 Major FEMA zone X (unshaded) · 74% chance over 30 yrs
- Wildfire 3/10 Moderate
- Heat 7/10 Severe 7 d/yr ≥111°F today · 20 d/yr by 30 yrs out
- Wind 2/10 Low 2% chance of damaging wind over 30 yrs
- Air quality 2/10 Low 0 unhealthy d/yr today · 1 by 30 yrs out
Nearby sold comps map
Loading sold comps map…
Walkable amenities ~0.75 mi
Loading nearby amenities…
Taxation est. · year 1
- Rental income
- $11,211
- − Mortgage interest
- −$3,249
- − Property taxes
- −$462
- − Insurance
- −$290
- − Repairs & maintenance
- −$897
- − Management
- −$897
- − Depreciation
- −$1,687
- Taxable income
- $3,729
- Est. tax owed @ 24.0%
- −$895
- After-tax cash flow
- $3,560/yr
For passive investors: Depreciation is non-cash, so a rental often shows a tax loss while cash-flowing — sheltering income. Rental losses are passive: they offset passive income freely, and up to $25,000/yr can offset ordinary (W-2) income if you actively participate and your MAGI is under $100k (phasing out to $0 by $150k); unused losses carry forward. On sale, claimed depreciation is recaptured at up to 25%, and gains may owe capital-gains tax (a 1031 exchange can defer both). Figures are a year-1 estimate at your 24.0% rate — not tax advice; consult a CPA.
Schools (NCES district)
- District
- Fort Smith School District
- NCES district ID
- 0506330
- Math proficiency
- 35% ▼ -11.00%
- Reading proficiency
- 39% ▼ -7.00%
- Median HH income
- $36,066
- Composite
- 30.66/100
- National rank
- #6183
- State rank
- #106 of 238 in AR
Livability — Fort Smith
- Score
- 65/100
- State rank
- #151
- US rank
- #13185
Category grades
Schools grade is shown separately in the Schools card above.
Census & demographics
- Census place
- Fort Smith, AR
- County
- Sebastian County · 99,312 people
- City population
- 94,356
- Metro
- Fort Smith, AR-OK
- Population (ZIP)
- 19,819
- Household income
- $42,851
- Rent vs Own
- Severe rent burden
- 1117.0
Population outlook (Sebastian County) Hauer SSP2
- Today (2025)
- 133,992 people
- By 2030
- 136,620 · +2.0%
- By 2040
- 140,832 · +5.1%
- By 2050
- 143,301 · +6.9%
- By 2075
- 147,964 · +10.4%
- By 2100
- 145,848 · +8.8%
Race, ethnicity, and origin ACS 2023
- Neighborhood character
- Diverse neighborhood (Simpson 0.60)
- Race & ethnicity
- White 60% Hispanic / Latino 17% Two or more races 12% Black 10% Asian 2%
- Hispanic origin (detail)
- Mexican 11% Puerto Rican 1%
- Common ancestry
- Slovak 2% Lithuanian 2% Italian 1%
- Foreign-born
- 9% · Canada, Vietnam, Guatemala
- Languages at home
- 83% English-only · Spanish 14% Other Asian/Pacific 1% Vietnamese 1%
Political lean MEDSL · Sebastian
- 2024 margin
- Solid R (+37.5) · D 30.0% · R 67.6% · Other 2.4%
- 2008→2024 swing
- -2.9pp toward R · 2008: -34.6pp · 2024: -37.5pp
- All cycles
- 2024: R+37.5 2020: R+35.5 2016: R+38.1 2012: R+37.1 2008: R+34.6
Not yet ingested
- Civics
- —
Market trends
- HPI YoY
- ▼ -173.82%
- Current HPI
- 172.3777
- Rent YoY
- ▲ 4.37%
- Metro
- Fort Smith, AR-OK
- State GDP YoY
- ▲ 3.80%
- F500 in state
- 10
Industry mix (Fortune 500 HQ in AR)
| Industry | F500 HQs | Revenue |
|---|---|---|
| Retail | 1 | $681B |
|
||
| Food / Agriculture | 1 | $53B |
|
||
| Retail / Energy | 1 | $22B |
|
||
| Transportation / Logistics | 1 | $12B |
|
||
| Energy | 1 | $4B |
|
||
Price history
-10.8% since first listed9 events — show timeline
- 2026-04-27 Pending — WRVBOR
- 2026-04-27 Pending — NWARMLS
- 2026-04-21 Price Changed $57,999 NWARMLS
- 2026-04-13 Price Changed $57,999 WRVBOR
- 2026-03-23 Relisted — NWARMLS
- 2026-03-23 Price Changed $64,999 NWARMLS
- 2026-03-23 Listed $64,999 WRVBOR
- 2026-03-21 Delisted — NWARMLS
- 2026-02-23 Listed $1 NWARMLS
Property tax history
+3.3%/yrLatest (2025): $462 · +8.9% YoY. Source: county tax records.
Cash-flow waterfall
monthlySold comps — $/sqft
last 12 mo · ≤1 miLoading sold comps…