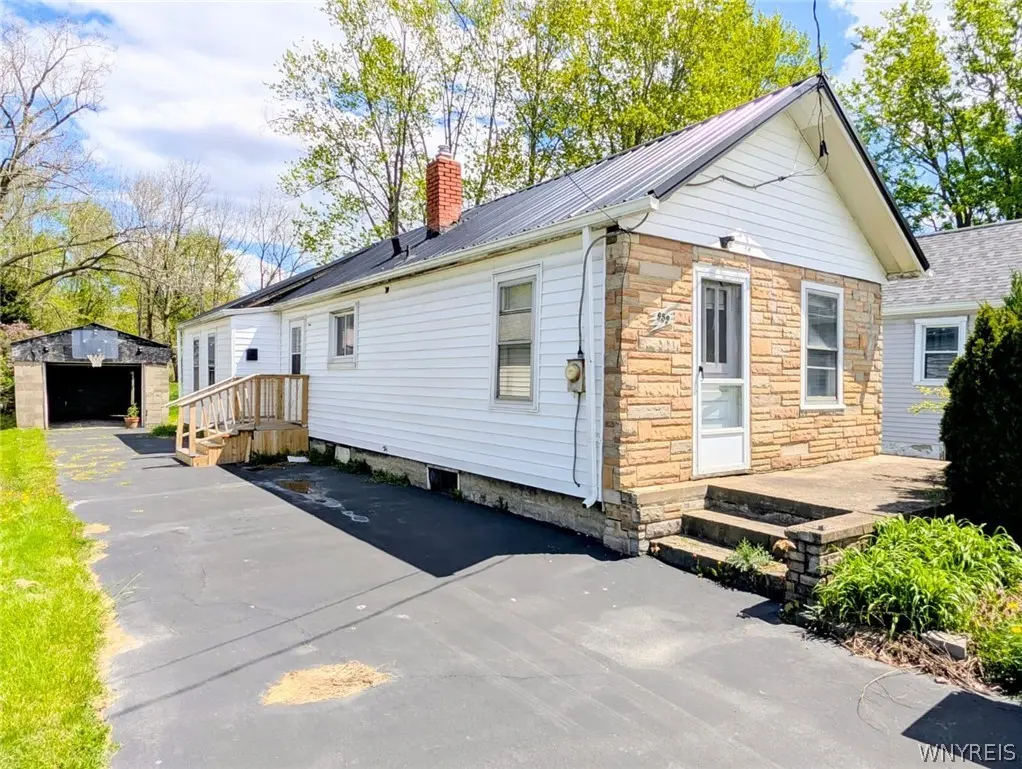
959 N Erie Ave · North Tonawanda, NY
Flood risk 4/10 · Minor
- FEMA flood zone
- X (unshaded)
- Chance of flooding over 30 yrs
- 0.21%
- Est. flood insurance / yr
- $473 – $860
Fire risk 3/10 · Minor
- Est. fire insurance / yr
- $691 – $1,283
Heat risk 2/10 · Minimal
- Hot days now (above 94°F)
- 7 days/yr
- Hot days in 30 yrs
- 15 days/yr
Wind risk 1/10 · Minimal
- Chance of severe wind over 30 yrs
- —
Air-quality risk 3/10 · Minor
- Unhealthy air days now
- 3 days/yr
- Unhealthy air days in 30 yrs
- 4 days/yr
Risk factors via First Street. Map © Google.
Why this score? — see what drove the C+ grade
The composite is a weighted blend of 9 inputs, each scored 0–100. Each bar is that input's sub-score; the figure is the points it added to the 100-point composite (weight × sub-score).
- Cash flow +20.5/30.0
- ARV discount +15.0/15.0
- DSCR +6.5/10.0
- 1% rule +5.2/10.0
- Schools +4.2/10.0
- Livability +4.2/5.0
- Rent growth +4.0/5.0
- Condition / age +2.5/5.0
- Appreciation +0.0/10.0
$129,900
🖨 Deal sheet 📄 Offer letter ✓ Due diligence
Listing remarks MLS
Welcome to 959 Erie Ave. This diamond in the rough is ready for a little imagination and some TLC. This would be a great owner occupy or investment opportunity. With a great backyard and detached garage, this home has plenty of potential. Showings begin Saturday 4/27/24 and offers, if any, are due Monday May 6th at 12:00pm.
Key facts
- Updated kitchen
- Beautiful backyard
- Conveniently located
Tags
Property features AI
Exterior
- Parking: Detached garage; One garage space
- Utilities: Public water connected; Sewer connected
- Home design: Single-story home; Existing construction
- Construction: Composite siding; Metal roof; Block foundation
- Exterior features: Blacktop driveway; Near public transit; Rectangular lot
Interior
- Kitchen: Gas oven; Gas range
- Bedrooms: Two main-level bedrooms
- Flooring: Hardwood; Laminate; Tile; Vinyl; Varies
- Bathrooms: One full bathroom (main level)
- Heating & cooling: Gas forced-air heating
- Interior features: Eat-in kitchen; Some rooms noted as 'Other'; See remarks for additional interior details
- Laundry & utility: Gas water heater
Neighborhood map
What this means for you Summary
Snapshot
- This is a 2-bed/1.0-bath single-family listed at $130k.
Deal economics
- At list price, monthly cash flow is $172 ($2k/yr) — positive.
- The deal already cash-flows at list — no discount required.
- Meets the 1% rule at list price ($1k rent vs $130k).
- Recommended offer: $126k (3.0% below list) — sets the bar for market timing.
- Cap rate 7.9% vs local median 4.0% in North Tonawanda — top-decile yield for the area; either an underpriced asset or a hidden risk that comps aren't pricing in. Stress-test before assuming the spread holds.
Location & tenants
- Location reads 85/100 on livability (#30 in NY, #518 nationally) — a professional / high-income tenant draw. Strengths: commute A+, housing A+, health & safety A+.
- North Tonawanda City School District (suburban): math 42% / reading 57% proficiency, ranked #398 of 590 in NY (top 68%) — families likely to look elsewhere, expect single-tenant / working-renter base with shorter leases.
- Market conditions: Rents rising fast (+6.0%/yr); 178 active listings in the ZIP; 8 comparable units currently listed for rent nearby; rentals at typical pace (median 24d on market — plan ~3-4 weeks tenant-placement turnaround); 167 units permitted in Niagara County in 2024 (0 in 5+ unit buildings).
Forward outlook
- Local home prices are declining (-3.0%/yr); year-one equity from $898 of loan paydown is wiped out by about $4k of value loss. Plan a longer hold.
- Niagara County population projected at -19% by 2050 — secular population decline; favor cash flow + early exit over multi-decade hold.
Negotiation context
- It's been on market 31 days — a 3% lower offer ($126k) is reasonable based on typical stale-listing flexibility.
- 3 sale attempts since 2y ago; this cycle's ask has dropped $9k (7%) from the opening price — seller is motivated, your offer sets the floor, not the list.
- Current owner paid $90k; 44% above their basis — modest negotiation headroom, anchor on the comps not their cost.
Risks & watch-outs
- Watch-outs: built in 1925 — expect roof / HVAC / electrical / plumbing capex.
Questions for the listing agent
- It's been on market 31 days. Have you received any prior offers? Is the seller open to a 3% concession, seller financing, or rate buy-down credit?
- Built in 1925 — when were the roof, HVAC, electrical panel, plumbing, and water heater last replaced?
- Is there a deadline driving the sale (1031 exchange, divorce, estate, relocation)? That informs how much negotiation room exists.
- Schools are B-rated — typically a magnet for longer-tenancy family renters. What's the average tenant stay here, and is there a school-zone premium baked into asking?
- What's the average days-on-market for RENTAL listings here right now (not sales)? A rising rental-DOM trend means longer vacancies and softer asking-rent achievability than the comps imply.
- What's the recent tenant-quality profile in this submarket — average credit score on applications, eviction rate, late-payment / NSF rate, and stable-employment percentage? A property-management company in the area should have these aggregated.
- How much new for-sale + rental construction is in the pipeline within 1–3 miles? Heavy new supply typically softens prices + rents 12–24 months out; constrained supply supports both.
Investment metrics
- 1% rule
- 1.02% ✓
- Cap rate
- 7.88%
- Cash-on-cash
- 5.68%
- DSCR
- 1.25
- GRM
- 8.2
CMA / ARV
- ARV (on-the-fly)
- $215,424
- Comps found
- 6
Show comp detail 6 sales within ~0.75 mi
| Address | Dist | Beds/Ba | Sqft | Sold | Price | $/sf | Match |
|---|---|---|---|---|---|---|---|
| 959 Erie Ave | 0.00mi | 2/1.0 | 816 (0%) | 24mo | $90,000 | $110 | 80 |
| 953 Erie Ave | 0.01mi | 3/1.0 (+1) | 906 (+11%) | 12mo | $195,000 | $215 | 66 |
| 1330 Sisson Dr | 0.55mi | 2/1.0 | 768 (-6%) | 14mo | $205,000 | $267 | 53 |
| 979 Nash Rd | 0.65mi | 3/1.0 (+1) | 808 (-1%) | 19mo | $220,000 | $272 | 47 |
| 922 Nash Rd | 0.64mi | 3/1.0 (+1) | 776 (-5%) | 22mo | $205,000 | $264 | 39 |
| 821 Revere Ave | 0.46mi | 3/1.5 (+1) | 936 (+15%) | 17mo | $183,000 | $196 | 33 |
Match score weights: distance 35% · size 25% · config 20% · recency 20%. Top-matched comps best support the ARV.
Projected returns pro-forma
-3.0% appreciation · 5.96% rent growth · sell at horizon
- IRR
- -4.3%
- Equity multiple
- 0.83×
- Total profit
- $-6,022
- Equity at exit
- $19,369
- IRR
- 8.5%
- Equity multiple
- 1.73×
- Total profit
- $26,575
- Equity at exit
- $11,231
Cash invested: $36,372 (down + closing). Projections, not guarantees.
Landlord ↔ Tenant lean methodology
- Overall (STATE)
- 15 Strongly Tenant-Friendly
- State New York
- 15 Strongly Tenant-Friendly · D+10
- County
- — inherits STATE
- City
- — inherits STATE
ZIP-level market 14120
- Rents YoY
- 6.0%
- Active inventory
- 178
- Price-to-rent
- 8.2×
Monthly cashflow live
- Estimated rent
- $1,322 high interval (Pro) →
- Mortgage (P&I)
- −$681
- Tax from tax record
- −$137 /mo · $1,641/yr
- Insurance
- −$54
- HOA
- −$0
- Vacancy / Maint / Mgmt
- −$278
- Net cashflow
- $172
Break-even live
UW: 25.0% down · 7.5% · 30yr · 1.5% tax · 5.0% vac · 8.0% maint · 8.0% mgmt
Financing live
Cash to close
- Down payment
- $32,475
- Closing costs
- $3,897
- Reserves months
- —
- Total cash needed
- —
Loan-product check · same deal, 3 products live
Conventional
25% down · 7.5% · 30yr
- Down + closing
- —
- Monthly P&I
- —
- Monthly cashflow
- —
- DSCR
- —
- Eligible?
- —
Personal DTI + credit; lowest rate.
DSCR
20% down · 8.5% · 30yr
- Down + closing
- —
- Monthly P&I
- —
- Monthly cashflow
- —
- DSCR
- —
- Eligible?
- —
No personal income docs; deal must DSCR.
Hard money
10% down · 12.0% · 12mo
- Down + closing
- —
- Monthly P&I
- —
- Monthly cashflow
- —
- DSCR
- —
- Eligible?
- —
Short-term bridge; refi at stabilization.
Rent comps 8 comps
| Address | Beds | Baths | Sqft | Rent | $/sqft | DOM | Units | Dist |
|---|---|---|---|---|---|---|---|---|
| 900 E Robinson St North Tonawanda, NY | 2.0 | 1.0 | 900 | $1,350 | $1.50 | 2d | 1 | 0.71mi |
| 757 Remington Dr Unit 1 North Tonawanda, NY | 3.0 | 1.5 | 1100 | $1,750 | $1.59 | 10d | 1 | 0.76mi |
| 399 Miller St North Tonawanda, NY | 2.0 | 1.0 | 750 | $1,250 | $1.67 | 24d | 1 | 1.02mi |
| 317 Hedwig Dr Unit N North Tonawanda, NY | 3.0 | 1.0 | 864 | $1,350 | $1.56 | 10d | 1 | 1.07mi |
| 1400 Nash Rd North Tonawanda, NY | 1.0–2.0 | 1.0 | 750 | $1,225 | $1.63 | 2d | 1 | 1.25mi |
| 166 Spruce St Unit 5 North Tonawanda, NY | 2.0 | 1.0 | 1000 | $1,300 | $1.30 | 24d | 1 | 1.32mi |
| 125 3rd Ave North Tonawanda, NY | 2.0 | 1.0 | 900 | $1,100 | $1.22 | 44d | 1 | 1.36mi |
| 175 12th Ave North Tonawanda, NY | 3.0 | 1.0 | 1000 | $1,600 | $1.60 | 44d | 1 | 1.38mi |
Listing history 19 events
-
2026-06-18days on market $129,900 Active 31 DOM
-
2026-06-17days on market $129,900 Active 30 DOM
-
2026-06-16days on market $129,900 Active 29 DOM
-
2026-06-15days on market $129,900 Active 28 DOM
-
2026-06-13pricedays on market $129,900 Active 26 DOM
-
2026-06-10days on market $139,000 Active 23 DOM
-
2026-06-09days on market $139,000 Active 22 DOM
-
2026-06-08days on market $139,000 Active 21 DOM
-
2026-06-07days on market $139,000 Active 20 DOM
-
2026-06-03days on market $139,000 Active 16 DOM
-
2026-06-02days on market $139,000 Active 15 DOM
-
2026-06-01days on market $139,000 Active 14 DOM
-
2026-05-31days on market $139,000 Active 13 DOM
-
2026-05-18$139,000 Active
-
2025-08-13historical
-
2025-07-03$139,900 Active
-
2024-07-01soldstatus $90,000 Closed 325-char remark
Show marketing remark (325 chars)
Welcome to 959 Erie Ave. This diamond in the rough is ready for a little imagination and some TLC. This would be a great owner occupy or investment opportunity. With a great backyard and detached garage, this home has plenty of potential. Showings begin Saturday 4/27/24 and offers, if any, are due Monday May 6th at 12:00pm.
-
2024-05-08status Pending 325-char remark
Show marketing remark (325 chars)
Welcome to 959 Erie Ave. This diamond in the rough is ready for a little imagination and some TLC. This would be a great owner occupy or investment opportunity. With a great backyard and detached garage, this home has plenty of potential. Showings begin Saturday 4/27/24 and offers, if any, are due Monday May 6th at 12:00pm.
-
2024-04-25$80,000 Active 325-char remark
Show marketing remark (325 chars)
Welcome to 959 Erie Ave. This diamond in the rough is ready for a little imagination and some TLC. This would be a great owner occupy or investment opportunity. With a great backyard and detached garage, this home has plenty of potential. Showings begin Saturday 4/27/24 and offers, if any, are due Monday May 6th at 12:00pm.
ⓘ Source: listings_history table (triggers on properties + properties_extension) + one-shot
backfill from property_details.listing_events for pre-trigger history.
Tax reassessment forecast NY · Partial reset (capped growth)
- Current annual tax
- $1,641 · $137/mo
- Projected year-2 tax
- $1,918 · $160/mo
- Expected delta
- +$277/yr (+$23/mo · 16.9%)
ⓘ Screening estimate from a state-policy table — verify with the county assessor before closing.
Climate risk First Street
- Flood 4/10 Moderate FEMA zone X (unshaded) · 21% chance over 30 yrs
- Wildfire 3/10 Moderate
- Heat 2/10 Low 7 d/yr ≥94°F today · 15 d/yr by 30 yrs out
- Wind 1/10 Low
- Air quality 3/10 Moderate 3 unhealthy d/yr today · 4 by 30 yrs out
Nearby sold comps map
Loading sold comps map…
Walkable amenities ~0.75 mi
Loading nearby amenities…
Taxation est. · year 1
- Rental income
- $15,863
- − Mortgage interest
- −$7,276
- − Property taxes
- −$1,641
- − Insurance
- −$650
- − Repairs & maintenance
- −$1,269
- − Management
- −$1,269
- − Depreciation
- −$3,779
- Taxable loss
- −$21
- Est. tax savings @ 24.0%
- +$5
- After-tax cash flow
- $2,072/yr
For passive investors: Depreciation is non-cash, so a rental often shows a tax loss while cash-flowing — sheltering income. Rental losses are passive: they offset passive income freely, and up to $25,000/yr can offset ordinary (W-2) income if you actively participate and your MAGI is under $100k (phasing out to $0 by $150k); unused losses carry forward. On sale, claimed depreciation is recaptured at up to 25%, and gains may owe capital-gains tax (a 1031 exchange can defer both). Figures are a year-1 estimate at your 24.0% rate — not tax advice; consult a CPA.
Schools (NCES district)
- District
- North Tonawanda City School District
- NCES district ID
- 3621240
- Math proficiency
- 42% ▼ -16.00%
- Reading proficiency
- 57% ▲ 4.00%
- Median HH income
- $48,348
- Composite
- 42.15/100
- National rank
- #3301
- State rank
- #398 of 590 in NY
Livability — North Tonawanda
- Score
- 85/100
- State rank
- #30
- US rank
- #518
Category grades
Schools grade is shown separately in the Schools card above.
Census & demographics
- Census place
- North Tonawanda, NY
- County
- Niagara County · 157,377 people
- City population
- 44,241
- Metro
- Buffalo-Cheektowaga, NY
- Population (ZIP)
- 44,241
- Household income
- $74,871
- Rent vs Own
- Severe rent burden
- 1303.0
Population outlook (Niagara County) Hauer SSP2
- Today (2025)
- 204,149 people
- By 2030
- 197,900 · -3.1%
- By 2040
- 182,239 · -10.7%
- By 2050
- 165,198 · -19.1%
- By 2075
- 129,416 · -36.6%
- By 2100
- 96,222 · -52.9%
Race, ethnicity, and origin ACS 2023
- Neighborhood character
- Predominantly White (91%)
- Race & ethnicity
- White 91% Two or more races 4% Hispanic / Latino 3% Black 2%
- Common ancestry
- Romanian 15% Lithuanian 2% Slovak 2%
- Foreign-born
- 4% · Canada, China
- Languages at home
- 95% English-only · Russian/Polish/Slavic 2% Spanish 1% Other Indo-European 1%
Political lean MEDSL · Niagara
- 2024 margin
- R (+14.9) · D 42.5% · R 57.5%
- 2008→2024 swing
- -15.9pp toward R · 2008: 1.0pp · 2024: -14.9pp
- All cycles
- 2024: R+14.9 2020: R+9.7 2016: R+19.0 2012: D+0.6 2008: D+1.0
Not yet ingested
- Civics
- —
Market trends
- HPI YoY
- ▼ -260.39%
- Current HPI
- 303.1744
- Rent YoY
- ▲ 5.96%
- Metro
- Buffalo-Cheektowaga, NY
- State GDP YoY
- ▲ 2.60%
- F500 in state
- 92
Industry mix (Fortune 500 HQ in NY)
| Industry | F500 HQs | Revenue |
|---|---|---|
| Financial Services | 10 | $950B |
|
||
| Consumer Goods | 9 | $162B |
|
||
| Insurance | 4 | $225B |
|
||
| Telecommunications | 2 | $144B |
|
||
| Pharmaceuticals | 2 | $112B |
|
||
| Media / Entertainment | 2 | $69B |
|
||
Price history
+73.8% since first listed6 events — show timeline
- 2026-05-18 Listed $139,000 WNYREIS
- 2025-08-13 Listing Removed — WNYREIS
- 2025-07-03 Listed $139,900 WNYREIS
- 2024-07-01 Sold (MLS) $90,000 WNYREIS
- 2024-05-08 Pending — WNYREIS
- 2024-04-25 Listed $80,000 WNYREIS
Property tax history
+16.3%/yrLatest (2025): $1,641 · +16.2% YoY. Source: county tax records.
Cash-flow waterfall
monthlySold comps — $/sqft
last 12 mo · ≤1 miLoading sold comps…