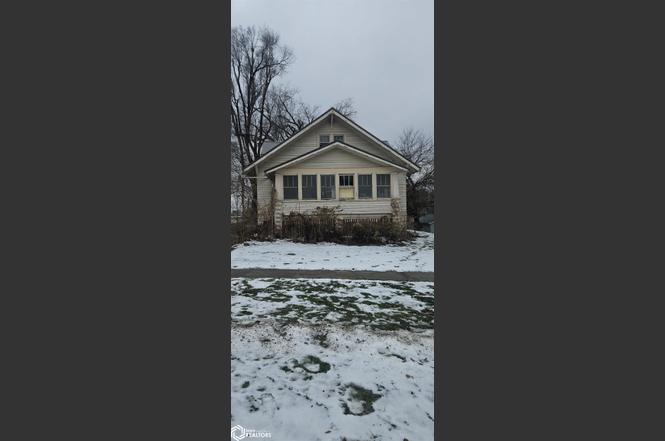
504 N Main St · Fairfield, IA
Flood risk 1/10 · Minimal
- FEMA flood zone
- X (unshaded)
- Chance of flooding over 30 yrs
- 0.0%
- Est. flood insurance / yr
- $473 – $860
Fire risk 1/10 · Minimal
- Est. fire insurance / yr
- $902 – $1,676
Heat risk 3/10 · Minor
- Hot days now (above 107°F)
- 7 days/yr
- Hot days in 30 yrs
- 15 days/yr
Wind risk 2/10 · Minimal
- Chance of severe wind over 30 yrs
- —
Air-quality risk 2/10 · Minimal
- Unhealthy air days now
- 1 days/yr
- Unhealthy air days in 30 yrs
- 2 days/yr
Risk factors via First Street. Map © Google.
Why this score? — see what drove the B grade
The composite is a weighted blend of 9 inputs, each scored 0–100. Each bar is that input's sub-score; the figure is the points it added to the 100-point composite (weight × sub-score).
- Cash flow +30.0/30.0
- 1% rule +10.0/10.0
- DSCR +10.0/10.0
- ARV discount +7.5/15.0
- Schools +5.3/10.0
- Livability +4.0/5.0
- Rent growth +2.5/5.0
- Condition / age +2.5/5.0
- Appreciation +0.0/10.0
$72,500
🖨 Deal sheet (PDF) 📄 Offer letter ✓ Due diligence
Listing remarks
Check out this charming home located in the center of Fairfield! Located right beside Everybody's Whole Foods. This home offers 3-bedrooms, 1-bathroom with a full basement and newer metal roof. It has abundant character with original woodwork, doors and hardwood floors. Come check out this home today!
Key facts
- Full basement
- Center of fairfield
- Newer metal roof
Tags
Property features AI
Exterior
- Parking: On-street parking; Gravel parking
- Utilities: Public water; Public sewer
- Home design: Single-family residence; One and one-half stories
- Construction: Wood siding construction
- Exterior features: Gravel and on-street parking
Interior
- Bathrooms: One full bathroom
- Heating & cooling: Forced air heating; Window air conditioning units
- Interior features: Basement present; One full bathroom
Neighborhood map
What this means for you Summary
Snapshot
- This is a 3-bed/2.0-bath single-family listed at $72k.
Deal economics
- At list price, monthly cash flow is $515 ($6k/yr) — positive.
- The deal already cash-flows at list — no discount required.
- Meets the 1% rule at list price ($1k rent vs $72k).
- Recommended offer: $64k (12.0% below list) — sets the bar for market timing.
- Cap rate 14.8% vs local median 2.9% in Fairfield — top-decile yield for the area; either an underpriced asset or a hidden risk that comps aren't pricing in. Stress-test before assuming the spread holds.
Location & tenants
- Location reads 79/100 on livability (#122 in IA, #2,265 nationally) — a middle-class / working-renter tenant base. Strengths: crime A+, cost of living A+, housing A+; Watch: amenities F, commute F, employment F.
- Fairfield Community School District (town): math 56% / reading 69% proficiency, ranked #227 of 289 in IA (top 78%) — acceptable for families but not a draw, mixed tenant base, ~2y average lease.
- Zoned schools: Fairfield Middle School (math 63% / reading 70%, grade A-, #148 of 246 statewide, top 61%, 438 students, 51% FRL); Fairfield High School (math 50% / reading 73%, grade B-, #255 of 336 statewide, top 76%, 476 students, 42% FRL).
- Market conditions: 121 active listings in the ZIP; 14 units permitted in Jefferson County in 2024 (0 in 5+ unit buildings).
Forward outlook
- Local home prices are declining (-3.0%/yr); year-one equity from $501 of loan paydown is wiped out by about $2k of value loss. Plan a longer hold.
- Jefferson County population projected at +27% by 2050 — long-run rental-demand tailwind backs the buy-and-hold thesis.
- At projected returns (-3.0% appreciation + 3.0% rent growth), your $20k cash investment doubles in ~4 years — after that, you're playing with house money.
Negotiation context
- It's been on market 176 days — a 12% lower offer ($64k) is reasonable based on typical stale-listing flexibility.
- 2 sale attempts since 9y ago with the ask held roughly flat each time — persistent listings suggest the price (not the market) is what's stuck; bring a comps-based counter.
Risks & watch-outs
- Watch-outs: built in 1900 — expect roof / HVAC / electrical / plumbing capex.
Questions for the listing agent
- It's been on market 176 days. Have you received any prior offers? Is the seller open to a 12% concession, seller financing, or rate buy-down credit?
- Built in 1900 — when were the roof, HVAC, electrical panel, plumbing, and water heater last replaced?
- Why hasn't it sold? Are there any deal-killer items the seller is aware of (foundation, flood, title, zoning, code violations)?
- Is there a deadline driving the sale (1031 exchange, divorce, estate, relocation)? That informs how much negotiation room exists.
- Schools are A-rated — typically a magnet for longer-tenancy family renters. What's the average tenant stay here, and is there a school-zone premium baked into asking?
- What's the average days-on-market for RENTAL listings here right now (not sales)? A rising rental-DOM trend means longer vacancies and softer asking-rent achievability than the comps imply.
- What's the recent tenant-quality profile in this submarket — average credit score on applications, eviction rate, late-payment / NSF rate, and stable-employment percentage? A property-management company in the area should have these aggregated.
- How much new for-sale + rental construction is in the pipeline within 1–3 miles? Heavy new supply typically softens prices + rents 12–24 months out; constrained supply supports both.
Investment metrics
- 1% rule
- 1.79% ✓
- Cap rate
- 14.82%
- Cash-on-cash
- 30.46%
- DSCR
- 2.36
- GRM
- 4.6
CMA / ARV
- ARV (on-the-fly)
- $147,609
- Comps found
- 12
Show comp detail 12 sales within ~0.75 mi
| Address | Dist | Beds/Ba | Sqft | Sold | Price | $/sf | Match |
|---|---|---|---|---|---|---|---|
| 504 N Main St | 0.00mi | 3/1.0 | 1,491 (0%) | 0mo | $60,000 | $40 | 96 |
| 302 W Stone Ave | 0.17mi | 3/2.0 | 1,423 (-5%) | 7mo | $170,000 | $119 | 79 |
| 303 & 305 W Kirkwood Ave | 0.15mi | 3/2.0 | 1,632 (+10%) | 2mo | $129,000 | $79 | 76 |
| 103 W Washington Ave | 0.47mi | 3/2.5 | 1,474 (-1%) | 7mo | $182,500 | $124 | 69 |
| 304 E Kirkwood Ave Ave | 0.25mi | 3/2.0 | 1,308 (-12%) | 0mo | $105,000 | $80 | 67 |
| 407 E Lowe Ave | 0.34mi | 3/2.0 | 1,648 (+10%) | 1mo | $163,000 | $99 | 66 |
| 501 E Burlington Ave | 0.54mi | 2/1.5 (-1) | 1,399 (-6%) | 1mo | $183,750 | $131 | 57 |
| 304 W Adams Ave | 0.58mi | 3/2.0 | 1,388 (-7%) | 6mo | $141,500 | $102 | 56 |
| 509 E Adams Ave | 0.67mi | 4/1.0 (+1) | 1,517 (+2%) | 2mo | $118,000 | $78 | 55 |
| 201 W Washington Ave | 0.47mi | 2/1.5 (-1) | 1,664 (+12%) | 1mo | $48,000 | $29 | 51 |
| 901 W Stone Ave | 0.57mi | 4/1.0 (+1) | 1,588 (+6%) | 8mo | $28,000 | $18 | 46 |
| 102 E Madison Ave | 0.68mi | 2/1.5 (-1) | 1,670 (+12%) | 6mo | $189,900 | $114 | 36 |
Match score weights: distance 35% · size 25% · config 20% · recency 20%. Top-matched comps best support the ARV.
Projected returns pro-forma
-3.0% appreciation · 3.0% rent growth · sell at horizon
- IRR
- 25.2%
- Equity multiple
- 2.04×
- Total profit
- $21,094
- Equity at exit
- $10,810
- IRR
- 32.9%
- Equity multiple
- 3.99×
- Total profit
- $60,730
- Equity at exit
- $6,268
Cash invested: $20,300 (down + closing). Projections, not guarantees.
Landlord ↔ Tenant lean methodology
- Overall (STATE)
- 83 Strongly Landlord-Friendly
- State Iowa
- 83 Strongly Landlord-Friendly · R+6
- County
- — inherits STATE
- City
- — inherits STATE
ZIP-level market 52556
- Home prices YoY
- -15.1%
- Active inventory
- 121
- Price-to-rent
- 4.6×
Monthly cashflow live
- Estimated rent
- $1,299 medium interval (Pro) →
- Mortgage (P&I)
- −$380
- Tax from tax record
- −$101 /mo · $1,210/yr
- Insurance
- −$30
- HOA
- −$0
- Vacancy / Maint / Mgmt
- −$273
- Net cashflow
- $515
Break-even live
Sensitivity live
| Price | -10% $556 | -5% $536 | +0% $515 | +5% $495 | +10% $474 |
|---|---|---|---|---|---|
| Rent | -10% $413 | -5% $464 | +0% $515 | +5% $567 | +10% $618 |
| Rate | -1.0pp $552 | -0.5pp $534 | base $515 | +0.5pp $496 | +1.0pp $477 |
UW: 25.0% down · 7.5% · 30yr · 1.5% tax · 5.0% vac · 8.0% maint · 8.0% mgmt
Financing live
Cash to close
- Down payment
- $18,125
- Closing costs
- $2,175
- Reserves months
- —
- Total cash needed
- —
Loan-product check · same deal, 3 products live
Conventional
25% down · 7.5% · 30yr
- Down + closing
- —
- Monthly P&I
- —
- Monthly cashflow
- —
- DSCR
- —
- Eligible?
- —
Personal DTI + credit; lowest rate.
DSCR
20% down · 8.5% · 30yr
- Down + closing
- —
- Monthly P&I
- —
- Monthly cashflow
- —
- DSCR
- —
- Eligible?
- —
No personal income docs; deal must DSCR.
Hard money
10% down · 12.0% · 12mo
- Down + closing
- —
- Monthly P&I
- —
- Monthly cashflow
- —
- DSCR
- —
- Eligible?
- —
Short-term bridge; refi at stabilization.
Listing history 9 events
-
2026-06-07statusdays on market $72,500 Pending 176 DOM
-
2026-06-04days on market $72,500 Active Under Contract 174 DOM
-
2026-06-02days on market $72,500 Active Under Contract 173 DOM
-
2026-06-01days on market $72,500 Active Under Contract 172 DOM
-
2026-05-31days on market $72,500 Active Under Contract 171 DOM
-
2026-05-31days on market $72,500 Active Under Contract 170 DOM
-
2026-04-15historical Active Under Contract
-
2025-12-10$72,500 Active
-
2017-05-02$61,900
ⓘ Source: listings_history table (triggers on properties + properties_extension) + one-shot
backfill from property_details.listing_events for pre-trigger history.
Tax reassessment forecast IA · Partial reset (capped growth)
- Current annual tax
- $1,210 · $101/mo
- Projected year-2 tax
- $1,210 · $101/mo
- Expected delta
- $0/yr ($0/mo · 0.0%)
ⓘ Screening estimate from a state-policy table — verify with the county assessor before closing.
Climate risk First Street
- Flood 1/10 Low FEMA zone X (unshaded) · 0% chance over 30 yrs
- Wildfire 1/10 Low
- Heat 3/10 Moderate 7 d/yr ≥107°F today · 15 d/yr by 30 yrs out
- Wind 2/10 Low
- Air quality 2/10 Low 1 unhealthy d/yr today · 2 by 30 yrs out
Nearby sold comps map
Loading sold comps map…
Walkable amenities ~0.75 mi
Loading nearby amenities…
Taxation est. · year 1
- Rental income
- $15,592
- − Mortgage interest
- −$4,061
- − Property taxes
- −$1,210
- − Insurance
- −$362
- − Repairs & maintenance
- −$1,247
- − Management
- −$1,247
- − Depreciation
- −$2,109
- Taxable income
- $5,355
- Est. tax owed @ 24.0%
- −$1,285
- After-tax cash flow
- $4,898/yr
For passive investors: Depreciation is non-cash, so a rental often shows a tax loss while cash-flowing — sheltering income. Rental losses are passive: they offset passive income freely, and up to $25,000/yr can offset ordinary (W-2) income if you actively participate and your MAGI is under $100k (phasing out to $0 by $150k); unused losses carry forward. On sale, claimed depreciation is recaptured at up to 25%, and gains may owe capital-gains tax (a 1031 exchange can defer both). Figures are a year-1 estimate at your 24.0% rate — not tax advice; consult a CPA.
Schools (NCES district)
- District
- Fairfield Community School District
- NCES district ID
- 1911340
- Math proficiency
- 56% ▼ -14.00%
- Reading proficiency
- 69% ▲ 3.00%
- Median HH income
- $43,980
- Composite
- 52.52/100
- National rank
- #1563
- State rank
- #227 of 289 in IA
Livability — Fairfield
- Score
- 79/100
- State rank
- #122
- US rank
- #2265
Category grades
Schools grade is shown separately in the Schools card above.
Census & demographics
- Census place
- Fairfield, IA
- City population
- 615
- Population (ZIP)
- 11,586
Population outlook (Jefferson County) Hauer SSP2
- Today (2025)
- 20,818 people
- By 2030
- 22,098 · +6.1%
- By 2040
- 24,133 · +15.9%
- By 2050
- 26,448 · +27.0%
- By 2075
- 32,435 · +55.8%
- By 2100
- 33,966 · +63.2%
Race, ethnicity, and origin ACS 2023
- Neighborhood character
- Predominantly White (81%)
- Race & ethnicity
- White 81% Black 7% Hispanic / Latino 5% Asian 5% Two or more races 3% Native American 1%
- Common ancestry
- Italian 6% Slovak 4% Portuguese 3%
- Foreign-born
- 12% · Vietnam, Canada, China
- Languages at home
- 88% English-only · Other Indo-European 3% Spanish 2% Vietnamese 2%
Political lean MEDSL · Jefferson
- 2024 margin
- Lean R (+6.8) · D 45.5% · R 52.3% · Other 2.1%
- 2008→2024 swing
- -27.0pp toward R · 2008: 20.2pp · 2024: -6.8pp
- All cycles
- 2024: R+6.8 2020: R+1.4 2016: R+0.5 2012: D+16.0 2008: D+20.2
Not yet ingested
- Civics
- —
Market trends
- HPI YoY
- ▼ -36.76%
- Current HPI
- 206.8679
- Rent YoY
- —
- Metro
- —
- State GDP YoY
- ▲ 2.48%
- F500 in state
- 4
Industry mix (Fortune 500 HQ in IA)
| Industry | F500 HQs | Revenue |
|---|---|---|
| Financial Services | 1 | $16B |
|
||
| Retail / Convenience | 1 | $15B |
|
||
Price history
+17.1% since first listed3 events — show timeline
- 2026-04-15 Contingent — IAR
- 2025-12-10 Listed $72,500 IAR
- 2017-05-02 Listed $61,900 IAR
Property tax history
-0.7%/yrLatest (2025): $1,210 · +5.2% YoY. Source: county tax records.
Cash-flow waterfall
monthlySold comps — $/sqft
last 12 mo · ≤1 miLoading sold comps…