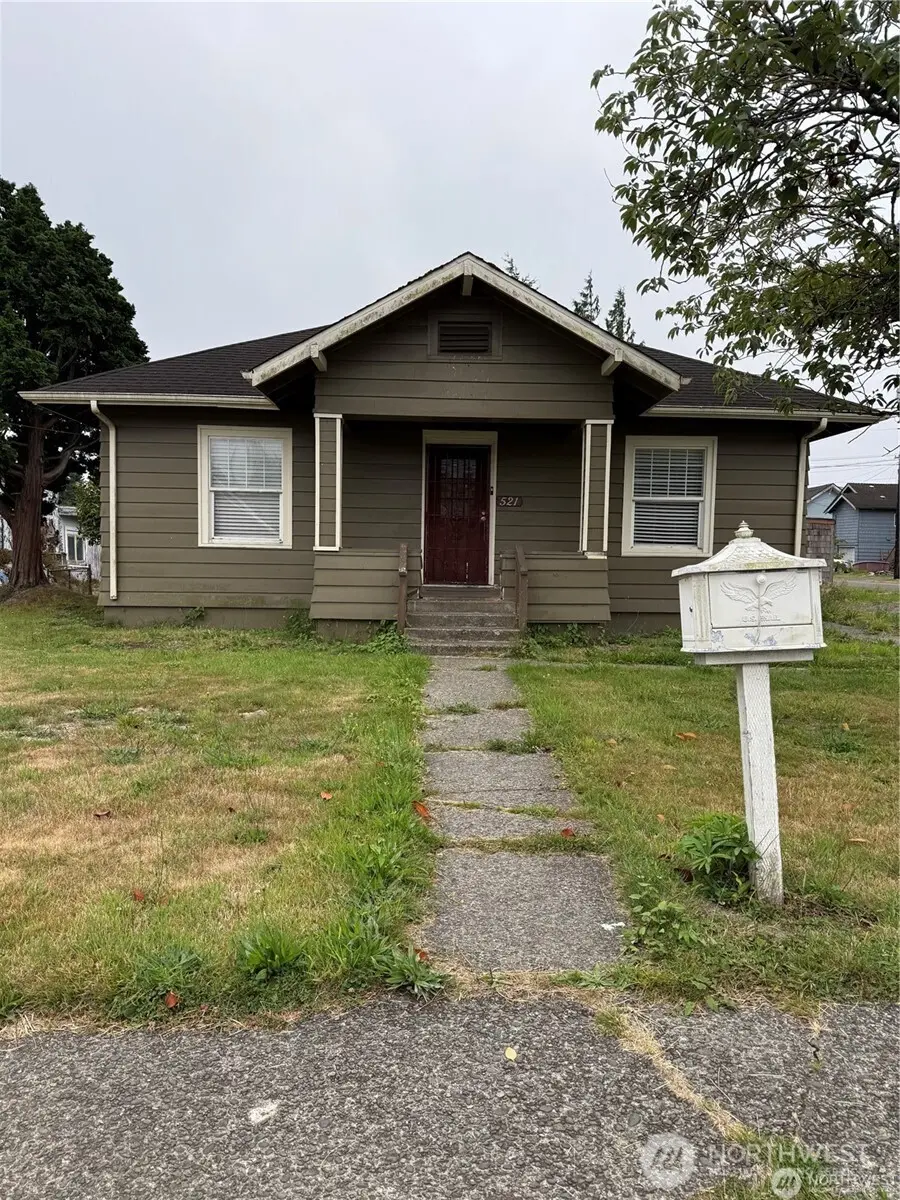
521 W King St · Aberdeen, WA
Flood risk No data
- FEMA flood zone
- —
- Chance of flooding over 30 yrs
- —
- Est. flood insurance / yr
- —
Fire risk No data
- Est. fire insurance / yr
- —
Heat risk No data
- Hot days now (above threshold)
- —
- Hot days in 30 yrs
- —
Wind risk No data
- Chance of severe wind over 30 yrs
- —
Air-quality risk No data
- Unhealthy air days now
- —
- Unhealthy air days in 30 yrs
- —
Risk factors via First Street. Map © Google.
Why this score? — see what drove the C- grade
The composite is a weighted blend of 9 inputs, each scored 0–100. Each bar is that input's sub-score; the figure is the points it added to the 100-point composite (weight × sub-score).
- Cash flow +15.0/30.0
- ARV discount +13.3/15.0
- DSCR +4.6/10.0
- Livability +4.0/5.0
- Rent growth +3.6/5.0
- Schools +3.6/10.0
- 1% rule +3.5/10.0
- Condition / age +2.5/5.0
- Appreciation +0.0/10.0
$230,000
🖨 Deal sheet 📄 Offer letter ✓ Due diligence
Listing remarks
SHORT-SALE! Discover this single-level South Side gem! Featuring 4 bedrooms and 2 baths across 1,700 + Sq. ft. , this home offers incredible value and endless potential. The versatile floor plan, complete with French doors, allows you to customize spaces to fit your lifestyle, whether you need a home office, hobby room, or a guest space. Outside, you'll love the oversized backyard and deck with plenty of room for gardening, fruit trees, or simply relaxing. Ample parking provides space for multiple vehicles, RV's, or toys. Don't miss this move in ready home in a desirable location.
Key facts
- Ample parking
- Deck
- Oversized backyard
Tags
Neighborhood map
What this means for you Summary
Snapshot
- This is a 5-bed/1.0-bath single-family listed at $230k.
Deal economics
- At list price, monthly cash flow is $74 ($884/yr) — positive.
- The deal already cash-flows at list — no discount required.
- To meet the 1% rule (rent ≥ 1% of price), the offer needs to be $195k (15.1% below list).
- Recommended offer: $195k (15.1% below list) — sets the bar for 1% rule.
- Cap rate 6.7% vs local median 4.1% in Aberdeen — top-decile yield for the area; either an underpriced asset or a hidden risk that comps aren't pricing in. Stress-test before assuming the spread holds.
Location & tenants
- Location reads 81/100 on livability (#73 in WA, #1,320 nationally) — a professional / high-income tenant draw. Strengths: amenities A+, commute A+, cost of living A+; Watch: schools D+, crime D-, employment F.
- Aberdeen School District (town): math 35% / reading 45% proficiency, ranked #222 of 291 in WA (top 76%) — families likely to look elsewhere, expect single-tenant / working-renter base with shorter leases; 61% free/reduced lunch — lower-income household profile, screen leases tightly.
- Market conditions: Rents rising fast (+4.3%/yr); 257 active listings in the ZIP; 297 units permitted in Grays Harbor County in 2024 (17 in 5+ unit buildings).
- This rent runs 40% of the median local income ($58k/yr) — at the standard rent-burdened threshold; future hikes will face affordability resistance.
Forward outlook
- Local home prices are declining (-3.0%/yr); year-one equity from $2k of loan paydown is wiped out by about $7k of value loss. Plan a longer hold.
- Grays Harbor County population projected at -24% by 2050 — secular population decline; favor cash flow + early exit over multi-decade hold.
Negotiation context
- It's been on market 241 days — a 12% lower offer ($202k) is reasonable based on typical stale-listing flexibility.
- 6 sale attempts since 21y ago; this cycle's ask has dropped $60k (21%) from the opening price — seller is motivated, your offer sets the floor, not the list.
Risks & watch-outs
- Watch-outs: built in 1910 — expect roof / HVAC / electrical / plumbing capex.
Questions for the listing agent
- It's been on market 241 days. Have you received any prior offers? Is the seller open to a 15% concession, seller financing, or rate buy-down credit?
- Built in 1910 — when were the roof, HVAC, electrical panel, plumbing, and water heater last replaced?
- Why hasn't it sold? Are there any deal-killer items the seller is aware of (foundation, flood, title, zoning, code violations)?
- Is there a deadline driving the sale (1031 exchange, divorce, estate, relocation)? That informs how much negotiation room exists.
- Schools are D-rated, which usually means shorter tenancies and higher turnover. Who's the typical renter profile here, and what's been the actual vacancy rate?
- Crime grade is D in this area — have there been break-ins, vandalism, or insurance claims at this property in the last 3 years? What carrier currently insures it and at what premium?
- What's the average days-on-market for RENTAL listings here right now (not sales)? A rising rental-DOM trend means longer vacancies and softer asking-rent achievability than the comps imply.
- What's the recent tenant-quality profile in this submarket — average credit score on applications, eviction rate, late-payment / NSF rate, and stable-employment percentage? A property-management company in the area should have these aggregated.
- How much new for-sale + rental construction is in the pipeline within 1–3 miles? Heavy new supply typically softens prices + rents 12–24 months out; constrained supply supports both.
Investment metrics
- 1% rule
- 0.85% ✗
- Cap rate
- 6.68%
- Cash-on-cash
- 1.37%
- DSCR
- 1.06
- GRM
- 9.8
CMA / ARV
- ARV (median comp)
- $264,113
- List price
- $230,000
- Delta
- -12.92%
- Verdict
- UNDERPRICED
- Comps
- 20 within 1.0 mi
Show comp detail 5 sales within ~0.75 mi
| Address | Dist | Beds/Ba | Sqft | Sold | Price | $/sf | Match |
|---|---|---|---|---|---|---|---|
| 1015 W Cushing St | 0.39mi | 4/1.0 (-1) | 1,582 (-9%) | 2mo | $237,500 | $150 | 60 |
| 414 W Scott St | 0.09mi | 4/1.5 (-1) | 1,531 (-12%) | 11mo | $330,000 | $216 | 60 |
| 1207 W Perry St | 0.56mi | 4/2.0 (-1) | 1,784 (+3%) | 1mo | $297,500 | $167 | 60 |
| 121 E Harriman St | 0.72mi | 4/3.0 (-1) | 1,952 (+12%) | 3mo | $355,000 | $182 | 31 |
| 412 E Perry St | 0.67mi | 4/2.0 (-1) | 1,983 (+14%) | 9mo | $326,000 | $164 | 29 |
Match score weights: distance 35% · size 25% · config 20% · recency 20%. Top-matched comps best support the ARV.
Projected returns pro-forma
-3.0% appreciation · 4.35% rent growth · sell at horizon
- IRR
- -12.7%
- Equity multiple
- 0.54×
- Total profit
- $-29,931
- Equity at exit
- $34,294
- IRR
- -1.9%
- Equity multiple
- 0.86×
- Total profit
- $-8,856
- Equity at exit
- $19,886
Cash invested: $64,400 (down + closing). Projections, not guarantees.
Landlord ↔ Tenant lean methodology
- Overall (STATE)
- 28 Tenant-Leaning
- State Washington
- 28 Tenant-Leaning · D+8
- County
- — inherits STATE
- City
- — inherits STATE
ZIP-level market 98520
- Rents YoY
- 4.3%
- Active inventory
- 257
- Price-to-rent
- 9.8×
Monthly cashflow live
- Estimated rent
- $1,954 medium interval (Pro) →
- Mortgage (P&I)
- −$1,206
- Tax from tax record
- −$168 /mo · $2,013/yr
- Insurance
- −$96
- HOA
- −$0
- Vacancy / Maint / Mgmt
- −$410
- Net cashflow
- $74
Break-even live
UW: 25.0% down · 7.5% · 30yr · 1.5% tax · 5.0% vac · 8.0% maint · 8.0% mgmt
Financing live
Cash to close
- Down payment
- $57,500
- Closing costs
- $6,900
- Reserves months
- —
- Total cash needed
- —
Loan-product check · same deal, 3 products live
Conventional
25% down · 7.5% · 30yr
- Down + closing
- —
- Monthly P&I
- —
- Monthly cashflow
- —
- DSCR
- —
- Eligible?
- —
Personal DTI + credit; lowest rate.
DSCR
20% down · 8.5% · 30yr
- Down + closing
- —
- Monthly P&I
- —
- Monthly cashflow
- —
- DSCR
- —
- Eligible?
- —
No personal income docs; deal must DSCR.
Hard money
10% down · 12.0% · 12mo
- Down + closing
- —
- Monthly P&I
- —
- Monthly cashflow
- —
- DSCR
- —
- Eligible?
- —
Short-term bridge; refi at stabilization.
Listing history 43 events
-
2026-06-19days on market $230,000 Active 241 DOM
-
2026-06-18days on market $230,000 Active 240 DOM
-
2026-06-17days on market $230,000 Active 239 DOM
-
2026-06-16days on market $230,000 Active 238 DOM
-
2026-06-15days on market $230,000 Active 237 DOM
-
2026-06-14days on market $230,000 Active 235 DOM
-
2026-06-12days on market $230,000 Active 234 DOM
-
2026-06-09days on market $230,000 Active 231 DOM
-
2026-06-08days on market $230,000 Active 230 DOM
-
2026-06-07pricedays on market $230,000 Active 229 DOM
-
2026-06-03days on market $245,000 Active 225 DOM
-
2026-06-02days on market $245,000 Active 224 DOM
-
2026-06-01days on market $245,000 Active 223 DOM
-
2026-05-31days on market $245,000 Active 222 DOM
-
2026-05-30days on market $245,000 Active 221 DOM
-
2026-02-22price $245,000
-
2026-01-17price $260,000
-
2025-12-12price $275,000
-
2025-11-08price $285,000
-
2025-10-21$290,000 Active
-
2021-11-29soldstatus $310,000 Closed
-
2021-11-29soldstatus $310,000
-
2021-10-25status Pending
-
2021-10-17$299,000 Active
-
2018-01-03soldstatus $130,000 Sold
-
2018-01-02soldstatus $130,000
-
2017-11-21status Pending
-
2017-10-26historical Pending - Backup Offer Requested
-
2017-10-22status Active
-
2017-10-18historical Pending - Backup Offer Requested
-
2017-10-14$130,000 Active
-
2009-11-25soldstatus $123,000 Sold
-
2009-11-25soldstatus $123,000
-
2009-10-09status Pending
-
2009-09-28status Pending Inspection
-
2009-07-09price $119,500
-
2009-03-12$123,900
-
2006-08-15soldstatus $120,000
-
2005-04-01soldstatus $105,000
-
2005-03-31soldstatus $105,000
-
2005-03-05$96,500
-
2000-04-04soldstatus $69,500
-
1997-03-13soldstatus $70,000
ⓘ Source: listings_history table (triggers on properties + properties_extension) + one-shot
backfill from property_details.listing_events for pre-trigger history.
Tax reassessment forecast WA · Resets to sale price
- Current annual tax
- $2,013 · $168/mo
- Projected year-2 tax
- $2,254 · $188/mo
- Expected delta
- +$241/yr (+$20/mo · 12.0%)
ⓘ Screening estimate from a state-policy table — verify with the county assessor before closing.
Nearby sold comps map
Loading sold comps map…
Walkable amenities ~0.75 mi
Loading nearby amenities…
Taxation est. · year 1
- Rental income
- $23,444
- − Mortgage interest
- −$12,884
- − Property taxes
- −$2,013
- − Insurance
- −$1,150
- − Repairs & maintenance
- −$1,876
- − Management
- −$1,876
- − Depreciation
- −$6,691
- Taxable loss
- −$3,044
- Est. tax savings @ 24.0%
- +$731
- After-tax cash flow
- $1,615/yr
For passive investors: Depreciation is non-cash, so a rental often shows a tax loss while cash-flowing — sheltering income. Rental losses are passive: they offset passive income freely, and up to $25,000/yr can offset ordinary (W-2) income if you actively participate and your MAGI is under $100k (phasing out to $0 by $150k); unused losses carry forward. On sale, claimed depreciation is recaptured at up to 25%, and gains may owe capital-gains tax (a 1031 exchange can defer both). Figures are a year-1 estimate at your 24.0% rate — not tax advice; consult a CPA.
Schools (NCES district)
- District
- Aberdeen School District
- NCES district ID
- 5300030
- Math proficiency
- 35% ▼ -1.00%
- Reading proficiency
- 45% ▬ 0.00%
- Median HH income
- $41,896
- Composite
- 36.13/100
- National rank
- #9477
- State rank
- #222 of 291 in WA
Livability — Aberdeen
- Score
- 81/100
- State rank
- #73
- US rank
- #1320
Category grades
Schools grade is shown separately in the Schools card above.
Census & demographics
- Census place
- Aberdeen, WA
- County
- Grays Harbor County · 44,693 people
- City population
- 24,888
- Metro
- Aberdeen, WA
- Population (ZIP)
- 24,888
- Household income
- $58,153
- Rent vs Own
- Severe rent burden
- 635.0
Population outlook (Grays Harbor County) Hauer SSP2
- Today (2025)
- 66,443 people
- By 2030
- 63,255 · -4.8%
- By 2040
- 56,466 · -15.0%
- By 2050
- 50,516 · -24.0%
- By 2075
- 39,296 · -40.9%
- By 2100
- 31,142 · -53.1%
Race, ethnicity, and origin ACS 2023
- Neighborhood character
- Predominantly White (70%)
- Race & ethnicity
- White 70% Hispanic / Latino 16% Two or more races 9% Black 4% Native American 3% Asian 1% Pacific Islander 1%
- Hispanic origin (detail)
- Mexican 11%
- Common ancestry
- Portuguese 4% Italian 3% Lithuanian 2%
- Foreign-born
- 7% · Canada
- Languages at home
- 87% English-only · Spanish 10% Other Asian/Pacific 1% German/W. Germanic 1%
Political lean MEDSL · Grays Harbor
- 2024 margin
- Lean R (+6.0) · D 45.6% · R 51.6% · Other 2.8%
- 2008→2024 swing
- -20.6pp toward R · 2008: 14.6pp · 2024: -6.0pp
- All cycles
- 2024: R+6.0 2020: R+6.6 2016: R+7.1 2012: D+14.0 2008: D+14.6
Not yet ingested
- Civics
- —
Market trends
- HPI YoY
- ▼ -138.75%
- Current HPI
- 207.7393
- Rent YoY
- ▲ 4.35%
- Metro
- Aberdeen, WA
- State GDP YoY
- ▲ 4.65%
- F500 in state
- 22
Industry mix (Fortune 500 HQ in WA)
| Industry | F500 HQs | Revenue |
|---|---|---|
| Retail | 2 | $269B |
|
||
| Technology / Retail | 1 | $638B |
|
||
| Technology | 1 | $245B |
|
||
| Telecommunications | 1 | $38B |
|
||
| Food / Beverage | 1 | $36B |
|
||
| Automotive / Trucks | 1 | $34B |
|
||
Price history
+250.0% since first listed28 events — show timeline
- 2026-02-22 Price Changed $245,000 NWMLS as Distributed by MLS Grid
- 2026-01-17 Price Changed $260,000 NWMLS as Distributed by MLS Grid
- 2025-12-12 Price Changed $275,000 NWMLS as Distributed by MLS Grid
- 2025-11-08 Price Changed $285,000 NWMLS as Distributed by MLS Grid
- 2025-10-21 Listed $290,000 NWMLS as Distributed by MLS Grid
- 2021-11-29 Sold (Public Records) $310,000 Public Records
- 2021-11-29 Sold (MLS) $310,000 NWMLS as Distributed by MLS Grid
- 2021-10-25 Pending — NWMLS as Distributed by MLS Grid
- 2021-10-17 Listed $299,000 NWMLS as Distributed by MLS Grid
- 2018-01-03 Sold (MLS) $130,000 NWMLS as Distributed by MLS Grid
- 2018-01-02 Sold (Public Records) $130,000 Public Records
- 2017-11-21 Pending — NWMLS as Distributed by MLS Grid
- 2017-10-26 Contingent — NWMLS as Distributed by MLS Grid
- 2017-10-22 Relisted — NWMLS as Distributed by MLS Grid
- 2017-10-18 Contingent — NWMLS as Distributed by MLS Grid
- 2017-10-14 Listed $130,000 NWMLS as Distributed by MLS Grid
- 2009-11-25 Sold (Public Records) $123,000 Public Records
- 2009-11-25 Sold (MLS) $123,000 NWMLS as Distributed by MLS Grid
- 2009-10-09 Pending — NWMLS as Distributed by MLS Grid
- 2009-09-28 Pending — NWMLS as Distributed by MLS Grid
- 2009-07-09 Price Changed $119,500 NWMLS as Distributed by MLS Grid
- 2009-03-12 Listed $123,900 NWMLS as Distributed by MLS Grid
- 2006-08-15 Sold (Public Records) $120,000 Public Records
- 2005-04-01 Sold (MLS) $105,000 NWMLS as Distributed by MLS Grid
- 2005-03-31 Sold (Public Records) $105,000 Public Records
- 2005-03-05 Listed $96,500 NWMLS as Distributed by MLS Grid
- 2000-04-04 Sold (Public Records) $69,500 Public Records
- 1997-03-13 Sold (Public Records) $70,000 Public Records
Property tax history
+3.7%/yrLatest (2026): $2,013 · -27.8% YoY. Source: county tax records.
Cash-flow waterfall
monthlySold comps — $/sqft
last 12 mo · ≤1 miLoading sold comps…