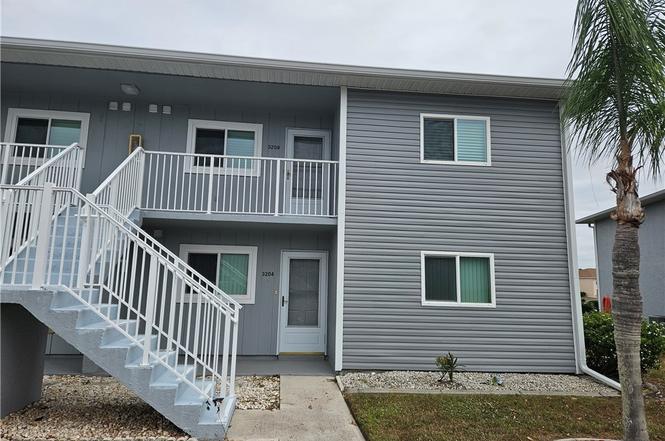
12274 SW Egret Cir #3208 · North Port, FL
Flood risk 1/10 · Minimal
- FEMA flood zone
- X (unshaded)
- Chance of flooding over 30 yrs
- 0.0%
- Est. flood insurance / yr
- $507 – $1,088
Fire risk 4/10 · Minor
- Est. fire insurance / yr
- $947 – $1,759
Heat risk 10/10 · Severe
- Hot days now (above 108°F)
- 7 days/yr
- Hot days in 30 yrs
- 30 days/yr
Wind risk 10/10 · Severe
- Chance of severe wind over 30 yrs
- 99.0%
Air-quality risk 2/10 · Minimal
- Unhealthy air days now
- 2 days/yr
- Unhealthy air days in 30 yrs
- 2 days/yr
Risk factors via First Street. Map © Google.
Why this score? — see what drove the C- grade
The composite is a weighted blend of 9 inputs, each scored 0–100. Each bar is that input's sub-score; the figure is the points it added to the 100-point composite (weight × sub-score).
- Cash flow +19.6/30.0
- 1% rule +8.1/10.0
- ARV discount +7.5/15.0
- DSCR +6.2/10.0
- Livability +3.8/5.0
- Schools +2.6/10.0
- Rent growth +2.5/5.0
- Condition / age +2.5/5.0
- Appreciation +0.6/10.0
$145,000
🖨 Deal sheet (PDF) 📄 Offer letter ✓ Due diligence
Listing remarks
Move-in ready 2-bedroom, 2-bath condo in the desirable Lake Suzy area, conveniently located just off Kings Highway. This inviting home offers a spacious living room and an open kitchen designed for comfort and functionality. The screened-in, enclosed balcony overlooking the pond provides a perfect Florida room for year-round enjoyment. Recently updated with new siding, the condo offers excellent curb appeal and low-maintenance living. Residents will enjoy access to a well-maintained community pool, clubhouse, and shuffleboard courts, making this a wonderful opportunity for relaxed Florida living in a prime location. This home is currently under probate and will require a closing on or after
Key facts
- Overlooking the pond
- Shuffleboard courts
- Clubhouse
Tags
Neighborhood map
What this means for you Summary
Snapshot
- This is a 2-bed/2.0-bath condo listed at $145k.
Deal economics
- At list price, monthly cash flow is $167 ($2k/yr) — positive.
- The deal already cash-flows at list — no discount required.
- Meets the 1% rule at list price ($2k rent vs $145k).
- Recommended offer: $136k (6.0% below list) — sets the bar for market timing.
- Cap rate 7.7% vs local median 3.6% in North Port — top-decile yield for the area; either an underpriced asset or a hidden risk that comps aren't pricing in. Stress-test before assuming the spread holds.
Location & tenants
- Location reads 75/100 on livability (#252 in FL, #3,975 nationally) — a middle-class / working-renter tenant base. Strengths: crime A+, housing A+, health & safety A+; Watch: amenities F, commute F.
- Desoto (town): math 31% / reading 32% proficiency, ranked #69 of 73 in FL (top 94%) — families likely to look elsewhere, expect single-tenant / working-renter base with shorter leases; 71% free/reduced lunch — lower-income household profile, screen leases tightly.
- Market conditions: 149 active listings in the ZIP; 8 comparable units currently listed for rent nearby; rentals at typical pace (median 23d on market — plan ~3-4 weeks tenant-placement turnaround); 71 units permitted in DeSoto County in 2024 (0 in 5+ unit buildings).
Forward outlook
- Local home prices are declining (-3.0%/yr); year-one equity from $1k of loan paydown is wiped out by about $4k of value loss. Plan a longer hold.
- DeSoto County population projected at -10% by 2050 — secular population decline; favor cash flow + early exit over multi-decade hold.
Negotiation context
- It's been on market 68 days — a 6% lower offer ($136k) is reasonable based on typical stale-listing flexibility.
- 2 sale attempts since 15y ago with the ask held roughly flat each time — persistent listings suggest the price (not the market) is what's stuck; bring a comps-based counter.
- Current owner paid $54k; list at $145k implies a 171% gain — meaningful room to come down on a strong offer.
Risks & watch-outs
- Climate carrying-cost: severe wind risk, 99% chance of damaging wind over 30y; extreme-heat days projected 7→30/yr by 2055 (HVAC capex compounding) — expect insurance premiums to compound above CPI over the hold.
Questions for the listing agent
- It's been on market 68 days. Have you received any prior offers? Is the seller open to a 6% concession, seller financing, or rate buy-down credit?
- What does the HOA fee cover, when was the last increase, and are there any pending special assessments or reserve-fund shortfalls?
- Any open or pending special assessments — roof, HVAC, plumbing, elevator, façade? What's the per-unit balance and payoff schedule, and is the seller paying it off at close or rolling it to the buyer?
- Why hasn't it sold? Are there any deal-killer items the seller is aware of (foundation, flood, title, zoning, code violations)?
- Is there a deadline driving the sale (1031 exchange, divorce, estate, relocation)? That informs how much negotiation room exists.
- Schools are B-rated — typically a magnet for longer-tenancy family renters. What's the average tenant stay here, and is there a school-zone premium baked into asking?
- What's the average days-on-market for RENTAL listings here right now (not sales)? A rising rental-DOM trend means longer vacancies and softer asking-rent achievability than the comps imply.
- What's the recent tenant-quality profile in this submarket — average credit score on applications, eviction rate, late-payment / NSF rate, and stable-employment percentage? A property-management company in the area should have these aggregated.
- How much new apartment / multifamily construction is in the pipeline within 1–3 miles? Heavy new supply (>2% of stock underway) typically softens rents 12–24 months out; light construction supports rent growth.
Investment metrics
- 1% rule
- 1.31% ✓
- Cap rate
- 7.67%
- Cash-on-cash
- 4.92%
- DSCR
- 1.22
- GRM
- 6.3
CMA / ARV
No comps found within radius.
Projected returns pro-forma
-3.0% appreciation · 3.0% rent growth · sell at horizon
- IRR
- -8.5%
- Equity multiple
- 0.69×
- Total profit
- $-12,653
- Equity at exit
- $21,620
- IRR
- 1.2%
- Equity multiple
- 1.09×
- Total profit
- $3,601
- Equity at exit
- $12,537
Cash invested: $40,600 (down + closing). Projections, not guarantees.
Landlord ↔ Tenant lean methodology
- Overall (STATE)
- 87 Strongly Landlord-Friendly
- State Florida
- 87 Strongly Landlord-Friendly · R+3
- County
- — inherits STATE
- City
- — inherits STATE
ZIP-level market 34269
- Home prices YoY
- -2.9%
- Active inventory
- 149
- Price-to-rent
- 6.3×
Monthly cashflow live
- Estimated rent
- $1,907 high interval (Pro) →
- Mortgage (P&I)
- −$760
- Tax from tax record
- −$227 /mo · $2,723/yr
- Insurance
- −$60
- HOA
- −$292
- Vacancy / Maint / Mgmt
- −$400
- Net cashflow
- $167
Break-even live
Sensitivity live
| Price | -10% $249 | -5% $208 | +0% $167 | +5% $126 | +10% $84 |
|---|---|---|---|---|---|
| Rent | -10% $16 | -5% $91 | +0% $167 | +5% $242 | +10% $317 |
| Rate | -1.0pp $240 | -0.5pp $203 | base $167 | +0.5pp $129 | +1.0pp $91 |
UW: 25.0% down · 7.5% · 30yr · 1.5% tax · 5.0% vac · 8.0% maint · 8.0% mgmt
Financing live
Cash to close
- Down payment
- $36,250
- Closing costs
- $4,350
- Reserves months
- —
- Total cash needed
- —
Loan-product check · same deal, 3 products live
Conventional
25% down · 7.5% · 30yr
- Down + closing
- —
- Monthly P&I
- —
- Monthly cashflow
- —
- DSCR
- —
- Eligible?
- —
Personal DTI + credit; lowest rate.
DSCR
20% down · 8.5% · 30yr
- Down + closing
- —
- Monthly P&I
- —
- Monthly cashflow
- —
- DSCR
- —
- Eligible?
- —
No personal income docs; deal must DSCR.
Hard money
10% down · 12.0% · 12mo
- Down + closing
- —
- Monthly P&I
- —
- Monthly cashflow
- —
- DSCR
- —
- Eligible?
- —
Short-term bridge; refi at stabilization.
Rent comps 8 comps
| Address | Beds | Baths | Sqft | Rent | $/sqft | DOM | Units | Dist |
|---|---|---|---|---|---|---|---|---|
| 12538 SW Kingsway Cir Lake Suzy, FL | 2.0 | 2.0 | 871 | $1,725 | $1.98 | 22d | 2 | 0.12mi |
| 11644 SW Egret Cir Lake Suzy, FL | 2.0–3.0 | 2.0 | 1249 | $2,500 | $2.00 | 22d | 4 | 0.25mi |
| 12235 SW Kingsway Cir Unit C6 Lake Suzy, FL | 2.0 | 2.0 | 1460 | $2,000 | $1.37 | 14d | 1 | 0.43mi |
| 175 Kings Hwy Unit A8 Punta Gorda, FL | 2.0 | 2.0 | 1228 | $1,700 | $1.38 | 22d | 1 | 0.97mi |
| 175 Kings Hwy Port Charlotte, FL | 2.0 | 2.0 | 1219 | $1,398 | $1.15 | 22d | 3 | 1.06mi |
| 24150 Beatrix Blvd Port Charlotte, FL | 3.0 | 1.0–2.0 | 866 | $1,735 | $2.00 | 14d | 42 | 1.31mi |
| 24001 Madaca Ln Port Charlotte, FL | 1.0–3.0 | 1.0–2.0 | 1179 | $1,720 | $1.46 | 14d | 26 | 1.37mi |
| 25230 Campos Dr Punta Gorda, FL | 3.0 | 2.0 | 1460 | $1,750 | $1.20 | 22d | 1 | 1.45mi |
HOA detail condo
- Monthly dues
- $292 · $3,504/yr
- Likely covers
- pool
- Assessments
- None detected in remarks — confirm with the listing agent.
Listing history 6 events
-
2026-02-16status Pending
-
2026-02-07price $145,000
-
2026-02-05price $125,000
-
2025-12-10$145,000 Active
-
2011-11-21$75,000
-
1999-04-01soldstatus $53,500
ⓘ Source: listings_history table (triggers on properties + properties_extension) + one-shot
backfill from property_details.listing_events for pre-trigger history.
Tax reassessment forecast FL · Resets to sale price
- Current annual tax
- $2,723 · $227/mo
- Projected year-2 tax
- $2,723 · $227/mo
- Expected delta
- $0/yr ($0/mo · 0.0%)
ⓘ Screening estimate from a state-policy table — verify with the county assessor before closing.
Climate risk First Street
- Flood 1/10 Low FEMA zone X (unshaded) · 0% chance over 30 yrs
- Wildfire 4/10 Moderate
- Heat 10/10 Extreme 7 d/yr ≥108°F today · 30 d/yr by 30 yrs out
- Wind 10/10 Extreme 99% chance of damaging wind over 30 yrs
- Air quality 2/10 Low 2 unhealthy d/yr today · 2 by 30 yrs out
Nearby sold comps map
Loading sold comps map…
Walkable amenities ~0.75 mi
Loading nearby amenities…
Taxation est. · year 1
- Rental income
- $22,881
- − Mortgage interest
- −$8,122
- − Property taxes
- −$2,723
- − Insurance
- −$725
- − Repairs & maintenance
- −$1,830
- − Management
- −$1,830
- − HOA
- −$3,504
- − Depreciation
- −$4,218
- Taxable loss
- −$73
- Est. tax savings @ 24.0%
- +$18
- After-tax cash flow
- $2,016/yr
For passive investors: Depreciation is non-cash, so a rental often shows a tax loss while cash-flowing — sheltering income. Rental losses are passive: they offset passive income freely, and up to $25,000/yr can offset ordinary (W-2) income if you actively participate and your MAGI is under $100k (phasing out to $0 by $150k); unused losses carry forward. On sale, claimed depreciation is recaptured at up to 25%, and gains may owe capital-gains tax (a 1031 exchange can defer both). Figures are a year-1 estimate at your 24.0% rate — not tax advice; consult a CPA.
Schools (NCES district)
- District
- Desoto
- NCES district ID
- 1200420
- Math proficiency
- 31% ▼ -9.00%
- Reading proficiency
- 32% ▼ -3.00%
- Median HH income
- $35,136
- Composite
- 26.03/100
- National rank
- #7305
- State rank
- #69 of 73 in FL
Livability — North Port
- Score
- 75/100
- State rank
- #252
- US rank
- #3975
Category grades
Schools grade is shown separately in the Schools card above.
Census & demographics
- City population
- 75,324
- Population (ZIP)
- 5,111
Population outlook (DeSoto County) Hauer SSP2
- Today (2025)
- 34,958 people
- By 2030
- 34,465 · -1.4%
- By 2040
- 33,137 · -5.2%
- By 2050
- 31,273 · -10.5%
- By 2075
- 23,898 · -31.6%
- By 2100
- 15,517 · -55.6%
Race, ethnicity, and origin ACS 2023
- Neighborhood character
- Predominantly White (83%)
- Race & ethnicity
- White 83% Hispanic / Latino 10% Two or more races 7% Black 4%
- Hispanic origin (detail)
- Mexican 8% Puerto Rican 2%
- Common ancestry
- Slovak 4% Romanian 3% Lithuanian 3%
- Foreign-born
- 3% · Canada
- Languages at home
- 94% English-only · Spanish 4% Other Indo-European 1% German/W. Germanic 1%
Political lean MEDSL · DeSoto
- 2024 margin
- Solid R (+42.9) · D 28.2% · R 71.2%
- 2008→2024 swing
- -30.6pp toward R · 2008: -12.3pp · 2024: -42.9pp
- All cycles
- 2024: R+42.9 2020: R+32.0 2016: R+27.7 2012: R+14.3 2008: R+12.3
Not yet ingested
- Civics
- —
Market trends
- HPI YoY
- ▼ -8.77%
- Current HPI
- 297.0303
- Rent YoY
- —
- Metro
- —
- State GDP YoY
- ▲ 3.28%
- F500 in state
- 36
Industry mix (Fortune 500 HQ in FL)
| Industry | F500 HQs | Revenue |
|---|---|---|
| Industrial Technology | 2 | $29B |
|
||
| Insurance | 2 | $17B |
|
||
| Retail | 1 | $60B |
|
||
| Technology Distribution | 1 | $58B |
|
||
| Homebuilding | 1 | $35B |
|
||
| Technology Manufacturing | 1 | $35B |
|
||
Price history
+171.0% since first listed6 events — show timeline
- 2026-02-16 Pending — FORTMLS
- 2026-02-07 Price Changed $145,000 FORTMLS
- 2026-02-05 Price Changed $125,000 FORTMLS
- 2025-12-10 Listed $145,000 FORTMLS
- 2011-11-21 Listed $75,000 Stellar MLS as Distributed by MLS Grid
- 1999-04-01 Sold (Public Records) $53,500 Public Records
Property tax history
+7.4%/yrLatest (2025): $2,723 · +5.7% YoY. Source: county tax records.
Cash-flow waterfall
monthlySold comps — $/sqft
last 12 mo · ≤1 miLoading sold comps…