 🔨 Auction
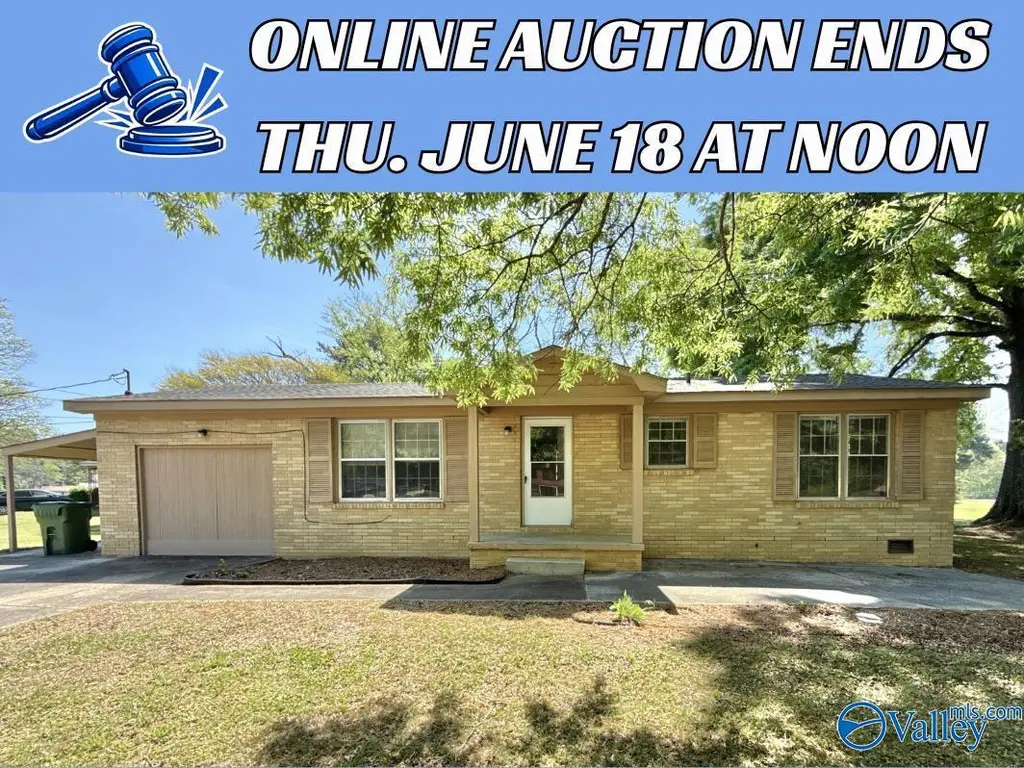
4216 Eastland Dr · Huntsville, AL
Flood risk 1/10 · Minimal
- FEMA flood zone
- X (unshaded)
- Chance of flooding over 30 yrs
- 0.0%
- Est. flood insurance / yr
- $507 – $1,088
Fire risk 1/10 · Minimal
- Est. fire insurance / yr
- $916 – $1,700
Heat risk 5/10 · Moderate
- Hot days now (above 105°F)
- 7 days/yr
- Hot days in 30 yrs
- 19 days/yr
Wind risk 4/10 · Minor
- Chance of severe wind over 30 yrs
- 15.0%
Air-quality risk 2/10 · Minimal
- Unhealthy air days now
- 1 days/yr
- Unhealthy air days in 30 yrs
- 1 days/yr
Risk factors via First Street. Map © Google.
Why this score? — see what drove the F grade
The composite is a weighted blend of 9 inputs, each scored 0–100. Each bar is that input's sub-score; the figure is the points it added to the 100-point composite (weight × sub-score).
- Cash flow +8.0/30.0
- ARV discount +7.5/15.0
- Livability +4.1/5.0
- Schools +2.9/10.0
- Rent growth +2.5/5.0
- Condition / age +2.5/5.0
- 1% rule +2.4/10.0
- DSCR +2.0/10.0
- Appreciation +0.0/10.0
$1
🖨 Deal sheet 📄 Offer letter ✓ Due diligence
Listing remarks
ONLINE AUCTION CLOSES Thursday, June 18, 2026 @ Noon • PREVIEW Sunday, June 14, 2026 from 2p-4p or by appt • This 3 bed, 1.75 bath home has been recently updated with fresh paint and new carpet. With a large family room, separate dining area, ample bedrooms, and unfinished bonus room (not included in sq. ft. ), there is more than enough space for everyone. Outside, relax on the wood deck overlooking the corner lot. This home would be an ideal investment or personal residence. Call today for your tour and be ready to place your winning bid online!
Key facts
- 0.4 acre lot
- Built 1963
- Listed 22 days
Property features AI
Finance
- Other: Directions available
- HOA & community: No homeowners association; Subdivision: Springhill Park
Exterior
- Parking: Attached carport
- Utilities: Public water; Public sewer
- Home design: Single-family residence; One story; Built in 1963
- Construction: Slab foundation
- Exterior features: Public water; Public sewer; Lot about 0.4 acre
Interior
- Bathrooms: 1 full bathroom; 1 three-quarter bathroom
- Heating & cooling: Central heating; Central cooling
- Interior features: Crawl space basement; 7 total rooms
Neighborhood map
What this means for you Summary
Snapshot
- This is a 3-bed/0.5-bath single-family listed at $1.
Deal economics
- At list price, monthly cash flow is $-213 ($-3k/yr) — negative.
- The deal already cash-flows at list — no discount required.
- Meets the 1% rule at list price ($2k rent vs $1).
- Cap rate 5.1% vs local median 3.8% in Huntsville — top-decile yield for the area; either an underpriced asset or a hidden risk that comps aren't pricing in. Stress-test before assuming the spread holds.
Location & tenants
- Location reads 82/100 on livability (#3 in AL, #1,082 nationally) — a professional / high-income tenant draw. Strengths: commute A+, cost of living A+, housing A+; Watch: crime F.
- Huntsville City (urban): math 21% / reading 46% proficiency, ranked #48 of 129 in AL (top 37%) — families likely to look elsewhere, expect single-tenant / working-renter base with shorter leases.
- Zoned schools: Rolling Hills Elementary School (math 4% / reading 17%, grade F, #565 of 627 statewide, top 90%, 483 students, 86% FRL); Jemison High School (math 12% / reading 12%, grade F, #242 of 305 statewide, top 80%, 843 students, 64% FRL) — zoned schools average 76% FRL vs 46% district-wide (29 pts higher); higher-poverty schools than district average — tighter screening recommended.
- Zoned-school proficiency averages 11% at this address vs 34% district-wide (-22 pts) — the specific schools serving this property underperform the Huntsville City average; the district grade overstates school quality for this exact location.
- Market conditions: Rents soft (-0.1%/yr); 337 active listings in the ZIP; 40 comparable units currently listed for rent nearby; rentals lingering (median 44d on market — plan ~5-8 weeks vacancy on turnover, expect pricing pressure); 58% of comp listings sitting > 30 days — soft ceiling on asking rent; 4,709 units permitted in Madison County in 2024 (1,186 in 5+ unit buildings).
- This rent runs 36% of the median local income ($51k/yr) — at the standard rent-burdened threshold; future hikes will face affordability resistance.
Forward outlook
- Local home prices are declining (-3.0%/yr); year-one equity from $1k of loan paydown is wiped out by about $6k of value loss. Plan a longer hold.
- Madison County population projected at +18% by 2050 — long-run rental-demand tailwind backs the buy-and-hold thesis.
Negotiation context
- It's been on market 22 days — a 2% lower offer ($0) is reasonable based on typical stale-listing flexibility.
Risks & watch-outs
- Watch-outs: property tax is 309696.0% of price.
- Climate carrying-cost: extreme-heat days projected 7→19/yr by 2055 (HVAC capex compounding) — expect insurance premiums to compound above CPI over the hold.
Questions for the listing agent
- What do current leases actually rent for vs. the listed asking? Can we see a recent rent roll and the last 12 months of T-12 income?
- Built in 1963 — when were the roof, HVAC, electrical panel, plumbing, and water heater last replaced?
- Property tax is high relative to price — has the assessment been appealed recently, and will the sale trigger a re-assessment?
- Is there a deadline driving the sale (1031 exchange, divorce, estate, relocation)? That informs how much negotiation room exists.
- Crime grade is F in this area — have there been break-ins, vandalism, or insurance claims at this property in the last 3 years? What carrier currently insures it and at what premium?
- The area grade is low — what's the realistic commute time and amenity access for the typical tenant pool here? Any planned neighborhood developments (good or bad) we should know about?
- What's the average days-on-market for RENTAL listings here right now (not sales)? A rising rental-DOM trend means longer vacancies and softer asking-rent achievability than the comps imply.
- What's the recent tenant-quality profile in this submarket — average credit score on applications, eviction rate, late-payment / NSF rate, and stable-employment percentage? A property-management company in the area should have these aggregated.
- How much new for-sale + rental construction is in the pipeline within 1–3 miles? Heavy new supply typically softens prices + rents 12–24 months out; constrained supply supports both.
Investment metrics
- 1% rule
- 0.74% ✗
- Cap rate
- 5.05%
- Cash-on-cash
- -4.42%
- DSCR
- 0.80
- GRM
- 11.2
CMA / ARV
- ARV (on-the-fly)
- $206,464
- Comps found
- 12
Show comp detail 12 sales within ~0.75 mi
| Address | Dist | Beds/Ba | Sqft | Sold | Price | $/sf | Match |
|---|---|---|---|---|---|---|---|
| 2657 Ajs Arbor Dr | 0.43mi | 3/2.0 | 1,620 (+0%) | 3mo | $275,000 | $170 | 70 |
| 4212 Tee Jay Cir | 0.14mi | 3/3.5 | 1,730 (+7%) | 3mo | $219,000 | $127 | 67 |
| 4833 Benjamins Bloom Loop | 0.47mi | 3/2.0 | 1,620 (+0%) | 9mo | $279,000 | $172 | 64 |
| 2703 Oakdale Ter | 0.30mi | 3/2.0 | 1,718 (+6%) | 7mo | $198,000 | $115 | 63 |
| 3728 Oakdale Ct NW | 0.20mi | 3/2.0 | 1,793 (+11%) | 5mo | $230,000 | $128 | 62 |
| 2702 Oakdale Ter | 0.28mi | 4/2.0 (+1) | 1,497 (-7%) | 5mo | $250,000 | $167 | 60 |
| 3625 Marymont Dr NW | 0.41mi | 4/2.0 (+1) | 1,523 (-6%) | 2mo | $225,000 | $148 | 59 |
| 4805 Drews Dogwood Ln | 0.46mi | 3/2.0 | 1,484 (-8%) | 3mo | $266,184 | $179 | 57 |
| 2803 Eva Dr NW | 0.70mi | 3/2.0 | 1,541 (-4%) | 4mo | $150,000 | $97 | 51 |
| 4316 Barry St NW | 0.30mi | 4/2.0 (+1) | 1,400 (-13%) | 6mo | $155,000 | $111 | 48 |
| 4023 NW Knollbrook Dr | 0.71mi | 3/1.5 | 1,462 (-9%) | 6mo | $172,375 | $118 | 42 |
| 3900 Blue Spring Rd | 0.47mi | 4/2.5 (+1) | 1,792 (+11%) | 9mo | $120,500 | $67 | 40 |
Match score weights: distance 35% · size 25% · config 20% · recency 20%. Top-matched comps best support the ARV.
Projected returns pro-forma
-3.0% appreciation · 0.0% rent growth · sell at horizon
- IRR
- -27.2%
- Equity multiple
- 0.11×
- Total profit
- $-51,505
- Equity at exit
- $30,784
- IRR
- -40.4%
- Equity multiple
- -0.38×
- Total profit
- $-79,629
- Equity at exit
- $17,851
Cash invested: $57,810 (down + closing). Projections, not guarantees.
Landlord ↔ Tenant lean methodology
- Overall (STATE)
- 90 Strongly Landlord-Friendly
- State Alabama
- 90 Strongly Landlord-Friendly · R+15
- County
- — inherits STATE
- City
- — inherits STATE
ZIP-level market 35810
- Home prices YoY
- -23.5%
- Rents YoY
- -0.1%
- Active inventory
- 337
Monthly cashflow live
- Estimated rent
- $1,536 high interval (Pro) →
- Mortgage (P&I)
- −$1,083
- Tax est. 1.5%
- −$258 /mo · $3,097/yr
- Insurance
- −$86
- HOA
- −$0
- Vacancy / Maint / Mgmt
- −$323
- Net cashflow
- $-213
Break-even live
UW: 25.0% down · 7.5% · 30yr · 1.5% tax · 5.0% vac · 8.0% maint · 8.0% mgmt
Financing live
Cash to close
- Down payment
- $51,616
- Closing costs
- $6,194
- Reserves months
- —
- Total cash needed
- —
Loan-product check · same deal, 3 products live
Conventional
25% down · 7.5% · 30yr
- Down + closing
- —
- Monthly P&I
- —
- Monthly cashflow
- —
- DSCR
- —
- Eligible?
- —
Personal DTI + credit; lowest rate.
DSCR
20% down · 8.5% · 30yr
- Down + closing
- —
- Monthly P&I
- —
- Monthly cashflow
- —
- DSCR
- —
- Eligible?
- —
No personal income docs; deal must DSCR.
Hard money
10% down · 12.0% · 12mo
- Down + closing
- —
- Monthly P&I
- —
- Monthly cashflow
- —
- DSCR
- —
- Eligible?
- —
Short-term bridge; refi at stabilization.
Rent comps 40 comps
| Address | Beds | Baths | Sqft | Rent | $/sqft | DOM | Units | Dist |
|---|---|---|---|---|---|---|---|---|
| 2506 Jeri St NW Huntsville, AL | 3.0 | 1.5 | 1274 | $1,400 | $1.10 | 23d | 1 | 0.21mi |
| 4114 Blue Spring Rd NW Huntsville, AL | 3.0 | 2.0 | 1100 | $1,500 | $1.36 | 23d | 1 | 0.25mi |
| 2602 Gibson St NW Huntsville, AL | 4.0 | 2.0 | 1795 | $1,625 | $0.91 | 43d | 1 | 0.34mi |
| 3904 Battlefield Dr NW Huntsville, AL | 4.0 | 2.0 | 1890 | $1,600 | $0.85 | 43d | 1 | 0.35mi |
| 2519 Birchfield St NW Huntsville, AL | 3.0 | 1.5 | 1125 | $1,195 | $1.06 | 43d | 1 | 0.57mi |
| 3811 Lakeview Dr NW Huntsville, AL | 3.0 | 2.0 | 1707 | $1,350 | $0.79 | 43d | 1 | 0.63mi |
| 2415 Vining Ave NW Huntsville, AL | 3.0 | 1.0 | 1079 | $1,250 | $1.16 | 13d | 1 | 0.72mi |
| 2206 Harris Rd NW Huntsville, AL | 3.0 | 1.0 | 1354 | $1,400 | $1.03 | 43d | 1 | 0.74mi |
| 2801 Penland Ave NW Huntsville, AL | 3.0 | 2.0 | 1650 | $1,450 | $0.88 | 23d | 1 | 0.75mi |
| 5025 Blue Spring Rd NW Huntsville, AL | 3.0 | 2.5 | 1273 | $1,195 | $0.94 | 13d | 2 | 0.76mi |
| 4408 Kenwood Dr NW Huntsville, AL | 3.0 | 1.5 | 1520 | $1,195 | $0.79 | 43d | 1 | 0.85mi |
| 3205 Lewisburg Dr NW Huntsville, AL | 3.0 | 2.0 | 1408 | $1,600 | $1.14 | 23d | 1 | 0.87mi |
| 6000 Cherokee Hills Dr NW Huntsville, AL | 3.0 | 2.0 | 1086 | $1,600 | $1.47 | 23d | 1 | 0.91mi |
| 2106 Sullivan Rd NW Huntsville, AL | 3.0 | 1.5 | 1690 | $1,195 | $0.71 | 44d | 1 | 0.94mi |
| 2200 Norwood Dr NW Huntsville, AL | 3.0 | 1.0 | 1060 | $1,150 | $1.08 | 23d | 1 | 0.98mi |
| 2113 Norris Rd NW Huntsville, AL | 3.0 | 1.0 | 1372 | $1,550 | $1.13 | 43d | 1 | 0.99mi |
| 3708 Valleydale Rd NW Huntsville, AL | 3.0 | 1.5 | 1136 | $1,350 | $1.19 | 43d | 1 | 0.99mi |
| 3013 Kirkland Dr NW Huntsville, AL | 3.0 | 1.5 | 1324 | $1,295 | $0.98 | 43d | 1 | 0.99mi |
| 4005 Memorial Pkwy NW Huntsville, AL | 3.0 | 1.0 | 1100 | $1,375 | $1.25 | 43d | 1 | 1.05mi |
| 3014 Winchester Rd NW Huntsville, AL | 2.0 | 2.0 | 1480 | $2,500 | $1.69 | 43d | 1 | 1.06mi |
| 3505 Mastin Lake Rd NW Huntsville, AL | 3.0 | 2.0 | 1376 | $2,000 | $1.45 | 43d | 1 | 1.08mi |
| 2803 Hester Ln NW Huntsville, AL | 3.0 | 1.5 | 1224 | $1,400 | $1.14 | 23d | 1 | 1.10mi |
| 3202 Deerfield Rd NW Huntsville, AL | 3.0 | 2.0 | 1234 | $1,425 | $1.15 | 43d | 1 | 1.12mi |
| 3707 Lakewood Dr NW Huntsville, AL | 3.0 | 1.0 | 1100 | $1,100 | $1.00 | 43d | 1 | 1.13mi |
| 5003 Stag Run Cir NW Huntsville, AL | 3.0 | 2.0 | 1410 | $1,450 | $1.03 | 13d | 1 | 1.14mi |
| 2117 Atkins Dr NW Huntsville, AL | 3.0 | 2.0 | 1250 | $1,699 | $1.36 | 23d | 1 | 1.21mi |
| 3606 Lakewood Rd NW Huntsville, AL | 3.0 | 1.5 | 1408 | $1,400 | $0.99 | 43d | 1 | 1.24mi |
| 3306 Reynolds Dr NW Huntsville, AL | 3.0 | 2.0 | 1636 | $1,800 | $1.10 | 23d | 1 | 1.24mi |
| 2640 Blue Spring Rd NW Huntsville, AL | 1.0–3.0 | 1.0–2.0 | 944 | $1,149 | $1.22 | 43d | 3 | 1.26mi |
| 3803 Mastin Lake Rd NW Huntsville, AL | 3.0 | 1.0 | 1103 | $1,295 | $1.17 | 43d | 1 | 1.29mi |
| 3103 Sonya Dr NW Huntsville, AL | 3.0 | 1.0 | 1101 | $1,399 | $1.27 | 23d | 1 | 1.29mi |
| 3614 Wilbur Ave NW Huntsville, AL | 3.0 | 1.5 | 1196 | $1,420 | $1.19 | 23d | 1 | 1.34mi |
| 3729 Millbrae Dr NW Huntsville, AL | 3.0 | 1.0 | 1050 | $1,458 | $1.39 | 13d | 1 | 1.37mi |
| 3616 Hester Ln NW Huntsville, AL | 4.0 | 2.0 | 1650 | $1,350 | $0.82 | 43d | 1 | 1.39mi |
| 3314 Deerfield Rd NW Huntsville, AL | 3.0 | 2.0 | 1207 | $1,350 | $1.12 | 43d | 1 | 1.40mi |
| 3058 Boswell Dr NW Huntsville, AL | 4.0 | 2.0 | 1450 | $1,398 | $0.96 | 43d | 1 | 1.43mi |
| 3203 Dyas Dr NW Huntsville, AL | 3.0 | 2.0 | 1346 | $2,100 | $1.56 | 23d | 1 | 1.44mi |
| 3814 Timwood Dr NW Huntsville, AL | 3.0 | 2.0 | 1157 | $1,195 | $1.03 | 43d | 1 | 1.45mi |
| 2212 Ricky Rd NW Huntsville, AL | 3.0 | 2.0 | 1539 | $1,400 | $0.91 | 23d | 1 | 1.45mi |
| 3813 Millbrae Dr NW Huntsville, AL | 4.0 | 2.0 | 1500 | $1,895 | $1.26 | 43d | 1 | 1.47mi |
Listing history 18 events
-
2026-06-18days on market $1 Active 22 DOM
-
2026-06-17days on market $1 Active 21 DOM
-
2026-06-16days on market $1 Active 20 DOM
-
2026-06-15days on market $1 Active 19 DOM
-
2026-06-14days on market $1 Active 17 DOM
-
2026-06-10days on market $1 Active 14 DOM
-
2026-06-09days on market $1 Active 13 DOM
-
2026-06-08days on market $1 Active 12 DOM
-
2026-06-07days on market $1 Active 11 DOM
-
2026-06-03days on market $1 Active 7 DOM
-
2026-06-02days on market $1 Active 6 DOM
-
2026-06-01days on market $1 Active 5 DOM
-
2026-05-31days on market $1 Active 4 DOM
-
2026-05-30days on market $1 Active 3 DOM
-
2026-05-27$1 Active
-
2020-01-17soldstatus $92,000
-
2018-06-04soldstatus $93,400
-
2017-06-08soldstatus $550,500
ⓘ Source: listings_history table (triggers on properties + properties_extension) + one-shot
backfill from property_details.listing_events for pre-trigger history.
Climate risk First Street
- Flood 1/10 Low FEMA zone X (unshaded) · 0% chance over 30 yrs
- Wildfire 1/10 Low
- Heat 5/10 Major 7 d/yr ≥105°F today · 19 d/yr by 30 yrs out
- Wind 4/10 Moderate 15% chance of damaging wind over 30 yrs
- Air quality 2/10 Low 1 unhealthy d/yr today · 1 by 30 yrs out
Nearby sold comps map
Loading sold comps map…
Walkable amenities ~0.75 mi
Loading nearby amenities…
Taxation est. · year 1
- Rental income
- $18,437
- − Mortgage interest
- −$11,565
- − Property taxes
- −$3,097
- − Insurance
- −$1,032
- − Repairs & maintenance
- −$1,475
- − Management
- −$1,475
- − Depreciation
- −$6,006
- Taxable loss
- −$6,214
- Est. tax savings @ 24.0%
- +$1,491
- After-tax cash flow
- $-1,065/yr
For passive investors: Depreciation is non-cash, so a rental often shows a tax loss while cash-flowing — sheltering income. Rental losses are passive: they offset passive income freely, and up to $25,000/yr can offset ordinary (W-2) income if you actively participate and your MAGI is under $100k (phasing out to $0 by $150k); unused losses carry forward. On sale, claimed depreciation is recaptured at up to 25%, and gains may owe capital-gains tax (a 1031 exchange can defer both). Figures are a year-1 estimate at your 24.0% rate — not tax advice; consult a CPA.
Schools (NCES district)
- District
- Huntsville City
- NCES district ID
- 0101800
- Math proficiency
- 21% ▼ -23.00%
- Reading proficiency
- 46% ▬ 0.00%
- Median HH income
- $48,264
- Composite
- 28.84/100
- National rank
- #6647
- State rank
- #48 of 129 in AL
Livability — Huntsville
- Score
- 82/100
- State rank
- #3
- US rank
- #1082
Category grades
Schools grade is shown separately in the Schools card above.
Census & demographics
- Census place
- Huntsville, AL
- County
- Madison County · 380,832 people
- City population
- 220,435
- Metro
- Huntsville, AL
- Population (ZIP)
- 32,843
- Household income
- $51,233
- Rent vs Own
- Severe rent burden
- 1223.0
Population outlook (Madison County) Hauer SSP2
- Today (2025)
- 392,086 people
- By 2030
- 409,788 · +4.5%
- By 2040
- 440,557 · +12.4%
- By 2050
- 460,990 · +17.6%
- By 2075
- 502,872 · +28.3%
- By 2100
- 513,623 · +31.0%
Race, ethnicity, and origin ACS 2023
- Neighborhood character
- Predominantly Black (69%)
- Race & ethnicity
- Black 69% White 18% Hispanic / Latino 9% Two or more races 5%
- Hispanic origin (detail)
- Mexican 3% Puerto Rican 2% Dominican 2%
- Common ancestry
- Italian 2% Lithuanian 0%
- Foreign-born
- 6% · Canada
- Languages at home
- 92% English-only · Spanish 7%
Political lean MEDSL · Madison
- 2024 margin
- Lean R (+9.0) · D 44.7% · R 53.7% · Other 1.6%
- 2008→2024 swing
- +6.0pp toward D · 2008: -14.9pp · 2024: -9.0pp
- All cycles
- 2024: R+9.0 2020: R+8.0 2016: R+16.8 2012: R+18.7 2008: R+14.9
Not yet ingested
- Civics
- —
Market trends
- HPI YoY
- ▼ -61.00%
- Current HPI
- 198.9629
- Rent YoY
- ▬ -0.05%
- Metro
- Huntsville, AL
- State GDP YoY
- ▲ 2.94%
- F500 in state
- 4
Industry mix (Fortune 500 HQ in AL)
| Industry | F500 HQs | Revenue |
|---|---|---|
| Financial Services | 1 | $8B |
|
||
| Healthcare | 1 | $5B |
|
||
Price history
-83.3% since first listed4 events — show timeline
- 2026-05-27 Listed $1 VMLS
- 2020-01-17 Sold (Public Records) $92,000 Public Records
- 2018-06-04 Sold (Public Records) $93,400 Public Records
- 2017-06-08 Sold (Public Records) $550,500 Public Records
Property tax history
+6.9%/yrLatest (2024): $1,569 · +8.8% YoY. Source: county tax records.
Cash-flow waterfall
monthlySold comps — $/sqft
last 12 mo · ≤1 miLoading sold comps…