 🏗️ New Construction
488 Garren Ln · Carlyss, LA
Flood risk No data
- FEMA flood zone
- —
- Chance of flooding over 30 yrs
- —
- Est. flood insurance / yr
- —
Fire risk No data
- Est. fire insurance / yr
- —
Heat risk No data
- Hot days now (above threshold)
- —
- Hot days in 30 yrs
- —
Wind risk No data
- Chance of severe wind over 30 yrs
- —
Air-quality risk No data
- Unhealthy air days now
- —
- Unhealthy air days in 30 yrs
- —
Risk factors via First Street. Map © Google.
Why this score? — see what drove the C- grade
The composite is a weighted blend of 9 inputs, each scored 0–100. Each bar is that input's sub-score; the figure is the points it added to the 100-point composite (weight × sub-score).
- Cash flow +20.1/30.0
- ARV discount +7.5/15.0
- DSCR +6.4/10.0
- 1% rule +5.3/10.0
- Condition / age +5.0/5.0
- Schools +3.1/10.0
- Livability +3.1/5.0
- Rent growth +2.5/5.0
- Appreciation +0.0/10.0
$244,230
🖨 Deal sheet 📄 Offer letter ✓ Due diligence
Listing remarks
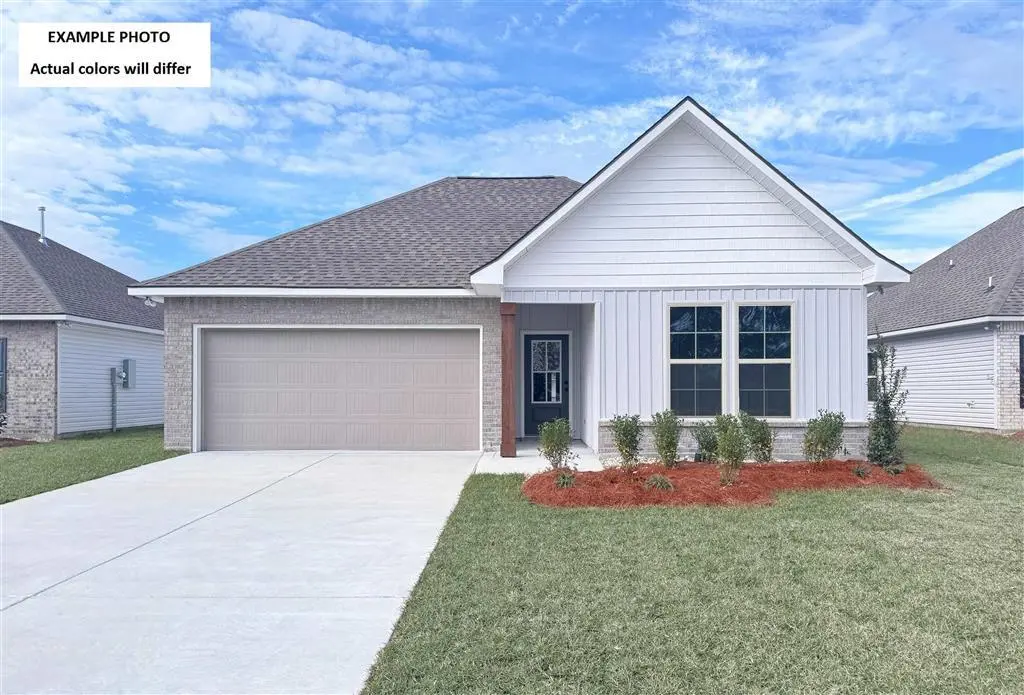
Located on a Corner Lot! Brand NEW Construction in Maggy’s Ridge, a beautiful new construction community in Sulphur, Louisiana, proudly built by DSLD Homes. The YARDLEY III G has an open designed floor plan with 4 bedrooms & 2.5 bathrooms. This home includes upgraded canned lighting & more. Special plan features include granite counters, kitchen island, undermount kitchen sink, vinyl plank flooring in living room & wet areas, energy efficient appliances (range, dishwasher & microwave hood), garden tub & separate shower in primary suite, low E tilt-in windows, smart connect Wi-Fi thermostat, covered rear porch, architectural roof with 30-year shingles, pos
Key facts
- 7,672 sq ft lot
- 2 garage spots
- Built 2026
Neighborhood map
What this means for you Summary
Snapshot
- This is a 4-bed/2.5-bath single-family listed at $244k. Condition is rated excellent.
Deal economics
- At list price, monthly cash flow is $316 ($4k/yr) — positive.
- The deal already cash-flows at list — no discount required.
- Meets the 1% rule at list price ($3k rent vs $244k).
Location & tenants
- Location reads 61/100 on livability (#237 in LA) — a middle-class / working-renter tenant base. Strengths: cost of living A+, housing A+, employment B; Watch: crime D-, amenities F, commute F.
- Calcasieu Parish (other): math 30% / reading 44% proficiency, ranked #29 of 98 in LA (top 30%) — families likely to look elsewhere, expect single-tenant / working-renter base with shorter leases.
- Zoned schools: Vincent Settlement Elementary School (math 62% / reading 67%, grade B, #40 of 646 statewide, top 7%, 321 students, 41% FRL); W. W. Lewis Middle School (math 33% / reading 48%, grade F, #62 of 218 statewide, top 29%, 777 students, 49% FRL); Sulphur High School (math 36% / reading 53%, grade F, #58 of 265 statewide, top 23%, 2,043 students, 47% FRL).
- Zoned-school proficiency averages 50% at this address vs 37% district-wide (+13 pts) — the actual schools serving this property are materially stronger than the Calcasieu Parish average implies; a family-tenant draw the district grade alone would hide.
- Market conditions: 236 active listings in the ZIP; 1,298 units permitted in Calcasieu Parish in 2024 (526 in 5+ unit buildings).
Forward outlook
- Local home prices are declining (-3.0%/yr); year-one equity from $2k of loan paydown is wiped out by about $8k of value loss. Plan a longer hold.
- Calcasieu County population projected at +11% by 2050 — modest demand growth; plan on rents tracking national, not racing it.
Negotiation context
- Only 0 days on market — expect competitive offers; lowballing is unlikely to land.
Questions for the listing agent
- Is there a deadline driving the sale (1031 exchange, divorce, estate, relocation)? That informs how much negotiation room exists.
- Schools are F-rated, which usually means shorter tenancies and higher turnover. Who's the typical renter profile here, and what's been the actual vacancy rate?
- Crime grade is D in this area — have there been break-ins, vandalism, or insurance claims at this property in the last 3 years? What carrier currently insures it and at what premium?
- What's the average days-on-market for RENTAL listings here right now (not sales)? A rising rental-DOM trend means longer vacancies and softer asking-rent achievability than the comps imply.
- What's the recent tenant-quality profile in this submarket — average credit score on applications, eviction rate, late-payment / NSF rate, and stable-employment percentage? A property-management company in the area should have these aggregated.
- How much new for-sale + rental construction is in the pipeline within 1–3 miles? Heavy new supply typically softens prices + rents 12–24 months out; constrained supply supports both.
Investment metrics
- 1% rule
- 1.03% ✓
- Cap rate
- 7.79%
- Cash-on-cash
- 5.36%
- DSCR
- 1.24
- GRM
- 8.1
CMA / ARV
- ARV (on-the-fly)
- $252,954
- Comps found
- 3
Show comp detail 3 sales within ~0.75 mi
| Address | Dist | Beds/Ba | Sqft | Sold | Price | $/sf | Match |
|---|---|---|---|---|---|---|---|
| 5231 Winnie Dr | 0.51mi | 4/3.0 | 1,841 (+0%) | 9mo | $275,000 | $149 | 66 |
| 222 Tara St | 0.35mi | 4/2.0 | 1,800 (-2%) | 20mo | $155,000 | $86 | 63 |
| 470 Garren Ln | 0.00mi | 3/2.0 (-1) | 1,686 (-8%) | 23mo | $232,900 | $138 | 61 |
Match score weights: distance 35% · size 25% · config 20% · recency 20%. Top-matched comps best support the ARV.
Projected returns pro-forma
-3.0% appreciation · 3.0% rent growth · sell at horizon
- IRR
- -8.0%
- Equity multiple
- 0.71×
- Total profit
- $-20,792
- Equity at exit
- $37,716
- IRR
- 1.6%
- Equity multiple
- 1.11×
- Total profit
- $8,011
- Equity at exit
- $21,871
Cash invested: $70,827 (down + closing). Projections, not guarantees.
Landlord ↔ Tenant lean methodology
- Overall (STATE)
- 90 Strongly Landlord-Friendly
- State Louisiana
- 90 Strongly Landlord-Friendly · R+12
- County
- — inherits STATE
- City
- — inherits STATE
ZIP-level market 70665
- Active inventory
- 236
- Price-to-rent
- 7.8×
Monthly cashflow live
- Estimated rent
- $2,613 medium interval (Pro) →
- Mortgage (P&I)
- −$1,327
- Tax est. 1.5%
- −$316 /mo · $3,794/yr
- Insurance
- −$105
- HOA
- −$0
- Vacancy / Maint / Mgmt
- −$549
- Net cashflow
- $316
Break-even live
UW: 25.0% down · 7.5% · 30yr · 1.5% tax · 5.0% vac · 8.0% maint · 8.0% mgmt
Financing live
Cash to close
- Down payment
- $63,238
- Closing costs
- $7,589
- Reserves months
- —
- Total cash needed
- —
Loan-product check · same deal, 3 products live
Conventional
25% down · 7.5% · 30yr
- Down + closing
- —
- Monthly P&I
- —
- Monthly cashflow
- —
- DSCR
- —
- Eligible?
- —
Personal DTI + credit; lowest rate.
DSCR
20% down · 8.5% · 30yr
- Down + closing
- —
- Monthly P&I
- —
- Monthly cashflow
- —
- DSCR
- —
- Eligible?
- —
No personal income docs; deal must DSCR.
Hard money
10% down · 12.0% · 12mo
- Down + closing
- —
- Monthly P&I
- —
- Monthly cashflow
- —
- DSCR
- —
- Eligible?
- —
Short-term bridge; refi at stabilization.
Nearby sold comps map
Loading sold comps map…
Walkable amenities ~0.75 mi
Loading nearby amenities…
Taxation est. · year 1
- Rental income
- $31,361
- − Mortgage interest
- −$14,169
- − Property taxes
- −$3,794
- − Insurance
- −$1,265
- − Repairs & maintenance
- −$2,509
- − Management
- −$2,509
- − Depreciation
- −$7,359
- Taxable loss
- −$244
- Est. tax savings @ 24.0%
- +$59
- After-tax cash flow
- $3,856/yr
For passive investors: Depreciation is non-cash, so a rental often shows a tax loss while cash-flowing — sheltering income. Rental losses are passive: they offset passive income freely, and up to $25,000/yr can offset ordinary (W-2) income if you actively participate and your MAGI is under $100k (phasing out to $0 by $150k); unused losses carry forward. On sale, claimed depreciation is recaptured at up to 25%, and gains may owe capital-gains tax (a 1031 exchange can defer both). Figures are a year-1 estimate at your 24.0% rate — not tax advice; consult a CPA.
Condition & rehab AI · 2 photos
This brand-new construction home in Maggy’s Ridge is in excellent condition with no visible repairs needed. It offers a good ROI with potential for landscaping and interior updates to further enhance its appeal.
Value-add opportunities
- Both Landscaping and curb appeal improvements — Enhances curb appeal and could attract more buyers
- Both Interior paint touch-ups — Fresh paint can make the home look more inviting
- Both Add smart home features — Modernizes the home and adds value for tech-savvy buyers
Renovation cost estimate screening
Value-add ROI direction
- Both Landscaping and curb appeal improvements — Enhances curb appeal and could attract more buyers ↑
- Both Interior paint touch-ups — Fresh paint can make the home look more inviting ↑
- Both Add smart home features — Modernizes the home and adds value for tech-savvy buyers ↑
ⓘ Cost ranges are severity-bucket heuristics (US national rule-of-thumb). Get contractor quotes + a written scope before underwriting a rehab budget.
Schools (NCES district)
- District
- Calcasieu Parish
- NCES district ID
- 2200330
- Math proficiency
- 30% ▼ -39.00%
- Reading proficiency
- 44% ▼ -33.00%
- Median HH income
- $44,700
- Composite
- 31.45/100
- National rank
- #5979
- State rank
- #29 of 98 in LA
Livability — Carlyss
- Score
- 61/100
- State rank
- #237
- US rank
- #18031
Category grades
Schools grade is shown separately in the Schools card above.
Census & demographics
- Census place
- Carlyss, LA
- Population (ZIP)
- 12,891
Population outlook (Calcasieu County) Hauer SSP2
- Today (2025)
- 212,179 people
- By 2030
- 218,199 · +2.8%
- By 2040
- 228,486 · +7.7%
- By 2050
- 236,208 · +11.3%
- By 2075
- 251,696 · +18.6%
- By 2100
- 247,848 · +16.8%
Race, ethnicity, and origin ACS 2023
- Neighborhood character
- Predominantly White (87%)
- Race & ethnicity
- White 87% Hispanic / Latino 6% Two or more races 4% Black 3%
- Hispanic origin (detail)
- Mexican 4%
- Common ancestry
- Lithuanian 8% Italian 3% Slovak 2%
- Foreign-born
- 3% · Canada
- Languages at home
- 92% English-only · Spanish 6% French/Haitian/Cajun 1% Other Indo-European 1%
Political lean MEDSL · Calcasieu
- 2024 margin
- Solid R (+39.6) · D 29.5% · R 69.0% · Other 1.5%
- 2008→2024 swing
- -15.0pp toward R · 2008: -24.6pp · 2024: -39.6pp
- All cycles
- 2024: R+39.6 2020: R+35.2 2016: R+33.3 2012: R+28.7 2008: R+24.6
Not yet ingested
- Civics
- —
Market trends
- HPI YoY
- ▼ -91.65%
- Current HPI
- 99.2379
- Rent YoY
- —
- Metro
- —
- State GDP YoY
- ▲ 3.29%
- F500 in state
- 10
Industry mix (Fortune 500 HQ in LA)
| Industry | F500 HQs | Revenue |
|---|---|---|
| Telecommunications | 2 | $23B |
|
||
| Utilities | 1 | $12B |
|
||
| Wholesale / Distribution | 1 | $5B |
|
||
| Advertising | 1 | $2B |
|
||
Cash-flow waterfall
monthlySold comps — $/sqft
last 12 mo · ≤1 miLoading sold comps…