 🏗️ New Construction
Nina 2 Plan · Parker, CO
Flood risk No data
- FEMA flood zone
- —
- Chance of flooding over 30 yrs
- —
- Est. flood insurance / yr
- —
Fire risk No data
- Est. fire insurance / yr
- —
Heat risk No data
- Hot days now (above threshold)
- —
- Hot days in 30 yrs
- —
Wind risk No data
- Chance of severe wind over 30 yrs
- —
Air-quality risk No data
- Unhealthy air days now
- —
- Unhealthy air days in 30 yrs
- —
Risk factors via First Street. Map © Google.
Why this score? — see what drove the C grade
The composite is a weighted blend of 9 inputs, each scored 0–100. Each bar is that input's sub-score; the figure is the points it added to the 100-point composite (weight × sub-score).
- Cash flow +22.4/30.0
- ARV discount +7.5/15.0
- DSCR +7.2/10.0
- 1% rule +5.9/10.0
- Schools +5.1/10.0
- Condition / age +5.0/5.0
- Livability +4.0/5.0
- Rent growth +2.3/5.0
- Appreciation +0.0/10.0
$609,950
🖨 Deal sheet 📄 Offer letter ✓ Due diligence
Listing remarks
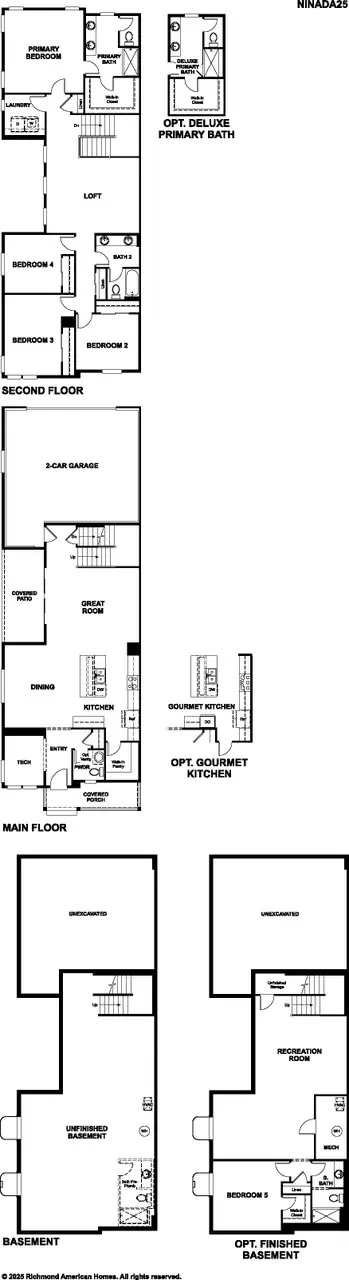
The paired Nina plan opens with a charming covered entry, a convenient powder room, and a pocket office. Further inside, you'll find a dining room, an inviting great room, and a well-appointed kitchen with a large island and walk-in pantry. Upstairs, discover an airy loft and four bedrooms, including a stunning primary suite showcasing a roomy walk-in closet and a private bath with double sinks. A central laundry, a shared bath with double sinks, and a tranquil covered patio complete the home. Some homesites may be built with a gourmet kitchen, a great room fireplace, a deluxe primary bath, and/or a finished basement featuring a rec room, bedroom, and full bath.
Key facts
- Airy loft
- Pocket office
- Walk-in closet
Tags
Property features AI
Finance
- Financial info: List price $609,950
Exterior
- Parking: 2 parking spaces
- Home design: Single-family new construction (Plan: Nina 2); Address: Parker, CO 80134
Interior
- Bedrooms: 4 bedrooms
- Bathrooms: 2 full bathrooms; 1 half bathroom (2.5 total bathrooms)
- Interior features: Open living area (approx. 2403 total living area); New construction plan (Nina 2)
Neighborhood map
What this means for you Summary
Snapshot
- This is a 4-bed/2.5-bath multifamily listed at $610k. Condition is rated excellent.
Deal economics
- At list price, monthly cash flow is $1k ($12k/yr) — positive.
- The deal already cash-flows at list — no discount required.
- Meets the 1% rule at list price ($7k rent vs $610k).
- Recommended offer: $573k (6.0% below list) — sets the bar for market timing.
- Cap rate 8.3% vs local median 3.0% in Parker — top-decile yield for the area; either an underpriced asset or a hidden risk that comps aren't pricing in. Stress-test before assuming the spread holds.
Location & tenants
- Location reads 81/100 on livability (#7 in CO, #1,304 nationally) — a professional / high-income tenant draw. Strengths: amenities A+, commute A+, employment A+; Watch: cost of living F.
- Douglas County School District No. RE-1 (suburban): math 45% / reading 62% proficiency, ranked #7 of 86 in CO (top 8%) — acceptable for families but not a draw, mixed tenant base, ~2y average lease; only 8% free/reduced lunch — higher-income household profile.
- Market conditions: Rents soft (-0.9%/yr); 766 active listings in the ZIP; 2 comparable units currently listed for rent nearby; high-income renter base; 3,131 units permitted in Douglas County in 2024 (950 in 5+ unit buildings).
- At $6,618/mo this rent would consume 54% of the median local household income ($147k/yr) (locally 1267% of renters already pay >50% of income on rent) — very limited rent-growth headroom before tenants either downsize or default.
Forward outlook
- Local home prices are declining (-3.0%/yr); year-one equity from $4k of loan paydown is wiped out by about $18k of value loss. Plan a longer hold.
- Douglas County population projected at +43% by 2050 — long-run rental-demand tailwind backs the buy-and-hold thesis.
Negotiation context
- It's been on market 87 days — a 6% lower offer ($573k) is reasonable based on typical stale-listing flexibility.
Questions for the listing agent
- It's been on market 87 days. Have you received any prior offers? Is the seller open to a 6% concession, seller financing, or rate buy-down credit?
- Why hasn't it sold? Are there any deal-killer items the seller is aware of (foundation, flood, title, zoning, code violations)?
- Is there a deadline driving the sale (1031 exchange, divorce, estate, relocation)? That informs how much negotiation room exists.
- Schools are B-rated — typically a magnet for longer-tenancy family renters. What's the average tenant stay here, and is there a school-zone premium baked into asking?
- What's the average days-on-market for RENTAL listings here right now (not sales)? A rising rental-DOM trend means longer vacancies and softer asking-rent achievability than the comps imply.
- What's the recent tenant-quality profile in this submarket — average credit score on applications, eviction rate, late-payment / NSF rate, and stable-employment percentage? A property-management company in the area should have these aggregated.
- How much new apartment / multifamily construction is in the pipeline within 1–3 miles? Heavy new supply (>2% of stock underway) typically softens rents 12–24 months out; light construction supports rent growth.
Investment metrics
- 1% rule
- 1.09% ✓
- Cap rate
- 8.29%
- Cash-on-cash
- 7.12%
- DSCR
- 1.32
- GRM
- 7.7
CMA / ARV
No comps found within radius.
Projected returns pro-forma
-3.0% appreciation · 0.0% rent growth · sell at horizon
- IRR
- -8.8%
- Equity multiple
- 0.69×
- Total profit
- $-53,615
- Equity at exit
- $90,946
- IRR
- -3.9%
- Equity multiple
- 0.78×
- Total profit
- $-38,157
- Equity at exit
- $52,737
Cash invested: $170,786 (down + closing). Projections, not guarantees.
Landlord ↔ Tenant lean methodology
- Overall (STATE)
- 38 Tenant-Leaning
- State Colorado
- 38 Tenant-Leaning · D+4
- County
- — inherits STATE
- City
- — inherits STATE
ZIP-level market 80134
- Rents YoY
- -0.9%
- Active inventory
- 766
- Price-to-rent
- 23.0×
Monthly cashflow live
- Estimated rent
- $6,618 medium interval (Pro) →
- Mortgage (P&I)
- −$3,199
- Tax est. 1.5%
- −$762 /mo · $9,149/yr
- Insurance
- −$254
- HOA
- −$0
- Vacancy / Maint / Mgmt
- −$1,390
- Net cashflow
- $1,013
Break-even live
3-unit breakdown (identical units grouped — click to expand)
| Units | Beds | Baths | Est. rent |
|---|---|---|---|
| 3× units | 2 | 1.5 | $6,618 |
| #1 | 2 | 1.5 | $2,206 |
| #2 | 2 | 1.5 | $2,206 |
| #3 | 2 | 1.5 | $2,206 |
| Total (3 units) | $6,618 | ||
UW: 25.0% down · 7.5% · 30yr · 1.5% tax · 5.0% vac · 8.0% maint · 8.0% mgmt
Financing live
Cash to close
- Down payment
- $152,488
- Closing costs
- $18,298
- Reserves months
- —
- Total cash needed
- —
Loan-product check · same deal, 3 products live
Conventional
25% down · 7.5% · 30yr
- Down + closing
- —
- Monthly P&I
- —
- Monthly cashflow
- —
- DSCR
- —
- Eligible?
- —
Personal DTI + credit; lowest rate.
DSCR
20% down · 8.5% · 30yr
- Down + closing
- —
- Monthly P&I
- —
- Monthly cashflow
- —
- DSCR
- —
- Eligible?
- —
No personal income docs; deal must DSCR.
Hard money
10% down · 12.0% · 12mo
- Down + closing
- —
- Monthly P&I
- —
- Monthly cashflow
- —
- DSCR
- —
- Eligible?
- —
Short-term bridge; refi at stabilization.
Rent comps 2 comps
| Address | Beds | Baths | Sqft | Rent | $/sqft | DOM | Units | Dist |
|---|---|---|---|---|---|---|---|---|
| 13373 Big Iron Ln Parker, CO | 3.0 | 3.0 | 2563 | $3,999 | $1.56 | 15d | 1 | 0.31mi |
| 16792 E Prairie Wind Ave Parker, CO | 4.0 | 3.0 | 3288 | $3,500 | $1.06 | 15d | 1 | 1.44mi |
Listing history 13 events
-
2026-06-18days on market $609,950 Active 87 DOM
-
2026-06-17days on market $609,950 Active 86 DOM
-
2026-06-16days on market $609,950 Active 85 DOM
-
2026-06-15days on market $609,950 Active 84 DOM
-
2026-06-13days on market $609,950 Active 82 DOM
-
2026-06-10days on market $609,950 Active 78 DOM
-
2026-06-08days on market $609,950 Active 77 DOM
-
2026-06-07days on market $609,950 Active 76 DOM
-
2026-06-04days on market $609,950 Active 73 DOM
-
2026-06-03days on market $609,950 Active 72 DOM
-
2026-06-02days on market $609,950 Active 71 DOM
-
2026-06-01days on market $609,950 Active 70 DOM
-
2026-05-31days on market $609,950 Active 69 DOM
ⓘ Source: listings_history table (triggers on properties + properties_extension) + one-shot
backfill from property_details.listing_events for pre-trigger history.
Nearby sold comps map
Loading sold comps map…
Walkable amenities ~0.75 mi
Loading nearby amenities…
Taxation est. · year 1
- Rental income
- $79,416
- − Mortgage interest
- −$34,167
- − Property taxes
- −$9,149
- − Insurance
- −$3,050
- − Repairs & maintenance
- −$6,353
- − Management
- −$6,353
- − Depreciation
- −$17,744
- Taxable income
- $2,600
- Est. tax owed @ 24.0%
- −$624
- After-tax cash flow
- $11,532/yr
For passive investors: Depreciation is non-cash, so a rental often shows a tax loss while cash-flowing — sheltering income. Rental losses are passive: they offset passive income freely, and up to $25,000/yr can offset ordinary (W-2) income if you actively participate and your MAGI is under $100k (phasing out to $0 by $150k); unused losses carry forward. On sale, claimed depreciation is recaptured at up to 25%, and gains may owe capital-gains tax (a 1031 exchange can defer both). Figures are a year-1 estimate at your 24.0% rate — not tax advice; consult a CPA.
Condition & rehab AI · 6 photos
This multi-family home is in excellent condition with no visible repairs or maintenance needed. It offers a great opportunity for investors looking to maximize its resale or rental value through targeted updates.
Value-add opportunities
- Both Landscaping and curb appeal improvements — Enhances curb appeal and could attract more buyers or renters
- Both Interior updates (paint, minor repairs) — Improves the home's appearance and could increase its value
- Both Kitchen and bathroom updates — Modernizing these spaces can significantly increase the home's value
Renovation cost estimate screening
Value-add ROI direction
- Both Landscaping and curb appeal improvements — Enhances curb appeal and could attract more buyers or renters ↑
- Both Interior updates (paint, minor repairs) — Improves the home's appearance and could increase its value ↑
- Both Kitchen and bathroom updates — Modernizing these spaces can significantly increase the home's value ↑
ⓘ Cost ranges are severity-bucket heuristics (US national rule-of-thumb). Get contractor quotes + a written scope before underwriting a rehab budget.
Schools (NCES district)
- District
- Douglas County School District No. RE-1
- NCES district ID
- 0803450
- Math proficiency
- 45% ▼ -3.00%
- Reading proficiency
- 62% ▲ 3.00%
- Median HH income
- $103,175
- Composite
- 50.71/100
- National rank
- #1818
- State rank
- #7 of 86 in CO
Livability — Parker
- Score
- 81/100
- State rank
- #7
- US rank
- #1304
Category grades
Schools grade is shown separately in the Schools card above.
Census & demographics
- Census place
- Parker, CO
- County
- Douglas County · 358,815 people
- City population
- 117,197
- Metro
- Denver-Aurora-Lakewood, CO
- Population (ZIP)
- 80,302
- Household income
- $146,778
- Rent vs Own
- Severe rent burden
- 1267.0
Population outlook (Douglas County) Hauer SSP2
- Today (2025)
- 400,644 people
- By 2030
- 438,441 · +9.4%
- By 2040
- 509,940 · +27.3%
- By 2050
- 571,695 · +42.7%
- By 2075
- 699,992 · +74.7%
- By 2100
- 751,119 · +87.5%
Race, ethnicity, and origin ACS 2023
- Neighborhood character
- Predominantly White (74%)
- Race & ethnicity
- White 74% Hispanic / Latino 11% Two or more races 9% Asian 8% Black 2%
- Hispanic origin (detail)
- Mexican 7%
- Common ancestry
- Italian 3% Slovak 3% Portuguese 2%
- Foreign-born
- 10% · Canada, South Korea, China
- Languages at home
- 88% English-only · Spanish 4% Other Indo-European 3% Other Asian/Pacific 2%
Political lean MEDSL · Douglas
- 2024 margin
- Lean R (+7.0) · D 45.3% · R 52.3% · Other 2.4%
- 2008→2024 swing
- +10.2pp toward D · 2008: -17.2pp · 2024: -7.0pp
- All cycles
- 2024: R+7.0 2020: R+7.2 2016: R+18.1 2012: R+26.5 2008: R+17.2
Not yet ingested
- Civics
- —
Market trends
- HPI YoY
- ▼ -261.88%
- Current HPI
- 264.7756
- Rent YoY
- ▼ -0.89%
- Metro
- Denver-Aurora-Lakewood, CO
- State GDP YoY
- ▲ 1.95%
- F500 in state
- 14
Industry mix (Fortune 500 HQ in CO)
| Industry | F500 HQs | Revenue |
|---|---|---|
| Technology Distribution | 1 | $31B |
|
||
| Food / Agriculture | 1 | $18B |
|
||
| Packaging | 1 | $14B |
|
||
| Healthcare | 1 | $13B |
|
||
| Energy | 1 | $10B |
|
||
| Technology | 1 | $4B |
|
||
Cash-flow waterfall
monthlySold comps — $/sqft
last 12 mo · ≤1 miLoading sold comps…