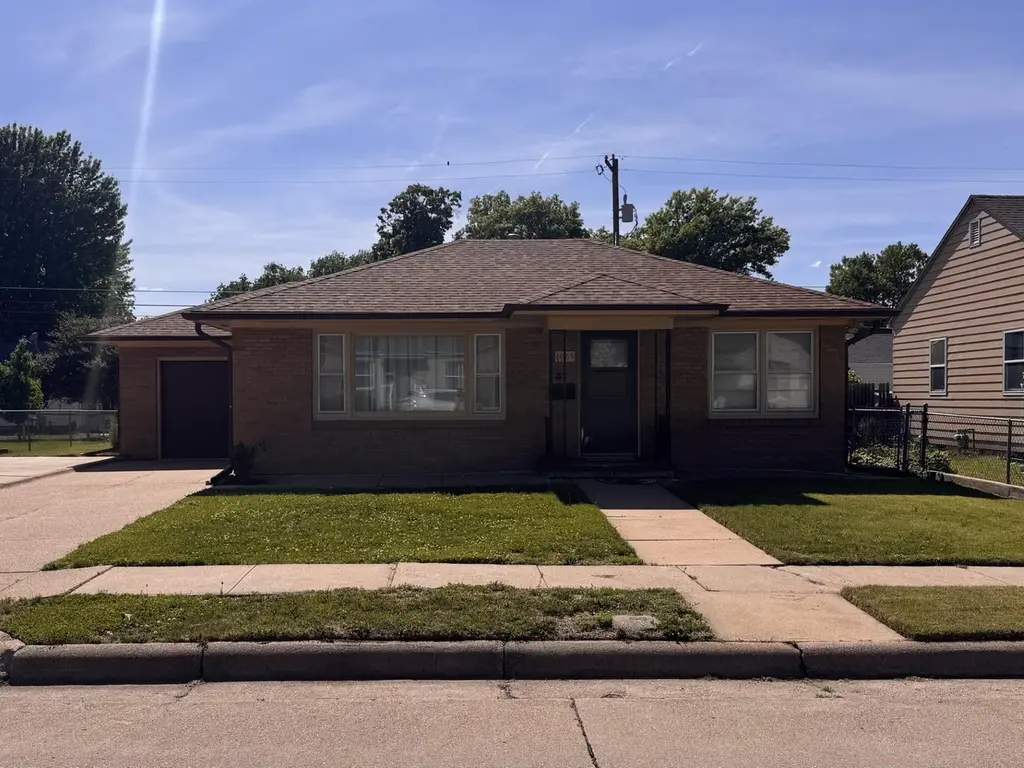
1009 N Williams Ave · Hastings, NE
Flood risk 1/10 · Minimal
- FEMA flood zone
- X (unshaded)
- Chance of flooding over 30 yrs
- 0.0%
- Est. flood insurance / yr
- $473 – $860
Fire risk 1/10 · Minimal
- Est. fire insurance / yr
- $1,161 – $2,155
Heat risk 3/10 · Minor
- Hot days now (above 101°F)
- 7 days/yr
- Hot days in 30 yrs
- 17 days/yr
Wind risk 2/10 · Minimal
- Chance of severe wind over 30 yrs
- —
Air-quality risk 1/10 · Minimal
- Unhealthy air days now
- 0 days/yr
- Unhealthy air days in 30 yrs
- 0 days/yr
Risk factors via First Street. Map © Google.
Why this score? — see what drove the F grade
The composite is a weighted blend of 9 inputs, each scored 0–100. Each bar is that input's sub-score; the figure is the points it added to the 100-point composite (weight × sub-score).
- Cash flow +11.7/30.0
- Livability +4.0/5.0
- DSCR +3.4/10.0
- Schools +3.4/10.0
- 1% rule +3.2/10.0
- Rent growth +2.5/5.0
- Condition / age +2.5/5.0
- ARV discount +1.5/15.0
- Appreciation +0.0/10.0
$157,500
🖨 Deal sheet (PDF) 📄 Offer letter ✓ Due diligence
Listing remarks
Enjoy easy living in this brick home in a pleasant neighborhood, ideal for first-time buyers or those looking to downsize. It features 2 bedrooms, 1 bathroom, and an attached garage. The patio is perfect for relaxing in the evening or grilling, and the basement offers a spacious family room plus additional storage.
Key facts
- Attached garage
- Brick home
- Patio
Tags
Property features AI
Exterior
- Parking: Attached garage (1 car)
- Utilities: Public water; Public sewer; Natural gas available
- Home design: Single-family residence; Residential property; Zoned R2
- Construction: Brick construction
- Exterior features: Patio; Yard shed(s)
Interior
- Kitchen: Gas range
- Bathrooms: One main level bathroom
- Heating & cooling: Forced air heating; Central air conditioning
- Interior features: Gas water heater; Gas range
- Laundry & utility: Laundry in basement; Full basement
Neighborhood map
What this means for you Summary
Snapshot
- This is a 2-bed/1.0-bath single-family listed at $158k.
Deal economics
- At list price, monthly cash flow is $-46 ($-554/yr) — negative.
- To cash-flow at today's rent, offer at most $149k (5.2% below list).
- To meet the 1% rule (rent ≥ 1% of price), the offer needs to be $129k (18.0% below list).
- Recommended offer: $129k (18.0% below list) — sets the bar for 1% rule.
- Cap rate 5.9% vs local median 4.3% in Hastings — top-decile yield for the area; either an underpriced asset or a hidden risk that comps aren't pricing in. Stress-test before assuming the spread holds.
Location & tenants
- Location reads 79/100 on livability (#41 in NE, #2,188 nationally) — a middle-class / working-renter tenant base. Strengths: cost of living A+, housing A+, health & safety A+; Watch: crime C-, amenities D-, commute F.
- Hastings Public Schools (town): math 38% / reading 42% proficiency, ranked #96 of 111 in NE (top 86%) — families likely to look elsewhere, expect single-tenant / working-renter base with shorter leases.
- Zoned schools: Hastings Middle School (math 39% / reading 42%, grade F, #82 of 128 statewide, top 65%, 780 students, 52% FRL); Hastings Senior High School (math 36% / reading 45%, grade F, #181 of 261 statewide, top 69%, 1,067 students, 52% FRL) — zoned schools at 52% FRL track the district average.
- Market conditions: 194 active listings in the ZIP; 217 units permitted in Adams County in 2024 (132 in 5+ unit buildings).
Forward outlook
- Local home prices are declining (-3.0%/yr); year-one equity from $1k of loan paydown is wiped out by about $5k of value loss. Plan a longer hold.
Negotiation context
- It's been on market 15 days — a 2% lower offer ($155k) is reasonable based on typical stale-listing flexibility.
- Current owner paid $96k; list at $158k implies a 64% gain — meaningful room to come down on a strong offer.
Risks & watch-outs
- Watch-outs: built in 1952 — expect roof / HVAC / electrical / plumbing capex.
Questions for the listing agent
- What do current leases actually rent for vs. the listed asking? Can we see a recent rent roll and the last 12 months of T-12 income?
- Built in 1952 — when were the roof, HVAC, electrical panel, plumbing, and water heater last replaced?
- Is there a deadline driving the sale (1031 exchange, divorce, estate, relocation)? That informs how much negotiation room exists.
- The area grade is low — what's the realistic commute time and amenity access for the typical tenant pool here? Any planned neighborhood developments (good or bad) we should know about?
- What's the average days-on-market for RENTAL listings here right now (not sales)? A rising rental-DOM trend means longer vacancies and softer asking-rent achievability than the comps imply.
- What's the recent tenant-quality profile in this submarket — average credit score on applications, eviction rate, late-payment / NSF rate, and stable-employment percentage? A property-management company in the area should have these aggregated.
- How much new for-sale + rental construction is in the pipeline within 1–3 miles? Heavy new supply typically softens prices + rents 12–24 months out; constrained supply supports both.
Investment metrics
- 1% rule
- 0.82% ✗
- Cap rate
- 5.94%
- Cash-on-cash
- -1.26%
- DSCR
- 0.94
- GRM
- 10.2
CMA / ARV
- ARV (on-the-fly)
- $139,072
- Comps found
- 5
Show comp detail 5 sales within ~0.75 mi
| Address | Dist | Beds/Ba | Sqft | Sold | Price | $/sf | Match |
|---|---|---|---|---|---|---|---|
| 811 N Briggs Ave | 0.23mi | 2/1.0 | 790 (-7%) | 2mo | $152,000 | $192 | 77 |
| 912 Williams Ave | 0.06mi | 2/2.0 | 832 (-2%) | 23mo | $194,500 | $234 | 71 |
| 738 N Bellevue Ave | 0.27mi | 2/1.0 | 900 (+6%) | 13mo | $90,000 | $100 | 66 |
| 1237 N Colorado Ave | 0.65mi | 2/1.0 | 820 (-3%) | 3mo | $134,500 | $164 | 62 |
| 1619 Boyce St | 0.46mi | 3/1.0 (+1) | 936 (+10%) | 8mo | $150,000 | $160 | 49 |
Match score weights: distance 35% · size 25% · config 20% · recency 20%. Top-matched comps best support the ARV.
Projected returns pro-forma
-3.0% appreciation · 3.0% rent growth · sell at horizon
- IRR
- -18.4%
- Equity multiple
- 0.35×
- Total profit
- $-28,456
- Equity at exit
- $23,484
- IRR
- -10.7%
- Equity multiple
- 0.35×
- Total profit
- $-28,541
- Equity at exit
- $13,618
Cash invested: $44,100 (down + closing). Projections, not guarantees.
Landlord ↔ Tenant lean methodology
- Overall (STATE)
- 83 Strongly Landlord-Friendly
- State Nebraska
- 83 Strongly Landlord-Friendly · R+13
- County
- — inherits STATE
- City
- — inherits STATE
ZIP-level market 68901
- Active inventory
- 194
- Price-to-rent
- 10.2×
Monthly cashflow live
- Estimated rent
- $1,292 medium interval (Pro) →
- Mortgage (P&I)
- −$826
- Tax from tax record
- −$175 /mo · $2,100/yr
- Insurance
- −$66
- HOA
- −$0
- Vacancy / Maint / Mgmt
- −$271
- Net cashflow
- $-46
Break-even live
Sensitivity live
| Price | -10% $43 | -5% $-2 | +0% $-46 | +5% $-91 | +10% $-135 |
|---|---|---|---|---|---|
| Rent | -10% $-148 | -5% $-97 | +0% $-46 | +5% $5 | +10% $56 |
| Rate | -1.0pp $33 | -0.5pp $-6 | base $-46 | +0.5pp $-87 | +1.0pp $-129 |
UW: 25.0% down · 7.5% · 30yr · 1.5% tax · 5.0% vac · 8.0% maint · 8.0% mgmt
Financing live
Cash to close
- Down payment
- $39,375
- Closing costs
- $4,725
- Reserves months
- —
- Total cash needed
- —
Loan-product check · same deal, 3 products live
Conventional
25% down · 7.5% · 30yr
- Down + closing
- —
- Monthly P&I
- —
- Monthly cashflow
- —
- DSCR
- —
- Eligible?
- —
Personal DTI + credit; lowest rate.
DSCR
20% down · 8.5% · 30yr
- Down + closing
- —
- Monthly P&I
- —
- Monthly cashflow
- —
- DSCR
- —
- Eligible?
- —
No personal income docs; deal must DSCR.
Hard money
10% down · 12.0% · 12mo
- Down + closing
- —
- Monthly P&I
- —
- Monthly cashflow
- —
- DSCR
- —
- Eligible?
- —
Short-term bridge; refi at stabilization.
Listing history 11 events
-
2026-06-12statusdays on market $157,500 Pending 15 DOM
-
2026-06-09days on market $157,500 Active 12 DOM
-
2026-06-08days on market $157,500 Active 11 DOM
-
2026-06-07days on market $157,500 Active 10 DOM
-
2026-06-07days on market $157,500 Active 9 DOM
-
2026-06-04days on market $157,500 Active 6 DOM
-
2026-06-02days on market $157,500 Active 5 DOM
-
2026-06-01days on market $157,500 Active 4 DOM
-
2026-05-31days on market $157,500 Active 3 DOM
-
2026-05-29$157,500 Active
-
2017-11-13soldstatus $96,000
ⓘ Source: listings_history table (triggers on properties + properties_extension) + one-shot
backfill from property_details.listing_events for pre-trigger history.
Tax reassessment forecast NE · Resets to sale price
- Current annual tax
- $2,100 · $175/mo
- Projected year-2 tax
- $2,725 · $227/mo
- Expected delta
- +$625/yr (+$52/mo · 29.8%)
ⓘ Screening estimate from a state-policy table — verify with the county assessor before closing.
Climate risk First Street
- Flood 1/10 Low FEMA zone X (unshaded) · 0% chance over 30 yrs
- Wildfire 1/10 Low
- Heat 3/10 Moderate 7 d/yr ≥101°F today · 17 d/yr by 30 yrs out
- Wind 2/10 Low
- Air quality 1/10 Low 0 unhealthy d/yr today · 0 by 30 yrs out
Nearby sold comps map
Loading sold comps map…
Walkable amenities ~0.75 mi
Loading nearby amenities…
Taxation est. · year 1
- Rental income
- $15,500
- − Mortgage interest
- −$8,822
- − Property taxes
- −$2,100
- − Insurance
- −$788
- − Repairs & maintenance
- −$1,240
- − Management
- −$1,240
- − Depreciation
- −$4,582
- Taxable loss
- −$3,272
- Est. tax savings @ 24.0%
- +$785
- After-tax cash flow
- $231/yr
For passive investors: Depreciation is non-cash, so a rental often shows a tax loss while cash-flowing — sheltering income. Rental losses are passive: they offset passive income freely, and up to $25,000/yr can offset ordinary (W-2) income if you actively participate and your MAGI is under $100k (phasing out to $0 by $150k); unused losses carry forward. On sale, claimed depreciation is recaptured at up to 25%, and gains may owe capital-gains tax (a 1031 exchange can defer both). Figures are a year-1 estimate at your 24.0% rate — not tax advice; consult a CPA.
Schools (NCES district)
- District
- Hastings Public Schools
- NCES district ID
- 3171580
- Math proficiency
- 38% ▼ -8.00%
- Reading proficiency
- 42% ▼ -4.00%
- Median HH income
- $42,942
- Composite
- 33.81/100
- National rank
- #5363
- State rank
- #96 of 111 in NE
Livability — Hastings
- Score
- 79/100
- State rank
- #41
- US rank
- #2188
Category grades
Schools grade is shown separately in the Schools card above.
Census & demographics
- Census place
- Hastings, NE
- City population
- 26,208
- Population (ZIP)
- 26,208
Population outlook (Adams County) Hauer SSP2
- Today (2025)
- 31,965 people
- By 2030
- 32,079 · +0.4%
- By 2040
- 31,999 · +0.1%
- By 2050
- 31,586 · -1.2%
- By 2075
- 30,856 · -3.5%
- By 2100
- 29,948 · -6.3%
Race, ethnicity, and origin ACS 2023
- Neighborhood character
- Predominantly White (81%)
- Race & ethnicity
- White 81% Hispanic / Latino 14% Two or more races 8% Black 1% Asian 1%
- Hispanic origin (detail)
- Mexican 9% Cuban 1%
- Common ancestry
- Lithuanian 2% Romanian 2% Italian 2%
- Foreign-born
- 7% · Canada, Vietnam
- Languages at home
- 89% English-only · Spanish 9% Vietnamese 1%
Political lean MEDSL · Adams
- 2024 margin
- Solid R (+41.6) · D 28.5% · R 70.2% · Other 1.3%
- 2008→2024 swing
- -14.6pp toward R · 2008: -27.0pp · 2024: -41.6pp
- All cycles
- 2024: R+41.6 2020: R+40.1 2016: R+45.0 2012: R+34.1 2008: R+27.0
Not yet ingested
- Civics
- —
Market trends
- HPI YoY
- ▼ -255.77%
- Current HPI
- 232.0444
- Rent YoY
- —
- Metro
- —
- State GDP YoY
- ▲ 0.68%
- F500 in state
- 2
Industry mix (Fortune 500 HQ in NE)
| Industry | F500 HQs | Revenue |
|---|---|---|
| Conglomerate | 1 | $371B |
|
||
Price history
+64.1% since first listed2 events — show timeline
- 2026-05-29 Listed $157,500 GMNMLS
- 2017-11-13 Sold (Public Records) $96,000 Public Records
Property tax history
+2.3%/yrLatest (2025): $2,100 · +4.5% YoY. Source: county tax records.
Cash-flow waterfall
monthlySold comps — $/sqft
last 12 mo · ≤1 miLoading sold comps…