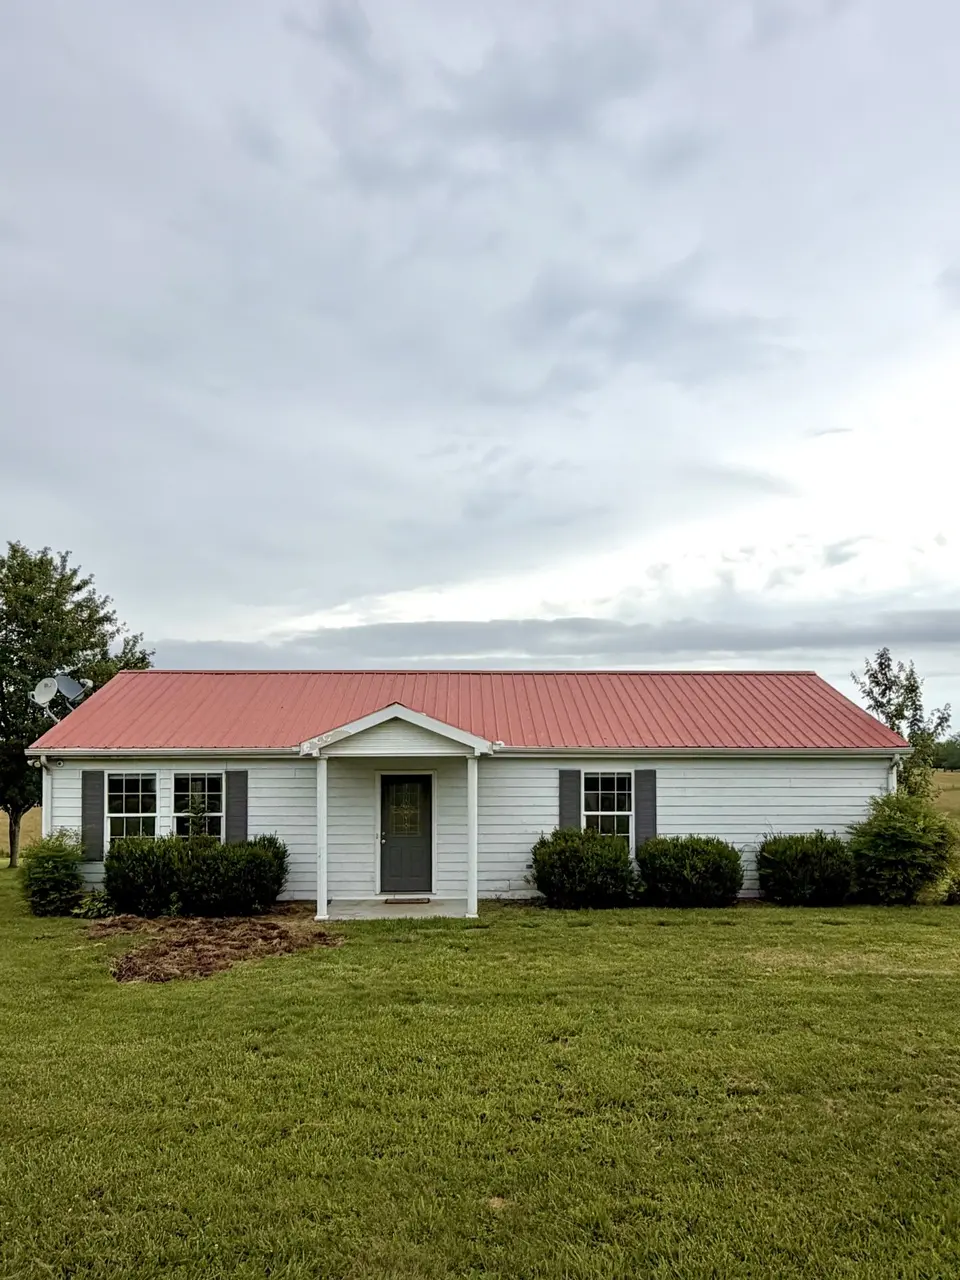
120 Driver Rd · Lafayette, TN
Flood risk No data
- FEMA flood zone
- —
- Chance of flooding over 30 yrs
- —
- Est. flood insurance / yr
- —
Fire risk No data
- Est. fire insurance / yr
- —
Heat risk No data
- Hot days now (above threshold)
- —
- Hot days in 30 yrs
- —
Wind risk No data
- Chance of severe wind over 30 yrs
- —
Air-quality risk No data
- Unhealthy air days now
- —
- Unhealthy air days in 30 yrs
- —
Risk factors via First Street. Map © Google.
Why this score? — see what drove the D grade
The composite is a weighted blend of 9 inputs, each scored 0–100. Each bar is that input's sub-score; the figure is the points it added to the 100-point composite (weight × sub-score).
- Cash flow +10.0/30.0
- Appreciation +10.0/10.0
- ARV discount +7.5/15.0
- Livability +3.4/5.0
- DSCR +2.8/10.0
- Schools +2.6/10.0
- Rent growth +2.5/5.0
- Condition / age +2.5/5.0
- 1% rule +1.7/10.0
$245,000
🖨 Deal sheet (PDF) 📄 Offer letter ✓ Due diligence
Listing remarks MLS
Beautifully remodeled ranch style home on 1.17 acres is available now. New paint, floors, cabinets, counter tops, appliances and more. Nice open floor plan with oversized living room makes the perfect space for entertaining. Fully remodeled kitchen has plenty of cabinet and counter top space for all your cooking needs. Large laundry room with washer and dryer and new water heater. Primary bedroom closet is the size of a small bedroom and could be used as an office and a closet... seriously.. It's HUGE. Nice back deck overlooking your expansive backyard with no back yard neighbors. Seller open to paying closing costs and discount points with good offer.
Key facts
- 1.17 acre lot
- Built 2004
- Listed 8 days
Property features AI
Finance
- Other: Approximately 1.17-acre lot; About 1,200 square feet of living area (assessor)
Exterior
- Parking: Driveway
- Security: Smoke detector(s)
- Utilities: Public water available; Septic tank; Electricity available
- Home design: Single-family residence; One story; Residential property with a view
- Construction: Vinyl siding; Metal roof; Existing construction
- Exterior features: Deck; Storage structure; Rolling slope with views
Interior
- Kitchen: Electric oven and electric range; Dishwasher; Microwave; Refrigerator
- Bedrooms: 2 bedrooms on the main level; Primary bedroom with walk-in closet, approx. 14 x 13; Second bedroom approx. 12 x 11
- Flooring: Laminate; Tile
- Bathrooms: 1 full bathroom; 1 half bathroom
- Heating & cooling: Central heating (electric); Central air conditioning (electric)
- Interior features: Ceiling fans; Open floor plan; Walk-in closets; Smoke detector(s)
- Laundry & utility: Washer hookup; Electric dryer hookup; Washer and dryer included
Neighborhood map
What this means for you Summary
Snapshot
- This is a 2-bed/2.0-bath manufactured listed at $245k.
Deal economics
- At list price, monthly cash flow is $-149 ($-2k/yr) — negative.
- To cash-flow at today's rent, offer at most $219k (10.7% below list).
- To meet the 1% rule (rent ≥ 1% of price), the offer needs to be $164k (32.9% below list).
- Recommended offer: $164k (32.9% below list) — sets the bar for 1% rule.
Location & tenants
- Location reads 68/100 on livability (#80 in TN) — a middle-class / working-renter tenant base. Strengths: cost of living A+, health & safety A+, crime A-; Watch: amenities F, commute F, employment F.
- Macon County (rural): math 34% / reading 29% proficiency, ranked #53 of 139 in TN (top 38%) — families likely to look elsewhere, expect single-tenant / working-renter base with shorter leases.
- Zoned schools: Lafayette Elementary School (math 44% / reading 31%, grade F, #269 of 952 statewide, top 28%, 422 students, 0% FRL); Macon County Junior High School (math 37% / reading 26%, grade F, #89 of 333 statewide, top 28%, 771 students, 0% FRL); Macon County High School (math 21% / reading 32%, grade F, #112 of 332 statewide, top 35%, 967 students, 0% FRL) — zoned schools average 0% FRL vs 53% district-wide (53 pts lower); this property's tenant base skews higher-income than the district average.
- Market conditions: 179 active listings in the ZIP; 181 units permitted in Macon County in 2024 (10 in 5+ unit buildings).
Forward outlook
- In year one you build about $26k of equity ($2k loan paydown + $24k appreciation (10.0% local appreciation)).
- Macon County population projected at +13% by 2050 — modest demand growth; plan on rents tracking national, not racing it.
- By year 2, paydown + projected appreciation supports a ~$42k cash-out refi (75% LTV) — recoverable capital for the next deal without selling this one.
Negotiation context
- Only 8 days on market — expect competitive offers; lowballing is unlikely to land.
- 5 sale attempts since 15y ago; this cycle's ask is 7% above the opening price — seller raised mid-cycle; expect resistance to lowballs.
Questions for the listing agent
- What do current leases actually rent for vs. the listed asking? Can we see a recent rent roll and the last 12 months of T-12 income?
- Is there a deadline driving the sale (1031 exchange, divorce, estate, relocation)? That informs how much negotiation room exists.
- Schools are F-rated, which usually means shorter tenancies and higher turnover. Who's the typical renter profile here, and what's been the actual vacancy rate?
- The area grade is low — what's the realistic commute time and amenity access for the typical tenant pool here? Any planned neighborhood developments (good or bad) we should know about?
- What's the average days-on-market for RENTAL listings here right now (not sales)? A rising rental-DOM trend means longer vacancies and softer asking-rent achievability than the comps imply.
- What's the recent tenant-quality profile in this submarket — average credit score on applications, eviction rate, late-payment / NSF rate, and stable-employment percentage? A property-management company in the area should have these aggregated.
- How much new for-sale + rental construction is in the pipeline within 1–3 miles? Heavy new supply typically softens prices + rents 12–24 months out; constrained supply supports both.
Investment metrics
- 1% rule
- 0.67% ✗
- Cap rate
- 5.57%
- Cash-on-cash
- -2.60%
- DSCR
- 0.88
- GRM
- 12.4
CMA / ARV
No comps found within radius.
Projected returns pro-forma
10.0% appreciation · 3.0% rent growth · sell at horizon
- IRR
- 22.4%
- Equity multiple
- 2.81×
- Total profit
- $123,843
- Equity at exit
- $220,715
- IRR
- 20.1%
- Equity multiple
- 6.42×
- Total profit
- $371,887
- Equity at exit
- $475,981
Cash invested: $68,600 (down + closing). Projections, not guarantees.
Landlord ↔ Tenant lean methodology
- Overall (STATE)
- 87 Strongly Landlord-Friendly
- State Tennessee
- 87 Strongly Landlord-Friendly · R+13
- County
- — inherits STATE
- City
- — inherits STATE
ZIP-level market 37083
- Home prices YoY
- 8.8%
- Active inventory
- 179
- Price-to-rent
- 12.4×
Monthly cashflow live
- Estimated rent
- $1,643 medium interval (Pro) →
- Mortgage (P&I)
- −$1,285
- Tax from tax record
- −$60 /mo · $718/yr
- Insurance
- −$102
- HOA
- −$0
- Vacancy / Maint / Mgmt
- −$345
- Net cashflow
- $-149
Break-even live
Sensitivity live
| Price | -10% $-10 | -5% $-79 | +0% $-149 | +5% $-218 | +10% $-287 |
|---|---|---|---|---|---|
| Rent | -10% $-278 | -5% $-214 | +0% $-149 | +5% $-84 | +10% $-19 |
| Rate | -1.0pp $-25 | -0.5pp $-86 | base $-149 | +0.5pp $-212 | +1.0pp $-277 |
UW: 25.0% down · 7.5% · 30yr · 1.5% tax · 5.0% vac · 8.0% maint · 8.0% mgmt
Financing live
Cash to close
- Down payment
- $61,250
- Closing costs
- $7,350
- Reserves months
- —
- Total cash needed
- —
Loan-product check · same deal, 3 products live
Conventional
25% down · 7.5% · 30yr
- Down + closing
- —
- Monthly P&I
- —
- Monthly cashflow
- —
- DSCR
- —
- Eligible?
- —
Personal DTI + credit; lowest rate.
DSCR
20% down · 8.5% · 30yr
- Down + closing
- —
- Monthly P&I
- —
- Monthly cashflow
- —
- DSCR
- —
- Eligible?
- —
No personal income docs; deal must DSCR.
Hard money
10% down · 12.0% · 12mo
- Down + closing
- —
- Monthly P&I
- —
- Monthly cashflow
- —
- DSCR
- —
- Eligible?
- —
Short-term bridge; refi at stabilization.
Listing history 8 events
-
2026-06-21days on market $245,000 Coming Soon 8 DOM
-
2026-06-21days on market $245,000 Coming Soon 7 DOM
-
2026-06-18days on market $245,000 Coming Soon 5 DOM
-
2026-06-17days on market $245,000 Coming Soon 4 DOM
-
2026-06-16days on market $245,000 Coming Soon 3 DOM
-
2026-06-15days on market $245,000 Coming Soon 2 DOM
-
2026-06-13remarks 326-char remark
-
2026-06-13$245,000 Coming Soon 1 DOM
ⓘ Source: listings_history table (triggers on properties + properties_extension) + one-shot
backfill from property_details.listing_events for pre-trigger history.
Tax reassessment forecast TN · Resets to sale price
- Current annual tax
- $718 · $60/mo
- Projected year-2 tax
- $1,740 · $145/mo
- Expected delta
- +$1,022/yr (+$85/mo · 142.3%)
ⓘ Screening estimate from a state-policy table — verify with the county assessor before closing.
Nearby sold comps map
Loading sold comps map…
Walkable amenities ~0.75 mi
Loading nearby amenities…
Taxation est. · year 1
- Rental income
- $19,718
- − Mortgage interest
- −$13,724
- − Property taxes
- −$718
- − Insurance
- −$1,225
- − Repairs & maintenance
- −$1,577
- − Management
- −$1,577
- − Depreciation
- −$7,127
- Taxable loss
- −$6,231
- Est. tax savings @ 24.0%
- +$1,495
- After-tax cash flow
- $-288/yr
For passive investors: Depreciation is non-cash, so a rental often shows a tax loss while cash-flowing — sheltering income. Rental losses are passive: they offset passive income freely, and up to $25,000/yr can offset ordinary (W-2) income if you actively participate and your MAGI is under $100k (phasing out to $0 by $150k); unused losses carry forward. On sale, claimed depreciation is recaptured at up to 25%, and gains may owe capital-gains tax (a 1031 exchange can defer both). Figures are a year-1 estimate at your 24.0% rate — not tax advice; consult a CPA.
Schools (NCES district)
- District
- Macon County
- NCES district ID
- 4702550
- Math proficiency
- 34% ▼ -4.00%
- Reading proficiency
- 29% ▼ -3.00%
- Median HH income
- $34,280
- Composite
- 25.97/100
- National rank
- #7329
- State rank
- #53 of 139 in TN
Livability — Lafayette
- Score
- 68/100
- State rank
- #80
- US rank
- #9247
Category grades
Schools grade is shown separately in the Schools card above.
Census & demographics
- Population (ZIP)
- 16,887
Population outlook (Macon County) Hauer SSP2
- Today (2025)
- 24,618 people
- By 2030
- 25,337 · +2.9%
- By 2040
- 26,739 · +8.6%
- By 2050
- 27,822 · +13.0%
- By 2075
- 30,614 · +24.4%
- By 2100
- 31,851 · +29.4%
Race, ethnicity, and origin ACS 2023
- Neighborhood character
- Predominantly White (88%)
- Race & ethnicity
- White 88% Hispanic / Latino 9% Two or more races 7%
- Hispanic origin (detail)
- Mexican 7%
- Common ancestry
- Italian 1% Slovak 1% Serbian 1%
- Foreign-born
- 3% · Canada
- Languages at home
- 95% English-only · Spanish 5%
Political lean MEDSL · Macon
- 2024 margin
- Solid R (+74.3) · D 12.4% · R 86.7%
- 2008→2024 swing
- -54.8pp toward R · 2008: -19.6pp · 2024: -74.3pp
- All cycles
- 2024: R+74.3 2020: R+71.6 2016: R+69.3 2012: R+53.7 2008: R+19.6
Not yet ingested
- Civics
- —
Market trends
- HPI YoY
- ▲ 31.33%
- Current HPI
- 388.8726
- Rent YoY
- —
- Metro
- —
- State GDP YoY
- ▲ 2.78%
- F500 in state
- 22
Industry mix (Fortune 500 HQ in TN)
| Industry | F500 HQs | Revenue |
|---|---|---|
| Healthcare | 3 | $91B |
|
||
| Retail | 3 | $72B |
|
||
| Transportation / Logistics | 1 | $88B |
|
||
| Paper / Packaging | 1 | $19B |
|
||
| Insurance | 1 | $13B |
|
||
| Energy | 1 | $12B |
|
||
Price history
+1366.3% since first listed24 events — show timeline
- 2026-06-13 Coming Soon $245,000 REALTRACS as Distributed by MLS Grid
- 2024-03-18 Sold (Public Records) $215,000 Public Records
- 2024-03-14 Sold (MLS) $215,000 REALTRACS as Distributed by MLS Grid
- 2024-01-29 Contingent — REALTRACS as Distributed by MLS Grid
- 2024-01-25 Price Changed $215,000 REALTRACS as Distributed by MLS Grid
- 2024-01-10 Price Changed $224,900 REALTRACS as Distributed by MLS Grid
- 2023-12-20 Listed $229,900 REALTRACS as Distributed by MLS Grid
- 2023-11-22 Sold (Public Records) $60,000 Public Records
- 2023-10-13 Sold (Public Records) $140,000 Public Records
- 2018-04-17 Sold (Public Records) $117,000 Public Records
- 2018-04-13 Sold (MLS) $117,000 REALTRACS as Distributed by MLS Grid
- 2018-02-12 Contingent — REALTRACS as Distributed by MLS Grid
- 2018-02-05 Price Changed $137,000 REALTRACS as Distributed by MLS Grid
- 2018-01-02 Listing Removed — REALTRACS as Distributed by MLS Grid
- 2018-01-02 Relisted — REALTRACS as Distributed by MLS Grid
- 2018-01-01 Listed $140,000 REALTRACS as Distributed by MLS Grid
- 2016-04-29 Sold (Public Records) $89,000 Public Records
- 2016-04-27 Sold (MLS) $89,000 REALTRACS as Distributed by MLS Grid
- 2016-04-22 Pending — REALTRACS as Distributed by MLS Grid
- 2016-03-11 Contingent — REALTRACS as Distributed by MLS Grid
- 2016-01-21 Listed $89,500 REALTRACS as Distributed by MLS Grid
- 2012-01-21 Listing Removed — REALTRACS as Distributed by MLS Grid
- 2011-09-29 Listed $94,500 REALTRACS as Distributed by MLS Grid
- 2002-11-15 Sold (Public Records) $16,709 Public Records
Property tax history
+4.4%/yrLatest (2025): $718 · +71.4% YoY. Source: county tax records.
Cash-flow waterfall
monthlySold comps — $/sqft
last 12 mo · ≤1 miLoading sold comps…