 Multi-family
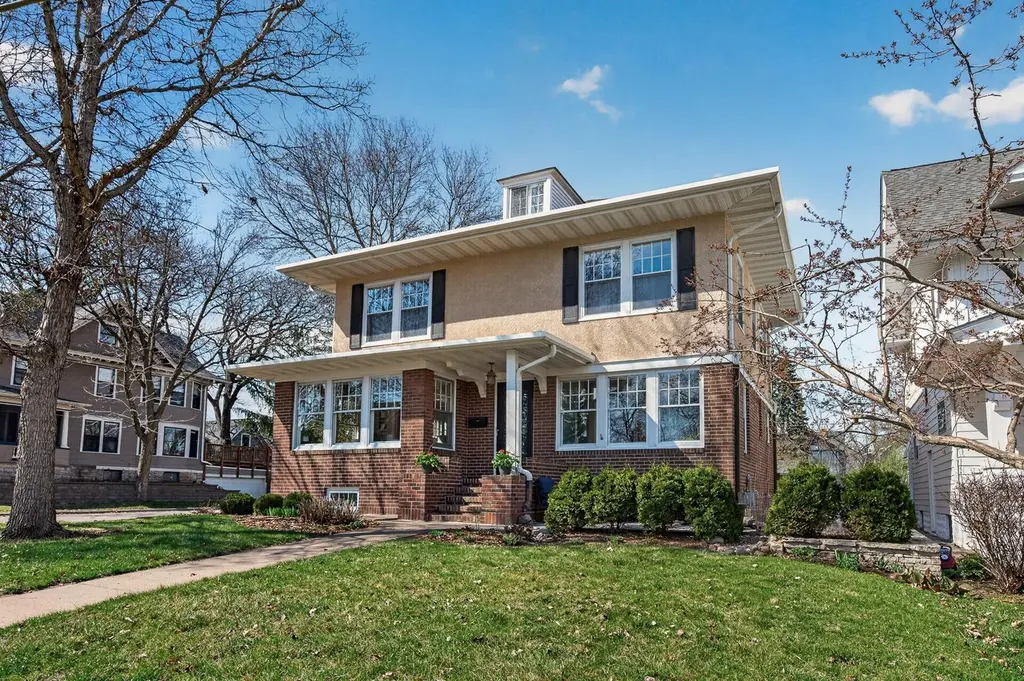
1397 Lincoln Ave · St. Paul, MN
Flood risk 1/10 · Minimal
- FEMA flood zone
- X (unshaded)
- Chance of flooding over 30 yrs
- 0.0%
- Est. flood insurance / yr
- $473 – $860
Fire risk 1/10 · Minimal
- Est. fire insurance / yr
- $888 – $1,650
Heat risk 2/10 · Minimal
- Hot days now (above 99°F)
- 7 days/yr
- Hot days in 30 yrs
- 13 days/yr
Wind risk 2/10 · Minimal
- Chance of severe wind over 30 yrs
- —
Air-quality risk 2/10 · Minimal
- Unhealthy air days now
- 1 days/yr
- Unhealthy air days in 30 yrs
- 2 days/yr
Risk factors via First Street. Map © Google.
Why this score? — see what drove the D grade
The composite is a weighted blend of 9 inputs, each scored 0–100. Each bar is that input's sub-score; the figure is the points it added to the 100-point composite (weight × sub-score).
- Cash flow +14.8/30.0
- ARV discount +7.5/15.0
- 1% rule +4.5/10.0
- DSCR +4.5/10.0
- Rent growth +3.3/5.0
- Livability +2.5/5.0
- Condition / age +2.5/5.0
- Schools +2.4/10.0
- Appreciation +0.0/10.0
$650,000
🖨 Deal sheet (PDF) 📄 Offer letter ✓ Due diligence
Multi-family units
County records classify this as Multi-Family (2-4 Unit). Listing-text estimate: 1 unit. estimate disagrees with records
Listing remarks MLS
Great layout for owner occupied plus
Key facts
- 7,187 sq ft lot
- 2 garage spots
- Built 1921
Property features AI
Finance
- Financial info: Two total units; Gross income reported at $20,106; Owner pays gas, trash collection, and water; Tenants pay cable TV and electricity
Exterior
- Parking: Detached 2-car garage (approximately 19 x 18.5)
- Utilities: City water (in street); City sewer (in street); Natural gas
- Home design: Residential income duplex (side-by-side); Two levels; Owner occupied
- Construction: Foundation area approximately 1,552 (foundation included); Roof replaced or updated within the last 8 years; Partial concrete basement
- Exterior features: Stone and stucco exterior; Lot approximately 0.165 acres (48 x 150)
Interior
- Kitchen: Dishwasher; Range; Refrigerator; Microwave (Unit 2); Stainless steel appliances (Unit 1)
- Bedrooms: Seven bedrooms total (one unit with five bedrooms; one unit with two bedrooms)
- Flooring: Hardwood floors
- Bathrooms: Total of five bathrooms across both units (Unit 1: 3 bathrooms — 1 full, 1 three-quarter, 1 half; Unit 2: 2 bathrooms — 1 full, 1 one-quarter)
- Heating & cooling: Hot water heating; Window cooling units
- Interior features: Hardwood floors; Natural woodwork; Sun room; Kitchen window; One wood-burning fireplace
- Laundry & utility: Washer and dryer in both units
Neighborhood map
What this means for you Summary
Snapshot
- This is a 6-bed/4.0-bath multifamily listed at $650k.
Deal economics
- At list price, monthly cash flow is $184 ($2k/yr) — positive.
- The deal already cash-flows at list — no discount required.
- To meet the 1% rule (rent ≥ 1% of price), the offer needs to be $617k (5.1% below list).
- Recommended offer: $617k (5.1% below list) — sets the bar for 1% rule.
Location & tenants
- Location reads: area grade D — affects rentability + tenant quality, not the cash-flow math above.
- St. Paul Public School District (urban): math 21% / reading 33% proficiency, ranked #270 of 301 in MN (top 90%) — low school quality limits family demand, transient renter base, plan for 1-2y turnover; 64% free/reduced lunch — lower-income household profile, screen leases tightly.
- Market conditions: Rents rising (+3.1%/yr); 124 active listings in the ZIP; solid renter incomes; 1,202 units permitted in Ramsey County in 2024 (880 in 5+ unit buildings).
- At $6,168/mo this rent would consume 69% of the median local household income ($107k/yr) (locally 909% of renters already pay >50% of income on rent) — very limited rent-growth headroom before tenants either downsize or default.
Forward outlook
- Local home prices are declining (-3.0%/yr); year-one equity from $4k of loan paydown is wiped out by about $20k of value loss. Plan a longer hold.
- Ramsey County population projected at +27% by 2050 — long-run rental-demand tailwind backs the buy-and-hold thesis.
Negotiation context
- Only 11 days on market — expect competitive offers; lowballing is unlikely to land.
- 4 sale attempts since 28y ago with the ask held roughly flat each time — persistent listings suggest the price (not the market) is what's stuck; bring a comps-based counter.
- Current owner paid $380k; list at $650k implies a 71% gain — meaningful room to come down on a strong offer.
Risks & watch-outs
- Watch-outs: built in 1921 — expect roof / HVAC / electrical / plumbing capex.
Questions for the listing agent
- Built in 1921 — when were the roof, HVAC, electrical panel, plumbing, and water heater last replaced?
- Is there a deadline driving the sale (1031 exchange, divorce, estate, relocation)? That informs how much negotiation room exists.
- The area grade is low — what's the realistic commute time and amenity access for the typical tenant pool here? Any planned neighborhood developments (good or bad) we should know about?
- What's the average days-on-market for RENTAL listings here right now (not sales)? A rising rental-DOM trend means longer vacancies and softer asking-rent achievability than the comps imply.
- What's the recent tenant-quality profile in this submarket — average credit score on applications, eviction rate, late-payment / NSF rate, and stable-employment percentage? A property-management company in the area should have these aggregated.
- How much new apartment / multifamily construction is in the pipeline within 1–3 miles? Heavy new supply (>2% of stock underway) typically softens rents 12–24 months out; light construction supports rent growth.
Investment metrics
- 1% rule
- 0.95% ✗
- Cap rate
- 6.63%
- Cash-on-cash
- 1.21%
- DSCR
- 1.05
- GRM
- 8.8
CMA / ARV
No comps found within radius.
Projected returns pro-forma
-3.0% appreciation · 3.15% rent growth · sell at horizon
- IRR
- -14.2%
- Equity multiple
- 0.49×
- Total profit
- $-92,470
- Equity at exit
- $96,917
- IRR
- -5.1%
- Equity multiple
- 0.67×
- Total profit
- $-60,734
- Equity at exit
- $56,200
Cash invested: $182,000 (down + closing). Projections, not guarantees.
Landlord ↔ Tenant lean methodology
- Overall (STATE)
- 46 Balanced
- State Minnesota
- 46 Balanced · D+2
- County
- — inherits STATE
- City
- — inherits STATE
ZIP-level market 55105
- Rents YoY
- 3.1%
- Active inventory
- 124
- Price-to-rent
- 17.6×
Monthly cashflow live
- Estimated rent
- $6,168 medium interval (Pro) →
- Mortgage (P&I)
- −$3,409
- Tax from tax record
- −$1,009 /mo · $12,112/yr
- Insurance
- −$271
- HOA
- −$0
- Vacancy / Maint / Mgmt
- −$1,295
- Net cashflow
- $184
Break-even live
Sensitivity live
| Price | -10% $552 | -5% $368 | +0% $184 | +5% $0 | +10% $-184 |
|---|---|---|---|---|---|
| Rent | -10% $-303 | -5% $-60 | +0% $184 | +5% $428 | +10% $671 |
| Rate | -1.0pp $511 | -0.5pp $349 | base $184 | +0.5pp $15 | +1.0pp $-156 |
2-unit breakdown (identical units grouped — click to expand)
| Units | Beds | Baths | Est. rent |
|---|---|---|---|
| 1× unit | 3 | 1 | $3,084 |
| 1× unit | 3 | 2 | $3,084 |
| Total (2 units) | $6,168 | ||
UW: 25.0% down · 7.5% · 30yr · 1.5% tax · 5.0% vac · 8.0% maint · 8.0% mgmt
Financing live
Cash to close
- Down payment
- $162,500
- Closing costs
- $19,500
- Reserves months
- —
- Total cash needed
- —
Loan-product check · same deal, 3 products live
Conventional
25% down · 7.5% · 30yr
- Down + closing
- —
- Monthly P&I
- —
- Monthly cashflow
- —
- DSCR
- —
- Eligible?
- —
Personal DTI + credit; lowest rate.
DSCR
20% down · 8.5% · 30yr
- Down + closing
- —
- Monthly P&I
- —
- Monthly cashflow
- —
- DSCR
- —
- Eligible?
- —
No personal income docs; deal must DSCR.
Hard money
10% down · 12.0% · 12mo
- Down + closing
- —
- Monthly P&I
- —
- Monthly cashflow
- —
- DSCR
- —
- Eligible?
- —
Short-term bridge; refi at stabilization.
Listing history 15 events
-
2026-05-04status Pending
-
2026-04-27historical Contingent - Inspection
-
2026-04-24$650,000 Active
-
2026-04-20historical $650,000
-
2012-03-15soldstatus $379,900
-
2012-03-02soldstatus $379,900 36-char remark
Show marketing remark (36 chars)
Great layout for owner occupied plus
-
2012-02-06historical 36-char remark
Show marketing remark (36 chars)
Great layout for owner occupied plus
-
2012-01-30$374,900 36-char remark
Show marketing remark (36 chars)
Great layout for owner occupied plus
-
1999-03-03soldstatus $300,000
-
1998-12-15soldstatus $300,000
-
1998-12-15soldstatus $300,000
-
1998-11-06historical
-
1998-11-06historical
-
1998-09-18$309,900
-
1998-09-04$309,900
ⓘ Source: listings_history table (triggers on properties + properties_extension) + one-shot
backfill from property_details.listing_events for pre-trigger history.
Tax reassessment forecast MN · Partial reset (capped growth)
- Current annual tax
- $12,112 · $1,009/mo
- Projected year-2 tax
- $12,112 · $1,009/mo
- Expected delta
- $0/yr ($0/mo · 0.0%)
ⓘ Screening estimate from a state-policy table — verify with the county assessor before closing.
Climate risk First Street
- Flood 1/10 Low FEMA zone X (unshaded) · 0% chance over 30 yrs
- Wildfire 1/10 Low
- Heat 2/10 Low 7 d/yr ≥99°F today · 13 d/yr by 30 yrs out
- Wind 2/10 Low
- Air quality 2/10 Low 1 unhealthy d/yr today · 2 by 30 yrs out
Nearby sold comps map
Loading sold comps map…
Walkable amenities ~0.75 mi
Loading nearby amenities…
Taxation est. · year 1
- Rental income
- $74,016
- − Mortgage interest
- −$36,410
- − Property taxes
- −$12,112
- − Insurance
- −$3,250
- − Repairs & maintenance
- −$5,921
- − Management
- −$5,921
- − Depreciation
- −$18,909
- Taxable loss
- −$8,508
- Est. tax savings @ 24.0%
- +$2,042
- After-tax cash flow
- $4,248/yr
For passive investors: Depreciation is non-cash, so a rental often shows a tax loss while cash-flowing — sheltering income. Rental losses are passive: they offset passive income freely, and up to $25,000/yr can offset ordinary (W-2) income if you actively participate and your MAGI is under $100k (phasing out to $0 by $150k); unused losses carry forward. On sale, claimed depreciation is recaptured at up to 25%, and gains may owe capital-gains tax (a 1031 exchange can defer both). Figures are a year-1 estimate at your 24.0% rate — not tax advice; consult a CPA.
Schools (NCES district)
- District
- St. Paul Public School District
- NCES district ID
- 2733840
- Math proficiency
- 21% ▼ -11.00%
- Reading proficiency
- 33% ▼ -7.00%
- Median HH income
- $48,316
- Composite
- 23.51/100
- National rank
- #7868
- State rank
- #270 of 301 in MN
Livability — St. Paul
No livability data for this city. (Only ~50 U.S. cities are tracked.)
Census & demographics
- Census place
- St. Paul, MN
- County
- Ramsey County · 542,837 people
- City population
- 280,599
- Metro
- Minneapolis-St. Paul-Bloomington, MN-WI
- Population (ZIP)
- 28,617
- Household income
- $107,248
- Rent vs Own
- Severe rent burden
- 909.0
Population outlook (Ramsey County) Hauer SSP2
- Today (2025)
- 603,431 people
- By 2030
- 636,459 · +5.5%
- By 2040
- 700,596 · +16.1%
- By 2050
- 765,819 · +26.9%
- By 2075
- 929,297 · +54.0%
- By 2100
- 1,053,924 · +74.7%
Race, ethnicity, and origin ACS 2023
- Neighborhood character
- Predominantly White (82%)
- Race & ethnicity
- White 82% Two or more races 7% Hispanic / Latino 5% Asian 4% Black 3%
- Hispanic origin (detail)
- Mexican 2%
- Common ancestry
- Portuguese 11% Romanian 4% Lithuanian 4%
- Foreign-born
- 4% · Canada, China, South Korea
- Languages at home
- 91% English-only · Spanish 4% German/W. Germanic 1% Other Asian/Pacific 1%
Political lean MEDSL · Ramsey
- 2024 margin
- Solid D (+43.3) · D 70.5% · R 27.2% · Other 2.3%
- 2008→2024 swing
- +9.4pp toward D · 2008: 33.9pp · 2024: 43.3pp
- All cycles
- 2024: D+43.3 2020: D+45.4 2016: D+39.4 2012: D+35.3 2008: D+33.9
Not yet ingested
- Civics
- —
Market trends
- HPI YoY
- ▼ -562.23%
- Current HPI
- 223.6008
- Rent YoY
- ▲ 3.15%
- Metro
- Minneapolis-St. Paul-Bloomington, MN-WI
- State GDP YoY
- ▲ 2.41%
- F500 in state
- 34
Industry mix (Fortune 500 HQ in MN)
| Industry | F500 HQs | Revenue |
|---|---|---|
| Healthcare | 2 | $407B |
|
||
| Retail | 2 | $150B |
|
||
| Consumer Goods | 2 | $32B |
|
||
| Industrial Machinery | 2 | $6B |
|
||
| Agriculture | 1 | $40B |
|
||
| Healthcare / Medical Devices | 1 | $32B |
|
||
Price history
+109.7% since first listed15 events — show timeline
- 2026-05-04 Pending — NORTHSTARMLS as Distributed by MLS Grid
- 2026-04-27 Contingent — NORTHSTARMLS as Distributed by MLS Grid
- 2026-04-24 Listed $650,000 NORTHSTARMLS as Distributed by MLS Grid
- 2026-04-20 Coming Soon $650,000 NORTHSTARMLS as Distributed by MLS Grid
- 2012-03-15 Sold (Public Records) $379,900 Public Records
- 2012-03-02 Sold (MLS) $379,900 NORTHSTARMLS as Distributed by MLS Grid
- 2012-02-06 Listing Removed — NORTHSTARMLS as Distributed by MLS Grid
- 2012-01-30 Listed $374,900 NORTHSTARMLS as Distributed by MLS Grid
- 1999-03-03 Sold (Public Records) $300,000 Public Records
- 1998-12-15 Sold (MLS) $300,000 NORTHSTARMLS as Distributed by MLS Grid
- 1998-12-15 Sold (MLS) $300,000 NORTHSTARMLS as Distributed by MLS Grid
- 1998-11-06 Listing Removed — NORTHSTARMLS as Distributed by MLS Grid
- 1998-11-06 Listing Removed — NORTHSTARMLS as Distributed by MLS Grid
- 1998-09-18 Listed $309,900 NORTHSTARMLS as Distributed by MLS Grid
- 1998-09-04 Listed $309,900 NORTHSTARMLS as Distributed by MLS Grid
Property tax history
+31.5%/yrLatest (2025): $12,112 · +13.9% YoY. Source: county tax records.
Cash-flow waterfall
monthlySold comps — $/sqft
last 12 mo · ≤1 miLoading sold comps…