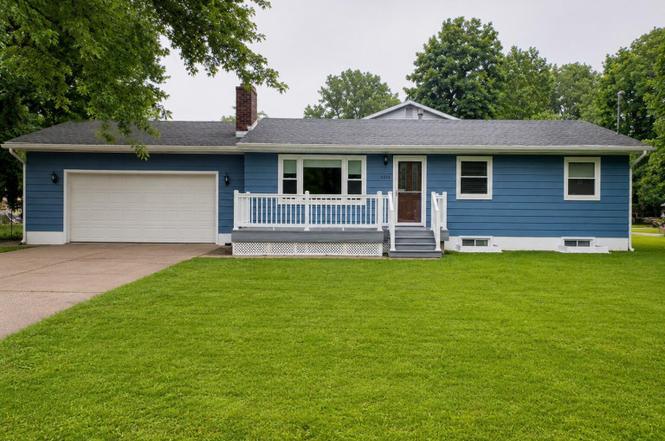
4264 N Kim Rye Ln · Delhi, MI
Flood risk 1/10 · Minimal
- FEMA flood zone
- X (unshaded)
- Chance of flooding over 30 yrs
- 0.0%
- Est. flood insurance / yr
- $507 – $1,088
Fire risk 1/10 · Minimal
- Est. fire insurance / yr
- $784 – $1,456
Heat risk 2/10 · Minimal
- Hot days now (above 97°F)
- 7 days/yr
- Hot days in 30 yrs
- 16 days/yr
Wind risk 2/10 · Minimal
- Chance of severe wind over 30 yrs
- —
Air-quality risk 2/10 · Minimal
- Unhealthy air days now
- 1 days/yr
- Unhealthy air days in 30 yrs
- 2 days/yr
Risk factors via First Street. Map © Google.
Why this score? — see what drove the D+ grade
The composite is a weighted blend of 9 inputs, each scored 0–100. Each bar is that input's sub-score; the figure is the points it added to the 100-point composite (weight × sub-score).
- Cash flow +16.2/30.0
- ARV discount +10.4/15.0
- DSCR +5.0/10.0
- Rent growth +4.5/5.0
- 1% rule +4.3/10.0
- Schools +3.3/10.0
- Livability +2.5/5.0
- Condition / age +2.5/5.0
- Appreciation +0.0/10.0
$225,000
🖨 Deal sheet 📄 Offer letter ✓ Due diligence
Listing remarks MLS
Lots of updating has been completed in this home. Newer appliances & flooring in kitchen; cupboards painted; newly installed tile backsplash. Newer carpet in bedrooms. Lower level has a family room with woodburning fireplace and an office; both have newer carpet. Lots of storage in basement; basement has had a B-dry system installed. Large front deck; cul-de-sac location.
Key facts
- Quiet cul-de-sac
- Attached garage
- Corner lot
Tags
Neighborhood map
What this means for you Summary
Snapshot
- This is a 3-bed/1.0-bath single-family listed at $225k.
Deal economics
- At list price, monthly cash flow is $118 ($1k/yr) — positive.
- The deal already cash-flows at list — no discount required.
- To meet the 1% rule (rent ≥ 1% of price), the offer needs to be $209k (7.2% below list).
- Recommended offer: $209k (7.2% below list) — sets the bar for 1% rule.
Location & tenants
- Location reads: area grade D — affects rentability + tenant quality, not the cash-flow math above.
- Holt Public Schools (suburban): math 28% / reading 46% proficiency, ranked #236 of 540 in MI (top 44%) — families likely to look elsewhere, expect single-tenant / working-renter base with shorter leases.
- Market conditions: Rents rising fast (+8.0%/yr); 75 active listings in the ZIP; 4 comparable units currently listed for rent nearby; rentals at typical pace (median 21d on market — plan ~3-4 weeks tenant-placement turnaround); solid renter incomes; 350 units permitted in Ingham County in 2024 (186 in 5+ unit buildings).
Forward outlook
- Local home prices are declining (-3.0%/yr); year-one equity from $2k of loan paydown is wiped out by about $7k of value loss. Plan a longer hold.
- Ingham County population projected at +11% by 2050 — modest demand growth; plan on rents tracking national, not racing it.
Negotiation context
- Only 1 days on market — expect competitive offers; lowballing is unlikely to land.
- 4 sale attempts since 20y ago; this cycle's ask is 80% above the opening price — seller raised mid-cycle; expect resistance to lowballs.
- Current owner paid $131k; list at $225k implies a 72% gain — meaningful room to come down on a strong offer.
Questions for the listing agent
- Built in 1977 — when were the roof, HVAC, electrical panel, plumbing, and water heater last replaced?
- Is there a deadline driving the sale (1031 exchange, divorce, estate, relocation)? That informs how much negotiation room exists.
- The area grade is low — what's the realistic commute time and amenity access for the typical tenant pool here? Any planned neighborhood developments (good or bad) we should know about?
- What's the average days-on-market for RENTAL listings here right now (not sales)? A rising rental-DOM trend means longer vacancies and softer asking-rent achievability than the comps imply.
- What's the recent tenant-quality profile in this submarket — average credit score on applications, eviction rate, late-payment / NSF rate, and stable-employment percentage? A property-management company in the area should have these aggregated.
- How much new for-sale + rental construction is in the pipeline within 1–3 miles? Heavy new supply typically softens prices + rents 12–24 months out; constrained supply supports both.
Investment metrics
- 1% rule
- 0.93% ✗
- Cap rate
- 6.92%
- Cash-on-cash
- 2.25%
- DSCR
- 1.10
- GRM
- 9.0
CMA / ARV
- ARV (on-the-fly)
- $240,240
- Comps found
- 12
Show comp detail 12 sales within ~0.75 mi
| Address | Dist | Beds/Ba | Sqft | Sold | Price | $/sf | Match |
|---|---|---|---|---|---|---|---|
| 4327 Keller Rd | 0.18mi | 2/2.0 (-1) | 1,646 (+6%) | 3mo | $240,000 | $146 | 71 |
| 4519 Spahr Ave | 0.55mi | 3/2.0 | 1,524 (-2%) | 0mo | $234,000 | $154 | 66 |
| 4335 Norway St | 0.41mi | 3/2.5 | 1,625 (+4%) | 6mo | $324,900 | $200 | 63 |
| 4348 Norway St | 0.44mi | 3/2.5 | 1,669 (+7%) | 4mo | $328,000 | $197 | 58 |
| 4314 Ringneck Ln | 0.20mi | 3/2.5 | 1,755 (+12%) | 7mo | $339,900 | $194 | 58 |
| 4439 Keller Rd | 0.36mi | 4/1.0 (+1) | 1,344 (-14%) | 1mo | $235,000 | $175 | 54 |
| 2189 N Aurelius Rd | 0.54mi | 3/1.0 | 1,702 (+9%) | 7mo | $215,000 | $126 | 54 |
| 4345 Keelson Dr | 0.65mi | 3/2.0 | 1,462 (-6%) | 4mo | $295,000 | $202 | 52 |
| 4190 Greenwood Ave | 0.57mi | 3/2.0 | 1,671 (+7%) | 8mo | $225,000 | $135 | 51 |
| 2111 Cedar St | 0.48mi | 4/1.5 (+1) | 1,690 (+8%) | 9mo | $130,000 | $77 | 49 |
| 7011 Aurelius Rd | 0.64mi | 3/1.0 | 1,384 (-11%) | 4mo | $165,000 | $119 | 48 |
| 4461 Holt Rd | 0.75mi | 4/2.0 (+1) | 1,367 (-12%) | 1mo | $210,000 | $154 | 35 |
Match score weights: distance 35% · size 25% · config 20% · recency 20%. Top-matched comps best support the ARV.
Projected returns pro-forma
-3.0% appreciation · 8.0% rent growth · sell at horizon
- IRR
- -7.3%
- Equity multiple
- 0.72×
- Total profit
- $-17,877
- Equity at exit
- $33,548
- IRR
- 7.6%
- Equity multiple
- 1.70×
- Total profit
- $44,407
- Equity at exit
- $19,454
Cash invested: $63,000 (down + closing). Projections, not guarantees.
Landlord ↔ Tenant lean methodology
- Overall (STATE)
- 62 Landlord-Friendly
- State Michigan
- 62 Landlord-Friendly · EVEN
- County
- — inherits STATE
- City
- — inherits STATE
ZIP-level market 48842
- Rents YoY
- 8.0%
- Active inventory
- 75
- Price-to-rent
- 9.0×
Monthly cashflow live
- Estimated rent
- $2,087 medium interval (Pro) →
- Mortgage (P&I)
- −$1,180
- Tax from tax record
- −$257 /mo · $3,083/yr
- Insurance
- −$94
- HOA
- −$0
- Vacancy / Maint / Mgmt
- −$438
- Net cashflow
- $118
Break-even live
UW: 25.0% down · 7.5% · 30yr · 1.5% tax · 5.0% vac · 8.0% maint · 8.0% mgmt
Financing live
Cash to close
- Down payment
- $56,250
- Closing costs
- $6,750
- Reserves months
- —
- Total cash needed
- —
Loan-product check · same deal, 3 products live
Conventional
25% down · 7.5% · 30yr
- Down + closing
- —
- Monthly P&I
- —
- Monthly cashflow
- —
- DSCR
- —
- Eligible?
- —
Personal DTI + credit; lowest rate.
DSCR
20% down · 8.5% · 30yr
- Down + closing
- —
- Monthly P&I
- —
- Monthly cashflow
- —
- DSCR
- —
- Eligible?
- —
No personal income docs; deal must DSCR.
Hard money
10% down · 12.0% · 12mo
- Down + closing
- —
- Monthly P&I
- —
- Monthly cashflow
- —
- DSCR
- —
- Eligible?
- —
Short-term bridge; refi at stabilization.
Rent comps 4 comps
| Address | Beds | Baths | Sqft | Rent | $/sqft | DOM | Units | Dist |
|---|---|---|---|---|---|---|---|---|
| 2030 N Cedar St Holt, MI | 1.0–2.0 | 1.0–2.0 | 930 | $1,679 | $1.81 | 13d | 6 | 0.54mi |
| 4075 Holt Rd Holt, MI | 1.0–3.0 | 1.0–2.0 | 1000 | $1,239 | $1.24 | 13d | 1 | 0.90mi |
| 3879 Lone Pne Holt, MI | 1.0–2.0 | 1.0–2.0 | 1148 | $2,322 | $2.02 | 21d | 1 | 1.03mi |
| 6158 N Aurelius Rd Lansing, MI | 4.0 | 3.0 | 1641 | $2,495 | $1.52 | 21d | 1 | 1.39mi |
Listing history 2 events
-
2026-06-18remarks 699-char remark
-
2026-06-18$225,000 Coming Soon 1 DOM
ⓘ Source: listings_history table (triggers on properties + properties_extension) + one-shot
backfill from property_details.listing_events for pre-trigger history.
Tax reassessment forecast MI · Partial reset (capped growth)
- Current annual tax
- $3,083 · $257/mo
- Projected year-2 tax
- $3,274 · $273/mo
- Expected delta
- +$191/yr (+$16/mo · 6.2%)
ⓘ Screening estimate from a state-policy table — verify with the county assessor before closing.
Climate risk First Street
- Flood 1/10 Low FEMA zone X (unshaded) · 0% chance over 30 yrs
- Wildfire 1/10 Low
- Heat 2/10 Low 7 d/yr ≥97°F today · 16 d/yr by 30 yrs out
- Wind 2/10 Low
- Air quality 2/10 Low 1 unhealthy d/yr today · 2 by 30 yrs out
Nearby sold comps map
Loading sold comps map…
Walkable amenities ~0.75 mi
Loading nearby amenities…
Taxation est. · year 1
- Rental income
- $25,047
- − Mortgage interest
- −$12,603
- − Property taxes
- −$3,083
- − Insurance
- −$1,125
- − Repairs & maintenance
- −$2,004
- − Management
- −$2,004
- − Depreciation
- −$6,545
- Taxable loss
- −$2,318
- Est. tax savings @ 24.0%
- +$556
- After-tax cash flow
- $1,976/yr
For passive investors: Depreciation is non-cash, so a rental often shows a tax loss while cash-flowing — sheltering income. Rental losses are passive: they offset passive income freely, and up to $25,000/yr can offset ordinary (W-2) income if you actively participate and your MAGI is under $100k (phasing out to $0 by $150k); unused losses carry forward. On sale, claimed depreciation is recaptured at up to 25%, and gains may owe capital-gains tax (a 1031 exchange can defer both). Figures are a year-1 estimate at your 24.0% rate — not tax advice; consult a CPA.
Schools (NCES district)
- District
- Holt Public Schools
- NCES district ID
- 2618480
- Math proficiency
- 28% ▼ -10.00%
- Reading proficiency
- 46% ▼ -5.00%
- Median HH income
- $57,705
- Composite
- 32.68/100
- National rank
- #5653
- State rank
- #236 of 540 in MI
Livability — Delhi
No livability data for this city. (Only ~50 U.S. cities are tracked.)
Census & demographics
- Census place
- Holt, MI
- County
- Ingham County · 237,052 people
- Metro
- Lansing-East Lansing, MI
- Population (ZIP)
- 21,945
- Household income
- $88,340
- Rent vs Own
- Severe rent burden
- 545.0
Population outlook (Ingham County) Hauer SSP2
- Today (2025)
- 300,362 people
- By 2030
- 307,808 · +2.5%
- By 2040
- 320,492 · +6.7%
- By 2050
- 333,223 · +10.9%
- By 2075
- 373,693 · +24.4%
- By 2100
- 392,021 · +30.5%
Race, ethnicity, and origin ACS 2023
- Neighborhood character
- Predominantly White (76%)
- Race & ethnicity
- White 76% Two or more races 9% Hispanic / Latino 7% Black 6% Asian 5%
- Hispanic origin (detail)
- Mexican 6% Cuban 1%
- Common ancestry
- Romanian 7% Lithuanian 3% Iranian 2%
- Foreign-born
- 6% · Vietnam, Canada, China
- Languages at home
- 94% English-only · Other Indo-European 2% Vietnamese 1% Spanish 1%
Political lean MEDSL · Ingham
- 2024 margin
- Strong D (+29.7) · D 63.9% · R 34.2% · Other 2.0%
- 2008→2024 swing
- -3.6pp toward R · 2008: 33.3pp · 2024: 29.7pp
- All cycles
- 2024: D+29.7 2020: D+32.2 2016: D+27.6 2012: D+27.9 2008: D+33.3
Not yet ingested
- Civics
- —
Market trends
- HPI YoY
- ▼ -184.41%
- Current HPI
- 208.5101
- Rent YoY
- ▲ 8.03%
- Metro
- Lansing-East Lansing, MI
- State GDP YoY
- ▲ 1.37%
- F500 in state
- 28
Industry mix (Fortune 500 HQ in MI)
| Industry | F500 HQs | Revenue |
|---|---|---|
| Automotive Parts | 3 | $48B |
|
||
| Automotive | 2 | $372B |
|
||
| Chemicals | 1 | $45B |
|
||
| Automotive Retail | 1 | $29B |
|
||
| Healthcare / Medical Devices | 1 | $23B |
|
||
| Automotive Technology | 1 | $20B |
|
||
Price history
+74.6% since first listed12 events — show timeline
- 2026-06-18 Coming Soon $225,000 Greater Lansing AoR
- 2017-03-30 Sold (Public Records) $131,000 Public Records
- 2017-03-24 Sold (MLS) $131,000 Greater Lansing AoR
- 2017-03-24 Sold (MLS) $131,000 REALCOMP
- 2016-12-08 Listed $124,900 Greater Lansing AoR
- 2016-12-08 Listed $124,900 REALCOMP
- 2013-12-10 Listing Removed — Greater Lansing AoR
- 2013-12-06 Listed $129,900 Greater Lansing AoR
- 2006-10-07 Listing Removed — Greater Lansing AoR
- 2006-07-07 Listed $145,000 Greater Lansing AoR
- 2004-02-03 Sold (Public Records) $125,000 Public Records
- 2001-08-10 Sold (Public Records) $128,900 Public Records
Property tax history
+0.8%/yrLatest (2025): $3,083 · +3.3% YoY. Source: county tax records.
Cash-flow waterfall
monthlySold comps — $/sqft
last 12 mo · ≤1 miLoading sold comps…