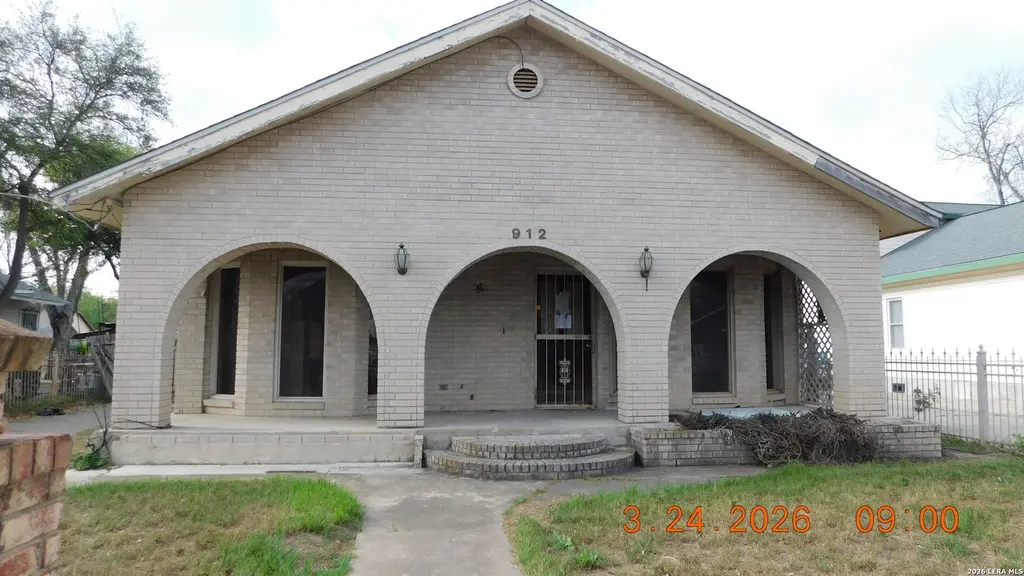
912 W Theo Ave · San Antonio, TX
Flood risk 1/10 · Minimal
- FEMA flood zone
- X (unshaded)
- Chance of flooding over 30 yrs
- 0.0%
- Est. flood insurance / yr
- $507 – $1,088
Fire risk 1/10 · Minimal
- Est. fire insurance / yr
- $1,222 – $2,270
Heat risk 8/10 · Major
- Hot days now (above 108°F)
- 7 days/yr
- Hot days in 30 yrs
- 21 days/yr
Wind risk 8/10 · Major
- Chance of severe wind over 30 yrs
- 80.0%
Air-quality risk 2/10 · Minimal
- Unhealthy air days now
- 1 days/yr
- Unhealthy air days in 30 yrs
- 2 days/yr
Risk factors via First Street. Map © Google.
Why this score? — see what drove the B+ grade
The composite is a weighted blend of 9 inputs, each scored 0–100. Each bar is that input's sub-score; the figure is the points it added to the 100-point composite (weight × sub-score).
- Cash flow +27.7/30.0
- ARV discount +15.0/15.0
- 1% rule +10.0/10.0
- DSCR +9.8/10.0
- Appreciation +6.9/10.0
- Livability +4.0/5.0
- Rent growth +2.5/5.0
- Condition / age +2.5/5.0
- Schools +1.4/10.0
$86,150
🖨 Deal sheet 📄 Offer letter ✓ Due diligence
Listing remarks MLS
Nice older home with a lot of potential. Long driveway, large shed (19 x19), and two smaller storage units. Front of home is Spanish style porch. Large rooms and ceramic tiled restroom. Street at front is one way. Near place of worship, Dollar store, restaurants, and much more. Make this your home and make it your way. Purchase with cash or possibly FHA 203K. Selling "AS IS". Buyer should inspect and confirm room sizes, schools, etc... Offers must be submitted through the link provided in the "Confidential Remarks" section.
Key facts
- Spanish style porch
- One way street
- Long driveway
Tags
Neighborhood map
What this means for you Summary
Snapshot
- This is a 2-bed/1.0-bath single-family listed at $86k.
Deal economics
- At list price, monthly cash flow is $260 ($3k/yr) — positive.
- The deal already cash-flows at list — no discount required.
- Meets the 1% rule at list price ($1k rent vs $86k).
- Recommended offer: $81k (6.0% below list) — sets the bar for market timing.
- Cap rate 9.9% vs local median 3.8% in San Antonio — top-decile yield for the area; either an underpriced asset or a hidden risk that comps aren't pricing in. Stress-test before assuming the spread holds.
Location & tenants
- Location reads 80/100 on livability (#31 in TX, #1,616 nationally) — a professional / high-income tenant draw. Strengths: amenities A+, commute A+, cost of living A+; Watch: schools C-, crime F.
- San Antonio ISD (urban): math 12% / reading 22% proficiency, ranked #805 of 826 in TX (top 98%) — low school quality limits family demand, transient renter base, plan for 1-2y turnover; 80% free/reduced lunch — lower-income household profile, screen leases tightly.
- Market conditions: 36 active listings in the ZIP; 40 comparable units currently listed for rent nearby; rentals at typical pace (median 24d on market — plan ~3-4 weeks tenant-placement turnaround); 8,308 units permitted in Bexar County in 2024 (2,506 in 5+ unit buildings).
- This rent runs 35% of the median local income ($47k/yr) — at the standard rent-burdened threshold; future hikes will face affordability resistance.
Forward outlook
- In year one you build about $4k of equity ($596 loan paydown + $3k appreciation (3.8% local appreciation)).
- Bexar County population projected at +50% by 2050 — long-run rental-demand tailwind backs the buy-and-hold thesis.
- At projected returns (3.8% appreciation + 3.0% rent growth), your $24k cash investment doubles in ~4 years — after that, you're playing with house money.
- By year 9, paydown + projected appreciation supports a ~$33k cash-out refi (75% LTV) — recoverable capital for the next deal without selling this one.
Negotiation context
- It's been on market 75 days — a 6% lower offer ($81k) is reasonable based on typical stale-listing flexibility.
Risks & watch-outs
- Watch-outs: property tax is 4.5% of price; built in 1941 — expect roof / HVAC / electrical / plumbing capex.
- Climate carrying-cost: severe wind risk, 80% chance of damaging wind over 30y; extreme-heat days projected 7→21/yr by 2055 (HVAC capex compounding) — expect insurance premiums to compound above CPI over the hold.
Questions for the listing agent
- It's been on market 75 days. Have you received any prior offers? Is the seller open to a 6% concession, seller financing, or rate buy-down credit?
- Built in 1941 — when were the roof, HVAC, electrical panel, plumbing, and water heater last replaced?
- Property tax is high relative to price — has the assessment been appealed recently, and will the sale trigger a re-assessment?
- Why hasn't it sold? Are there any deal-killer items the seller is aware of (foundation, flood, title, zoning, code violations)?
- Is there a deadline driving the sale (1031 exchange, divorce, estate, relocation)? That informs how much negotiation room exists.
- Crime grade is F in this area — have there been break-ins, vandalism, or insurance claims at this property in the last 3 years? What carrier currently insures it and at what premium?
- What's the average days-on-market for RENTAL listings here right now (not sales)? A rising rental-DOM trend means longer vacancies and softer asking-rent achievability than the comps imply.
- What's the recent tenant-quality profile in this submarket — average credit score on applications, eviction rate, late-payment / NSF rate, and stable-employment percentage? A property-management company in the area should have these aggregated.
- How much new for-sale + rental construction is in the pipeline within 1–3 miles? Heavy new supply typically softens prices + rents 12–24 months out; constrained supply supports both.
Investment metrics
- 1% rule
- 1.57% ✓
- Cap rate
- 9.92%
- Cash-on-cash
- 12.96%
- DSCR
- 1.58
- GRM
- 5.3
CMA / ARV
- ARV (median comp)
- $166,066
- List price
- $86,150
- Delta
- -48.12%
- Verdict
- UNDERPRICED
- Comps
- 20 within 1.0 mi
Show comp detail 12 sales within ~0.75 mi
| Address | Dist | Beds/Ba | Sqft | Sold | Price | $/sf | Match |
|---|---|---|---|---|---|---|---|
| 807 Eldorado | 0.37mi | 3/1.0 (+1) | 1,128 (-1%) | 1mo | $160,000 | $142 | 75 |
| 122 Hoover | 0.22mi | 2/1.0 | 1,034 (-9%) | 1mo | $170,000 | $164 | 73 |
| 606 Cottonwood | 0.27mi | 2/1.5 | 1,049 (-8%) | 4mo | $85,000 | $81 | 69 |
| 822 Glenn | 0.23mi | 3/1.0 (+1) | 1,220 (+7%) | 5mo | $52,000 | $43 | 68 |
| 119 Carroll | 0.30mi | 3/2.0 (+1) | 1,184 (+4%) | 5mo | $228,900 | $193 | 67 |
| 531 Cottonwood | 0.34mi | 3/1.0 (+1) | 1,044 (-8%) | 5mo | $233,000 | $223 | 62 |
| 307 Jennings | 0.38mi | 3/1.0 (+1) | 1,236 (+8%) | 4mo | $129,000 | $104 | 60 |
| 319 Roslyn | 0.71mi | 3/2.0 (+1) | 1,150 (+1%) | 3mo | $199,000 | $173 | 54 |
| 1419 W Malone Ave | 0.60mi | 3/1.0 (+1) | 995 (-13%) | 5mo | $129,999 | $131 | 41 |
| 1214 Chalmers Ave | 0.74mi | 3/2.0 (+1) | 1,261 (+11%) | 1mo | $229,900 | $182 | 38 |
| 241 Hawthorne | 0.73mi | 3/2.0 (+1) | 1,259 (+10%) | 6mo | $225,000 | $179 | 35 |
| 126 Sims Ave | 0.66mi | 3/2.0 (+1) | 1,296 (+14%) | 5mo | $135,000 | $104 | 34 |
Match score weights: distance 35% · size 25% · config 20% · recency 20%. Top-matched comps best support the ARV.
Projected returns pro-forma
3.81% appreciation · 3.0% rent growth · sell at horizon
- IRR
- 21.6%
- Equity multiple
- 2.28×
- Total profit
- $30,858
- Equity at exit
- $42,713
- IRR
- 22.0%
- Equity multiple
- 4.41×
- Total profit
- $82,355
- Equity at exit
- $69,101
Cash invested: $24,122 (down + closing). Projections, not guarantees.
Landlord ↔ Tenant lean methodology
- Overall (STATE)
- 87 Strongly Landlord-Friendly
- State Texas
- 87 Strongly Landlord-Friendly · R+5
- County
- — inherits STATE
- City
- — inherits STATE
ZIP-level market 78225
- Home prices YoY
- 1.5%
- Active inventory
- 36
- Price-to-rent
- 5.3×
Monthly cashflow live
- Estimated rent
- $1,354 high interval (Pro) →
- Mortgage (P&I)
- −$452
- Tax from tax record
- −$321 /mo · $3,854/yr
- Insurance
- −$36
- HOA
- −$0
- Vacancy / Maint / Mgmt
- −$284
- Net cashflow
- $260
Break-even live
UW: 25.0% down · 7.5% · 30yr · 1.5% tax · 5.0% vac · 8.0% maint · 8.0% mgmt
Financing live
Cash to close
- Down payment
- $21,538
- Closing costs
- $2,584
- Reserves months
- —
- Total cash needed
- —
Loan-product check · same deal, 3 products live
Conventional
25% down · 7.5% · 30yr
- Down + closing
- —
- Monthly P&I
- —
- Monthly cashflow
- —
- DSCR
- —
- Eligible?
- —
Personal DTI + credit; lowest rate.
DSCR
20% down · 8.5% · 30yr
- Down + closing
- —
- Monthly P&I
- —
- Monthly cashflow
- —
- DSCR
- —
- Eligible?
- —
No personal income docs; deal must DSCR.
Hard money
10% down · 12.0% · 12mo
- Down + closing
- —
- Monthly P&I
- —
- Monthly cashflow
- —
- DSCR
- —
- Eligible?
- —
Short-term bridge; refi at stabilization.
Rent comps 40 comps
| Address | Beds | Baths | Sqft | Rent | $/sqft | DOM | Units | Dist |
|---|---|---|---|---|---|---|---|---|
| 150 Hearne San Antonio, TX | 2.0 | 1.0 | 1044 | $1,400 | $1.34 | 23d | 1 | 0.23mi |
| 616 Sims Ave San Antonio, TX | 3.0 | 1.0 | 1148 | $875 | $0.76 | 43d | 1 | 0.34mi |
| 815 Ripford St San Antonio, TX | 2.0 | 1.0 | 728 | $1,300 | $1.79 | 4d | 1 | 0.50mi |
| 329 Taft Blvd San Antonio, TX | 2.0 | 2.0 | 862 | $2,200 | $2.55 | 1d | 1 | 0.56mi |
| 1130 Sims Ave San Antonio, TX | 3.0 | 2.0 | 1206 | $1,300 | $1.08 | 23d | 1 | 0.59mi |
| 834 Division Ave Unit 2 San Antonio, TX | 2.0 | 1.0 | 936 | $950 | $1.01 | 4d | 1 | 0.60mi |
| 834 Division Ave San Antonio, TX | 2.0 | 1.0 | 700 | $1,050 | $1.50 | 23d | 1 | 0.61mi |
| 450 Taft Blvd San Antonio, TX | 3.0 | 1.0 | 883 | $1,295 | $1.47 | 43d | 1 | 0.63mi |
| 463 Linares St San Antonio, TX | 3.0 | 1.0 | 1220 | $1,400 | $1.15 | 23d | 1 | 0.73mi |
| 410 N Park Blvd San Antonio, TX | 3.0 | 2.0 | 1326 | $1,650 | $1.24 | 43d | 1 | 0.76mi |
| 575 Division Ave San Antonio, TX | 3.0 | 1.5 | 1362 | $1,950 | $1.43 | 17d | 1 | 0.76mi |
| 503 W Hart Ave San Antonio, TX | 3.0 | 1.0 | 1232 | $1,750 | $1.42 | 10d | 1 | 0.81mi |
| 242 Drake Ave Unit 242 San Antonio, TX | 3.0 | 2.0 | 1472 | $1,700 | $1.15 | 43d | 1 | 0.82mi |
| 626 Kirk Pl San Antonio, TX | 2.0 | 1.0 | 912 | $1,100 | $1.21 | 19d | 1 | 0.84mi |
| 542 Drake Ave San Antonio, TX | 3.0 | 2.0 | 1368 | $1,875 | $1.37 | 43d | 1 | 0.84mi |
| 161 Kaine St San Antonio, TX | 3.0 | 1.0 | 1000 | $1,450 | $1.45 | 17d | 1 | 0.90mi |
| 1222 Brighton Ave Unit B San Antonio, TX | 3.0 | 1.0 | 725 | $999 | $1.38 | 17d | 1 | 0.92mi |
| 131 Elsie Unit 301 San Antonio, TX | 2.0 | 1.0 | 950 | $795 | $0.84 | 4d | 1 | 0.93mi |
| 134 Gladstone St San Antonio, TX | 2.0 | 1.0 | 1407 | $1,000 | $0.71 | 10d | 1 | 0.95mi |
| 114 Teresa San Antonio, TX | 3.0 | 1.0 | 984 | $1,450 | $1.47 | 23d | 1 | 0.96mi |
| 438 Pruitt Ave #1 San Antonio, TX | 2.0 | 1.0 | 980 | $1,245 | $1.27 | 43d | 1 | 0.99mi |
| 310 Finton Unit A San Antonio, TX | 1.0 | 1.0 | 960 | $850 | $0.89 | 43d | 1 | 1.01mi |
| 415 Chalmers Ave San Antonio, TX | 2.0 | 1.0 | 1340 | $1,200 | $0.90 | 23d | 1 | 1.03mi |
| 515 Humble Ave San Antonio, TX | 1.0 | 1.0 | 700 | $810 | $1.16 | 43d | 1 | 1.12mi |
| 333 Frio City Rd Unit 1 San Antonio, TX | 2.0 | 1.0 | 1350 | $1,350 | $1.00 | 10d | 1 | 1.16mi |
| 222 Glass Ave San Antonio, TX | 2.0 | 2.0 | 1007 | $2,400 | $2.38 | 43d | 1 | 1.21mi |
| 2114 Jupiter St San Antonio, TX | 3.0 | 3.0 | 1233 | $1,457 | $1.18 | 21d | 1 | 1.25mi |
| 231 Ceralvo St Unit Na San Antonio, TX | 3.0 | 2.0 | 1160 | $1,695 | $1.46 | 43d | 1 | 1.25mi |
| 3103 Neptune St San Antonio, TX | 3.0 | 2.0 | 1008 | $1,350 | $1.34 | 43d | 1 | 1.25mi |
| 2600 S Flores St San Antonio, TX | 2.0 | 1.0 | 705 | $900 | $1.28 | 23d | 3 | 1.27mi |
| 118 Carthage Ct San Antonio, TX | 3.0 | 2.0 | 1368 | $1,450 | $1.06 | 17d | 1 | 1.27mi |
| 319 Noria St San Antonio, TX | 3.0 | 1.0 | 1002 | $1,100 | $1.10 | 23d | 1 | 1.29mi |
| 1901 S San Marcos Unit 610 San Antonio, TX | 1.0 | 1.0 | 750 | $962 | $1.28 | 2d | 1 | 1.30mi |
| 1901 S San Marcos Unit 710 San Antonio, TX | 2.0 | 2.0 | 985 | $1,147 | $1.16 | 2d | 1 | 1.30mi |
| 611 Brunswick Blvd San Antonio, TX | 3.0 | 2.0 | 1080 | $1,700 | $1.57 | 23d | 1 | 1.32mi |
| 611 Brunswick Blvd San Antonio, TX | 3.0 | 2.0 | 1080 | $1,700 | $1.57 | 14d | 1 | 1.32mi |
| 607 Brunswick Blvd San Antonio, TX | 3.0 | 2.0 | 1350 | $1,750 | $1.30 | 43d | 1 | 1.32mi |
| 205 Mockert San Antonio, TX | 2.0 | 1.0 | 864 | $1,050 | $1.22 | 23d | 1 | 1.33mi |
| 120 Bank St San Antonio, TX | 3.0 | 2.0 | 1035 | $1,495 | $1.44 | 43d | 1 | 1.33mi |
| 120 Bank St San Antonio, TX | 3.0 | 2.0 | 1035 | $1,450 | $1.40 | 19d | 1 | 1.33mi |
Listing history 11 events
-
2026-06-10status $86,150 Pending 75 DOM
-
2026-06-09days on market $86,150 Active Option 75 DOM
-
2026-06-08days on market $86,150 Active Option 74 DOM
-
2026-06-07days on market $86,150 Active Option 73 DOM
-
2026-06-04days on market $86,150 Active Option 70 DOM
-
2026-06-03days on market $86,150 Active Option 69 DOM
-
2026-06-02days on market $86,150 Active Option 68 DOM
-
2026-06-01days on market $86,150 Active Option 67 DOM
-
2026-05-31days on market $86,150 Active Option 66 DOM
-
2026-04-23price $86,150 559-char remark
Show marketing remark (559 chars)
Nice older home with a lot of potential. Long driveway, large shed (19 x19), and two smaller storage units. Front of home is Spanish style porch. Large rooms and ceramic tiled restroom. Street at front is one way. Near place of worship, Dollar store, restaurants, and much more. Make this your home and make it your way. Purchase with cash or possibly FHA 203K. Selling "AS IS". Buyer should inspect and confirm room sizes, schools, etc... Offers must be submitted through the link provided in the "Confidential Remarks" section.
-
2026-03-26$93,600 New 559-char remark
Show marketing remark (559 chars)
Nice older home with a lot of potential. Long driveway, large shed (19 x19), and two smaller storage units. Front of home is Spanish style porch. Large rooms and ceramic tiled restroom. Street at front is one way. Near place of worship, Dollar store, restaurants, and much more. Make this your home and make it your way. Purchase with cash or possibly FHA 203K. Selling "AS IS". Buyer should inspect and confirm room sizes, schools, etc... Offers must be submitted through the link provided in the "Confidential Remarks" section.
ⓘ Source: listings_history table (triggers on properties + properties_extension) + one-shot
backfill from property_details.listing_events for pre-trigger history.
Tax reassessment forecast TX · Resets to sale price
- Current annual tax
- $3,854 · $321/mo
- Projected year-2 tax
- $3,854 · $321/mo
- Expected delta
- $0/yr ($0/mo · 0.0%)
ⓘ Screening estimate from a state-policy table — verify with the county assessor before closing.
Climate risk First Street
- Flood 1/10 Low FEMA zone X (unshaded) · 0% chance over 30 yrs
- Wildfire 1/10 Low
- Heat 8/10 Severe 7 d/yr ≥108°F today · 21 d/yr by 30 yrs out
- Wind 8/10 Severe 80% chance of damaging wind over 30 yrs
- Air quality 2/10 Low 1 unhealthy d/yr today · 2 by 30 yrs out
Nearby sold comps map
Loading sold comps map…
Walkable amenities ~0.75 mi
Loading nearby amenities…
Taxation est. · year 1
- Rental income
- $16,244
- − Mortgage interest
- −$4,826
- − Property taxes
- −$3,854
- − Insurance
- −$431
- − Repairs & maintenance
- −$1,299
- − Management
- −$1,299
- − Depreciation
- −$2,506
- Taxable income
- $2,028
- Est. tax owed @ 24.0%
- −$487
- After-tax cash flow
- $2,639/yr
For passive investors: Depreciation is non-cash, so a rental often shows a tax loss while cash-flowing — sheltering income. Rental losses are passive: they offset passive income freely, and up to $25,000/yr can offset ordinary (W-2) income if you actively participate and your MAGI is under $100k (phasing out to $0 by $150k); unused losses carry forward. On sale, claimed depreciation is recaptured at up to 25%, and gains may owe capital-gains tax (a 1031 exchange can defer both). Figures are a year-1 estimate at your 24.0% rate — not tax advice; consult a CPA.
Schools (NCES district)
- District
- San Antonio ISD
- NCES district ID
- 4838730
- Math proficiency
- 12% ▼ -21.00%
- Reading proficiency
- 22% ▼ -7.00%
- Median HH income
- $30,952
- Composite
- 13.57/100
- National rank
- #9512
- State rank
- #805 of 826 in TX
Livability — San Antonio
- Score
- 80/100
- State rank
- #31
- US rank
- #1616
Category grades
Schools grade is shown separately in the Schools card above.
Census & demographics
- Census place
- San Antonio, TX
- County
- Bexar County · 1,990,555 people
- City population
- 1,806,925
- Metro
- San Antonio-New Braunfels, TX
- Population (ZIP)
- 13,104
- Household income
- $46,955
- Rent vs Own
- Severe rent burden
- 381.0
Population outlook (Bexar County) Hauer SSP2
- Today (2025)
- 2,336,851 people
- By 2030
- 2,560,728 · +9.6%
- By 2040
- 3,020,569 · +29.3%
- By 2050
- 3,493,522 · +49.5%
- By 2075
- 4,668,459 · +99.8%
- By 2100
- 5,533,242 · +136.8%
Race, ethnicity, and origin ACS 2023
- Neighborhood character
- Predominantly Hispanic (91%)
- Race & ethnicity
- Hispanic / Latino 91% Two or more races 41% White 5% Black 4% Native American 3%
- Hispanic origin (detail)
- Mexican 85%
- Foreign-born
- 13% · Canada
- Languages at home
- 35% English-only · Spanish 65%
Political lean MEDSL · Bexar
- 2024 margin
- Lean D (+9.8) · D 54.3% · R 44.6% · Other 1.1%
- 2008→2024 swing
- +4.2pp toward D · 2008: 5.6pp · 2024: 9.8pp
- All cycles
- 2024: D+9.8 2020: D+18.2 2016: D+13.5 2012: D+4.6 2008: D+5.6
Not yet ingested
- Civics
- —
Market trends
- HPI YoY
- ▲ 3.81%
- Current HPI
- 264.2018
- Rent YoY
- —
- Metro
- San Antonio-New Braunfels, TX
- State GDP YoY
- ▲ 3.95%
- F500 in state
- 110
Industry mix (Fortune 500 HQ in TX)
| Industry | F500 HQs | Revenue |
|---|---|---|
| Energy | 16 | $1,198B |
|
||
| Technology | 5 | $198B |
|
||
| Engineering / Construction | 4 | $72B |
|
||
| Energy Services | 3 | $60B |
|
||
| Utilities | 3 | $41B |
|
||
| Healthcare | 2 | $330B |
|
||
Price history
-8.0% since first listed2 events — show timeline
- 2026-04-23 Price Changed $86,150 LERA
- 2026-03-26 Listed $93,600 LERA
Property tax history
+6.0%/yrLatest (2025): $3,854 · +10.0% YoY. Source: county tax records.
Cash-flow waterfall
monthlySold comps — $/sqft
last 12 mo · ≤1 miLoading sold comps…