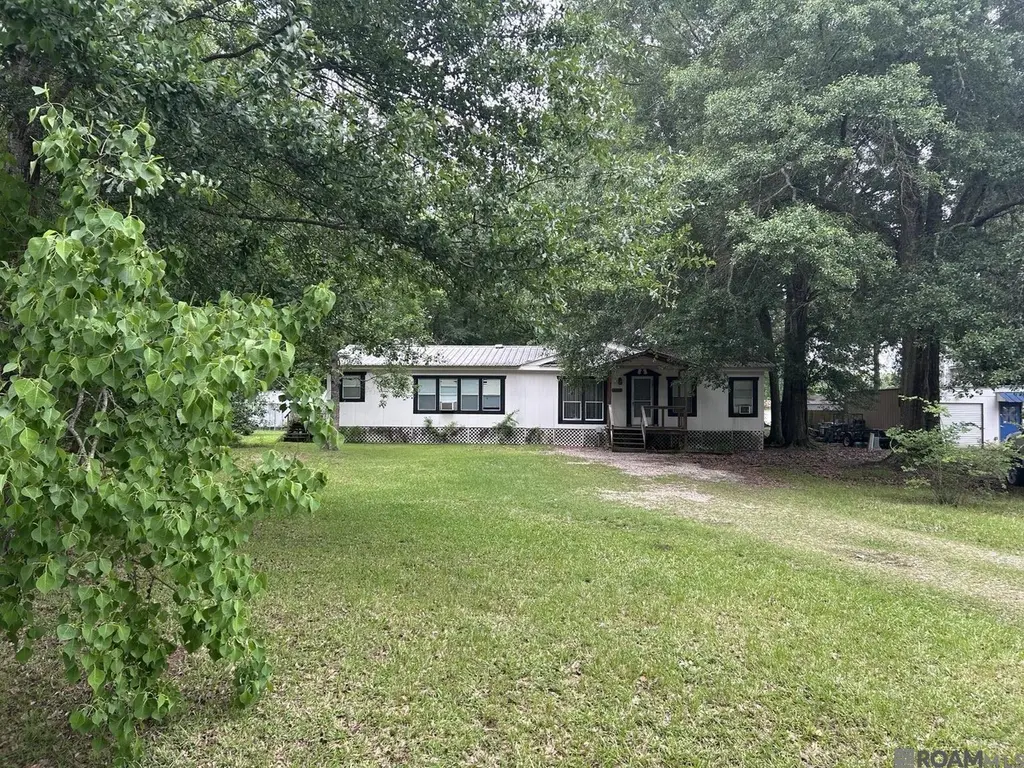
14833 Lockridge Ave · Central, LA
Flood risk 1/10 · Minimal
- FEMA flood zone
- AE
- Chance of flooding over 30 yrs
- 0.0%
- Est. flood insurance / yr
- $1,737 – $8,500
Fire risk 2/10 · Minimal
- Est. fire insurance / yr
- $1,269 – $2,357
Heat risk 8/10 · Major
- Hot days now (above 108°F)
- 7 days/yr
- Hot days in 30 yrs
- 20 days/yr
Wind risk 9/10 · Severe
- Chance of severe wind over 30 yrs
- 99.0%
Air-quality risk 3/10 · Minor
- Unhealthy air days now
- 2 days/yr
- Unhealthy air days in 30 yrs
- 3 days/yr
Risk factors via First Street. Map © Google.
Why this score? — see what drove the B+ grade
The composite is a weighted blend of 9 inputs, each scored 0–100. Each bar is that input's sub-score; the figure is the points it added to the 100-point composite (weight × sub-score).
- Cash flow +30.0/30.0
- ARV discount +15.0/15.0
- 1% rule +10.0/10.0
- DSCR +10.0/10.0
- Schools +4.6/10.0
- Livability +3.7/5.0
- Rent growth +2.5/5.0
- Condition / age +2.5/5.0
- Appreciation +0.0/10.0
$99,900
🖨 Deal sheet 📄 Offer letter ✓ Due diligence
Listing remarks MLS
*Attention Investors* FLOORING HAS BEEN REPAIRED!! Nestled away in the quaint and quiet Crystal Place Subdivision, this 3 bed 2 bath home is waiting for the right buyer to make it their own! On almost half an acre and within Central Public School district this is a fantastic investment opportunity! The master bedroom is equipped with it's own ensuite bathroom featuring a separate shower, garden tub, and walk in closet. The livingroom, kitchen, and dining area are open concept making entertaining a breeze! Other bonuses include a large walk in pantry and over sized laundry/ utility room. Storage is certainly not an issue here! Schedule your showing today! (The seller has had a contractor repair all soft areas in flooring)
Key facts
- Open concept
- Ensuite bathroom
- Walk in pantry
Tags
Property features AI
Finance
- Other:
- Financial info:
- HOA & community:
Exterior
- Parking: Driveway with open parking
- Security:
- Utilities: Public water; Public sewer
- Home design: Manufactured home; Residential property; Located in the Crystal Place subdivision; Directions: Denham Road to East Beaver Drive; right on N Lockridge Ave. Property is on the right
- Construction: Wood siding; Pillar/post/pier foundation; Built as a manufactured home
- Exterior features: Driveway; Open parking
Interior
- Kitchen:
- Bedrooms:
- Flooring:
- Bathrooms: 2 full bathrooms
- Heating & cooling: Central heating; Central air conditioning
- Interior features: Walk-in closets
- Laundry & utility:
Neighborhood map
What this means for you Summary
Snapshot
- This is a 3-bed/2.0-bath single-family listed at $100k.
Deal economics
- At list price, monthly cash flow is $278 ($3k/yr) — positive.
- The deal already cash-flows at list — no discount required.
- Meets the 1% rule at list price ($2k rent vs $100k).
- Recommended offer: $97k (3.0% below list) — sets the bar for market timing.
- Cap rate 14.8% vs local median 3.3% in Central — top-decile yield for the area; either an underpriced asset or a hidden risk that comps aren't pricing in. Stress-test before assuming the spread holds.
Location & tenants
- Location reads 74/100 on livability (#25 in LA, #4,761 nationally) — a middle-class / working-renter tenant base. Strengths: schools A+, employment A+, housing A+; Watch: amenities F, commute F.
- Central Community School District (suburban): math 50% / reading 54% proficiency, ranked #9 of 98 in LA (top 9%) — acceptable for families but not a draw, mixed tenant base, ~2y average lease.
- Market conditions: 38 active listings in the ZIP; 1 comparable units currently listed for rent nearby; 2,252 units permitted in East Baton Rouge Parish in 2024 (440 in 5+ unit buildings).
Forward outlook
- Local home prices are declining (-3.0%/yr); year-one equity from $691 of loan paydown is wiped out by about $3k of value loss. Plan a longer hold.
- East Baton Rouge County population projected at +4% by 2050 — modest demand growth; plan on rents tracking national, not racing it.
- At projected returns (-3.0% appreciation + 3.0% rent growth), your $28k cash investment doubles in ~10 years — after that, you're playing with house money.
Negotiation context
- It's been on market 36 days — a 3% lower offer ($97k) is reasonable based on typical stale-listing flexibility.
- 7 sale attempts since 19y ago with the ask held roughly flat each time — persistent listings suggest the price (not the market) is what's stuck; bring a comps-based counter.
- Current owner paid $60k; list at $100k implies a 66% gain — meaningful room to come down on a strong offer.
Risks & watch-outs
- Watch-outs: flood insurance adds $427/mo.
- Climate carrying-cost: in FEMA flood zone AE (mandatory federal flood insurance); severe wind risk, 99% chance of damaging wind over 30y; extreme-heat days projected 7→20/yr by 2055 (HVAC capex compounding) — expect insurance premiums to compound above CPI over the hold.
Questions for the listing agent
- It's been on market 36 days. Have you received any prior offers? Is the seller open to a 3% concession, seller financing, or rate buy-down credit?
- What's the actual annual flood-insurance premium (NFIP or private), and is the property in a SFHA with mandatory coverage?
- Is there a deadline driving the sale (1031 exchange, divorce, estate, relocation)? That informs how much negotiation room exists.
- Schools are A-rated — typically a magnet for longer-tenancy family renters. What's the average tenant stay here, and is there a school-zone premium baked into asking?
- What's the average days-on-market for RENTAL listings here right now (not sales)? A rising rental-DOM trend means longer vacancies and softer asking-rent achievability than the comps imply.
- What's the recent tenant-quality profile in this submarket — average credit score on applications, eviction rate, late-payment / NSF rate, and stable-employment percentage? A property-management company in the area should have these aggregated.
- How much new for-sale + rental construction is in the pipeline within 1–3 miles? Heavy new supply typically softens prices + rents 12–24 months out; constrained supply supports both.
Investment metrics
- 1% rule
- 1.70% ✓
- Cap rate
- 14.75%
- Cash-on-cash
- 30.21%
- DSCR
- 2.34
- GRM
- 4.9
CMA / ARV
- ARV (median comp)
- $150,000
- List price
- $99,900
- Delta
- -33.40%
- Verdict
- UNDERPRICED
- Comps
- 3 within 1.0 mi
Show comp detail 12 sales within ~0.75 mi
| Address | Dist | Beds/Ba | Sqft | Sold | Price | $/sf | Match |
|---|---|---|---|---|---|---|---|
| 14707 Hampshire Dr | 0.38mi | 3/2.0 | 1,636 (-3%) | 7mo | $227,000 | $139 | 72 |
| 15038 Crystal Dr | 0.20mi | 3/2.0 | 1,750 (+4%) | 15mo | $199,999 | $114 | 72 |
| 14233 Haverhill Ave | 0.37mi | 3/2.0 | 1,660 (-1%) | 17mo | $279,500 | $168 | 66 |
| 14326 Winslow Dr | 0.35mi | 3/2.0 | 1,789 (+6%) | 11mo | $270,000 | $151 | 64 |
| 14224 Haverhill Ave | 0.41mi | 3/2.0 | 1,530 (-9%) | 10mo | $170,000 | $111 | 58 |
| 14203 Haverhill Ave | 0.41mi | 4/2.0 (+1) | 1,850 (+10%) | 2mo | $284,500 | $154 | 58 |
| 14913 Crystal Dr | 0.24mi | 3/2.0 | 1,925 (+15%) | 8mo | $240,000 | $125 | 58 |
| 14334 Crystal Dr | 0.67mi | 3/2.0 | 1,626 (-3%) | 10mo | $209,900 | $129 | 55 |
| 15117 Wilmington Dr | 0.47mi | 3/2.0 | 1,810 (+8%) | 15mo | $249,999 | $138 | 52 |
| 14102 Haverhill Ave | 0.47mi | 3/2.0 | 1,860 (+11%) | 12mo | $249,900 | $134 | 51 |
| 15259 Denham Rd | 0.37mi | 3/2.0 | 1,917 (+14%) | 16mo | $294,900 | $154 | 46 |
| 14014 Denham Rd | 0.53mi | 3/2.0 | 1,902 (+13%) | 17mo | $340,000 | $179 | 39 |
Match score weights: distance 35% · size 25% · config 20% · recency 20%. Top-matched comps best support the ARV.
Projected returns pro-forma
-3.0% appreciation · 3.0% rent growth · sell at horizon
- IRR
- 1.6%
- Equity multiple
- 1.06×
- Total profit
- $1,749
- Equity at exit
- $14,895
- IRR
- 11.4%
- Equity multiple
- 1.91×
- Total profit
- $25,332
- Equity at exit
- $8,638
Cash invested: $27,972 (down + closing). Projections, not guarantees.
Landlord ↔ Tenant lean methodology
- Overall (STATE)
- 90 Strongly Landlord-Friendly
- State Louisiana
- 90 Strongly Landlord-Friendly · R+12
- County
- — inherits STATE
- City
- — inherits STATE
ZIP-level market 70770
- Home prices YoY
- -30.8%
- Active inventory
- 38
- Price-to-rent
- 4.9×
Monthly cashflow live
- Estimated rent
- $1,700 medium interval (Pro) →
- Mortgage (P&I)
- −$524
- Tax from tax record
- −$73 /mo · $880/yr
- Insurance
- −$42
- Flood insurance flood zone
- −$427 /mo · $5,118/yr
- HOA
- −$0
- Vacancy / Maint / Mgmt
- −$357
- Net cashflow
- $278
Break-even live
UW: 25.0% down · 7.5% · 30yr · 1.5% tax · 5.0% vac · 8.0% maint · 8.0% mgmt
Financing live
Cash to close
- Down payment
- $24,975
- Closing costs
- $2,997
- Reserves months
- —
- Total cash needed
- —
Loan-product check · same deal, 3 products live
Conventional
25% down · 7.5% · 30yr
- Down + closing
- —
- Monthly P&I
- —
- Monthly cashflow
- —
- DSCR
- —
- Eligible?
- —
Personal DTI + credit; lowest rate.
DSCR
20% down · 8.5% · 30yr
- Down + closing
- —
- Monthly P&I
- —
- Monthly cashflow
- —
- DSCR
- —
- Eligible?
- —
No personal income docs; deal must DSCR.
Hard money
10% down · 12.0% · 12mo
- Down + closing
- —
- Monthly P&I
- —
- Monthly cashflow
- —
- DSCR
- —
- Eligible?
- —
Short-term bridge; refi at stabilization.
Rent comps 1 comps
| Address | Beds | Baths | Sqft | Rent | $/sqft | DOM | Units | Dist |
|---|---|---|---|---|---|---|---|---|
| 12985 Slope Oak Ave Baton Rouge, LA | 3.0 | 2.0 | 1334 | $1,700 | $1.27 | 43d | 1 | 1.26mi |
Listing history 29 events
-
2026-06-18days on market $99,900 Active 36 DOM
-
2026-06-17days on market $99,900 Active 35 DOM
-
2026-06-16days on market $99,900 Active 34 DOM
-
2026-06-15days on market $99,900 Active 33 DOM
-
2026-06-14days on market $99,900 Active 31 DOM
-
2026-06-10days on market $99,900 Active 28 DOM
-
2026-06-09days on market $99,900 Active 27 DOM
-
2026-06-08days on market $99,900 Active 26 DOM
-
2026-06-07days on market $99,900 Active 25 DOM
-
2026-06-05days on market $99,900 Active 22 DOM
-
2026-06-03days on market $99,900 Active 21 DOM
-
2026-06-02days on market $99,900 Active 20 DOM
-
2026-06-01days on market $99,900 Active 19 DOM
-
2026-05-31days on market $99,900 Active 18 DOM
-
2026-05-31days on market $99,900 Active 17 DOM
-
2026-05-11$99,900 Active 776-char remark
Show marketing remark (730 chars)
*Attention Investors* FLOORING HAS BEEN REPAIRED!! Nestled away in the quaint and quiet Crystal Place Subdivision, this 3 bed 2 bath home is waiting for the right buyer to make it their own! On almost half an acre and within Central Public School district this is a fantastic investment opportunity! The master bedroom is equipped with it's own ensuite bathroom featuring a separate shower, garden tub, and walk in closet. The livingroom, kitchen, and dining area are open concept making entertaining a breeze! Other bonuses include a large walk in pantry and over sized laundry/ utility room. Storage is certainly not an issue here! Schedule your showing today! (The seller has had a contractor repair all soft areas in flooring)
-
2026-05-11$99,900 Active 781-char remark
Show marketing remark (730 chars)
*Attention Investors* FLOORING HAS BEEN REPAIRED!! Nestled away in the quaint and quiet Crystal Place Subdivision, this 3 bed 2 bath home is waiting for the right buyer to make it their own! On almost half an acre and within Central Public School district this is a fantastic investment opportunity! The master bedroom is equipped with it's own ensuite bathroom featuring a separate shower, garden tub, and walk in closet. The livingroom, kitchen, and dining area are open concept making entertaining a breeze! Other bonuses include a large walk in pantry and over sized laundry/ utility room. Storage is certainly not an issue here! Schedule your showing today! (The seller has had a contractor repair all soft areas in flooring)
-
2015-12-18soldstatus Sold
-
2015-12-18soldstatus $60,000
-
2015-12-08status Pending
-
2015-10-15price $69,900
-
2015-10-14status Active
-
2015-10-03historical
-
2015-06-03$87,900 Active
-
2015-04-02$69,900
-
2008-07-02soldstatus $89,000
-
2007-03-23$99,000
-
2007-03-23$99,000
-
1985-06-14soldstatus
ⓘ Source: listings_history table (triggers on properties + properties_extension) + one-shot
backfill from property_details.listing_events for pre-trigger history.
Tax reassessment forecast LA · Resets to sale price
- Current annual tax
- $880 · $73/mo
- Projected year-2 tax
- $880 · $73/mo
- Expected delta
- $0/yr ($0/mo · 0.0%)
ⓘ Screening estimate from a state-policy table — verify with the county assessor before closing.
Climate risk First Street
- Flood 1/10 Low FEMA zone AE · 0% chance over 30 yrs
- Wildfire 2/10 Low
- Heat 8/10 Severe 7 d/yr ≥108°F today · 20 d/yr by 30 yrs out
- Wind 9/10 Extreme 99% chance of damaging wind over 30 yrs
- Air quality 3/10 Moderate 2 unhealthy d/yr today · 3 by 30 yrs out
Nearby sold comps map
Loading sold comps map…
Walkable amenities ~0.75 mi
Loading nearby amenities…
Taxation est. · year 1
- Rental income
- $20,400
- − Mortgage interest
- −$5,596
- − Property taxes
- −$880
- − Insurance
- −$5,618
- − Repairs & maintenance
- −$1,632
- − Management
- −$1,632
- − Depreciation
- −$2,906
- Taxable income
- $2,136
- Est. tax owed @ 24.0%
- −$513
- After-tax cash flow
- $2,819/yr
For passive investors: Depreciation is non-cash, so a rental often shows a tax loss while cash-flowing — sheltering income. Rental losses are passive: they offset passive income freely, and up to $25,000/yr can offset ordinary (W-2) income if you actively participate and your MAGI is under $100k (phasing out to $0 by $150k); unused losses carry forward. On sale, claimed depreciation is recaptured at up to 25%, and gains may owe capital-gains tax (a 1031 exchange can defer both). Figures are a year-1 estimate at your 24.0% rate — not tax advice; consult a CPA.
Schools (NCES district)
- District
- Central Community School District
- NCES district ID
- 2200125
- Math proficiency
- 50% ▼ -32.00%
- Reading proficiency
- 54% ▼ -31.00%
- Median HH income
- $66,584
- Composite
- 46.02/100
- National rank
- #2528
- State rank
- #9 of 98 in LA
Livability — Central
- Score
- 74/100
- State rank
- #25
- US rank
- #4761
Category grades
Schools grade is shown separately in the Schools card above.
Census & demographics
- Census place
- Central, LA
- City population
- 10,403
- Population (ZIP)
- 3,279
Population outlook (East Baton Rouge County) Hauer SSP2
- Today (2025)
- 464,810 people
- By 2030
- 472,137 · +1.6%
- By 2040
- 480,243 · +3.3%
- By 2050
- 484,422 · +4.2%
- By 2075
- 492,069 · +5.9%
- By 2100
- 476,347 · +2.5%
Race, ethnicity, and origin ACS 2023
- Neighborhood character
- Predominantly White (89%)
- Race & ethnicity
- White 89% Hispanic / Latino 8% Two or more races 6% Black 2%
- Hispanic origin (detail)
- Mexican 7%
- Common ancestry
- Lithuanian 13% Iranian 2% Italian 2%
- Foreign-born
- 3% · Canada
- Languages at home
- 98% English-only · Spanish 1% French/Haitian/Cajun 1%
Political lean MEDSL · East Baton Rouge
- 2024 margin
- D (+11.1) · D 54.5% · R 43.4% · Other 2.1%
- 2008→2024 swing
- +8.9pp toward D · 2008: 2.2pp · 2024: 11.1pp
- All cycles
- 2024: D+11.1 2020: D+13.1 2016: D+9.2 2012: D+5.2 2008: D+2.2
Not yet ingested
- Civics
- —
Market trends
- HPI YoY
- ▼ -83.70%
- Current HPI
- 187.8011
- Rent YoY
- —
- Metro
- —
- State GDP YoY
- ▲ 3.29%
- F500 in state
- 10
Industry mix (Fortune 500 HQ in LA)
| Industry | F500 HQs | Revenue |
|---|---|---|
| Telecommunications | 2 | $23B |
|
||
| Utilities | 1 | $12B |
|
||
| Wholesale / Distribution | 1 | $5B |
|
||
| Advertising | 1 | $2B |
|
||
Price history
+0.9% since first listed14 events — show timeline
- 2026-05-11 Listed $99,900 GBRMLS
- 2026-05-11 Listed $99,900 AcadianaMLS
- 2015-12-18 Sold (Public Records) $60,000 Public Records
- 2015-12-18 Sold (MLS) — GBRMLS
- 2015-12-08 Pending — GBRMLS
- 2015-10-15 Price Changed $69,900 GBRMLS
- 2015-10-14 Relisted — GBRMLS
- 2015-10-03 Delisted — GBRMLS
- 2015-06-03 Listed $87,900 GBRMLS
- 2015-04-02 Listed $69,900 AcadianaMLS
- 2008-07-02 Sold (Public Records) $89,000 Public Records
- 2007-03-23 Listed $99,000 AcadianaMLS
- 2007-03-23 Listed $99,000 GBRMLS
- 1985-06-14 Sold (Public Records) — Public Records
Property tax history
+14.0%/yrLatest (2025): $880 · -0.4% YoY. Source: county tax records.
Cash-flow waterfall
monthlySold comps — $/sqft
last 12 mo · ≤1 miLoading sold comps…