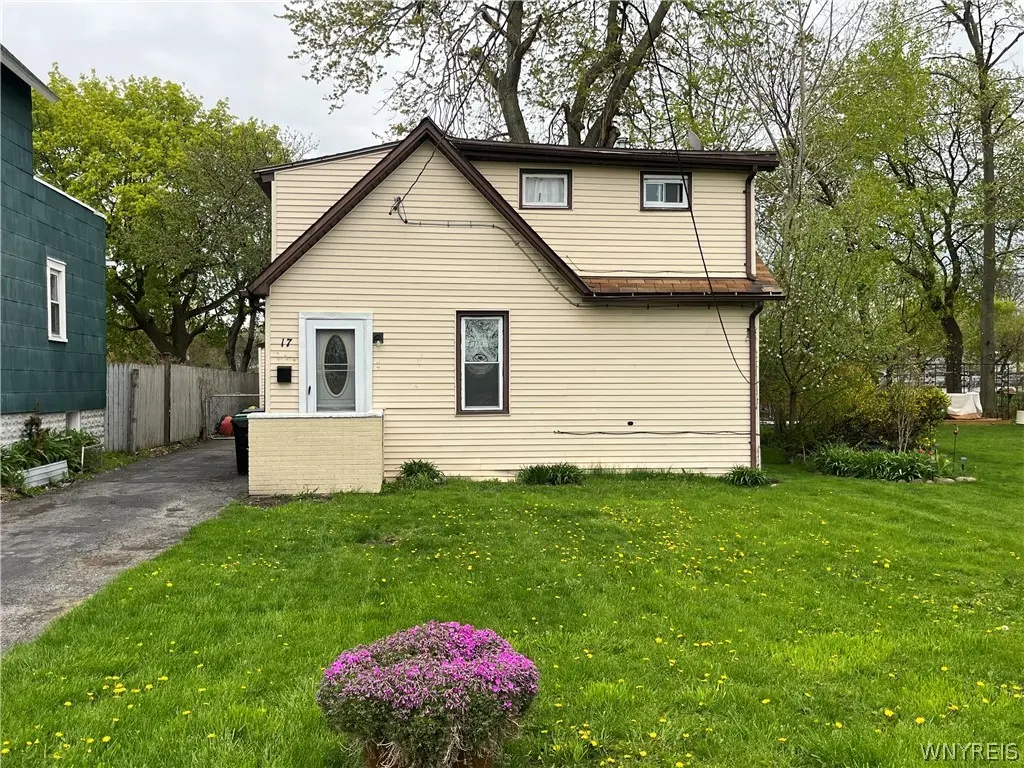
17 Edith St · Tonawanda, NY
Flood risk 4/10 · Minor
- FEMA flood zone
- X (unshaded)
- Chance of flooding over 30 yrs
- 0.24%
- Est. flood insurance / yr
- $507 – $1,088
Fire risk 1/10 · Minimal
- Est. fire insurance / yr
- $691 – $1,283
Heat risk 2/10 · Minimal
- Hot days now (above 93°F)
- 7 days/yr
- Hot days in 30 yrs
- 15 days/yr
Wind risk 1/10 · Minimal
- Chance of severe wind over 30 yrs
- —
Air-quality risk 3/10 · Minor
- Unhealthy air days now
- 3 days/yr
- Unhealthy air days in 30 yrs
- 4 days/yr
Risk factors via First Street. Map © Google.
Why this score? — see what drove the C+ grade
The composite is a weighted blend of 9 inputs, each scored 0–100. Each bar is that input's sub-score; the figure is the points it added to the 100-point composite (weight × sub-score).
- Cash flow +19.3/30.0
- ARV discount +15.0/15.0
- DSCR +6.1/10.0
- 1% rule +5.3/10.0
- Livability +4.5/5.0
- Rent growth +4.2/5.0
- Schools +3.5/10.0
- Condition / age +2.5/5.0
- Appreciation +0.0/10.0
$164,900
🖨 Deal sheet 📄 Offer letter ✓ Due diligence
Listing remarks
Charming three-bedroom two-bath home tucked away on a quiet dead-end street in the City of Tonawanda. Additional room can be used as a fourth bedroom. ALL kitchen appliances included as well as washer & dryer. This well located property offers both privacy and convenience with minimal thru traffic and a peaceful neighborhood setting--perfect for comfortable everyday living. Close to local amenities and shopping. Property being sold as-is. OPEN HOUSE this Saturday 5/2 from 1-3pm.
Key facts
- 4,800 sq ft lot
- 2 garage spots
- Built 1920
Property features AI
Finance
- HOA & community: Trails/paths nearby
Exterior
- Parking: Detached garage; 2-car garage
- Utilities: Electricity connected; Public water connected; Sewer connected
- Home design: Two-story home; Existing (resale) property
- Construction: Aluminum siding; Vinyl siding; Asphalt roof
- Exterior features: Blacktop driveway; Fully fenced yard; Rectangular residential lot; City street frontage; Lot dimensions approximately 40 x 120
Interior
- Kitchen: Gas cooktop; Gas oven; Gas range; Eat-in kitchen
- Bedrooms: One bedroom on the main level
- Flooring: Laminate; Vinyl; Varies
- Bathrooms: Two full bathrooms; One bathroom on the main level
- Heating & cooling: Baseboard heating; Hot water heating; Heating present (see remarks)
- Interior features: Ceiling fan(s); Eat-in kitchen; Separate/formal living room; Convertible bedroom
- Laundry & utility: Main level laundry
Neighborhood map
What this means for you Summary
Snapshot
- This is a 3-bed/2.0-bath single-family listed at $165k.
Deal economics
- At list price, monthly cash flow is $182 ($2k/yr) — positive.
- The deal already cash-flows at list — no discount required.
- Meets the 1% rule at list price ($2k rent vs $165k).
- Recommended offer: $160k (3.0% below list) — sets the bar for market timing.
Location & tenants
- Location reads 89/100 on livability (#8 in NY, #169 nationally) — a professional / high-income tenant draw. Strengths: amenities A+, commute A+, cost of living A+.
- Tonawanda City School District (suburban): math 39% / reading 43% proficiency, ranked #508 of 590 in NY (top 86%) — families likely to look elsewhere, expect single-tenant / working-renter base with shorter leases.
- Market conditions: Rents rising fast (+6.8%/yr); 191 active listings in the ZIP; 7 comparable units currently listed for rent nearby; rentals leasing fast (median 2d on market — plan ~1-2 weeks tenant-placement turnaround); 1,244 units permitted in Erie County in 2024 (563 in 5+ unit buildings).
Forward outlook
- Local home prices are declining (-3.0%/yr); year-one equity from $1k of loan paydown is wiped out by about $5k of value loss. Plan a longer hold.
- At projected returns (-3.0% appreciation + 6.8% rent growth), your $46k cash investment doubles in ~10 years — after that, you're playing with house money.
Negotiation context
- It's been on market 49 days — a 3% lower offer ($160k) is reasonable based on typical stale-listing flexibility.
Risks & watch-outs
- Watch-outs: built in 1920 — expect roof / HVAC / electrical / plumbing capex.
Questions for the listing agent
- It's been on market 49 days. Have you received any prior offers? Is the seller open to a 3% concession, seller financing, or rate buy-down credit?
- Built in 1920 — when were the roof, HVAC, electrical panel, plumbing, and water heater last replaced?
- Is there a deadline driving the sale (1031 exchange, divorce, estate, relocation)? That informs how much negotiation room exists.
- Schools are B-rated — typically a magnet for longer-tenancy family renters. What's the average tenant stay here, and is there a school-zone premium baked into asking?
- What's the average days-on-market for RENTAL listings here right now (not sales)? A rising rental-DOM trend means longer vacancies and softer asking-rent achievability than the comps imply.
- What's the recent tenant-quality profile in this submarket — average credit score on applications, eviction rate, late-payment / NSF rate, and stable-employment percentage? A property-management company in the area should have these aggregated.
- How much new for-sale + rental construction is in the pipeline within 1–3 miles? Heavy new supply typically softens prices + rents 12–24 months out; constrained supply supports both.
Investment metrics
- 1% rule
- 1.03% ✓
- Cap rate
- 7.62%
- Cash-on-cash
- 4.72%
- DSCR
- 1.21
- GRM
- 8.1
CMA / ARV
- ARV (median comp)
- $292,342
- List price
- $164,900
- Delta
- -43.59%
- Verdict
- UNDERPRICED
- Comps
- 20 within 1.0 mi
Show comp detail 9 sales within ~0.75 mi
| Address | Dist | Beds/Ba | Sqft | Sold | Price | $/sf | Match |
|---|---|---|---|---|---|---|---|
| 180 Lorelee Dr | 0.60mi | 3/1.5 | 1,482 (+2%) | 0mo | $350,000 | $236 | 67 |
| 40 Dale Dr | 0.75mi | 3/3.0 | 1,552 (+6%) | 3mo | $295,000 | $190 | 48 |
| 161 Raintree Pkwy | 0.59mi | 3/1.5 | 1,530 (+5%) | 20mo | $361,750 | $236 | 46 |
| 166 Dale Dr | 0.69mi | 4/1.5 (+1) | 1,454 (-0%) | 24mo | $292,000 | $201 | 40 |
| 30 Lorelee Dr | 0.63mi | 4/1.0 (+1) | 1,533 (+5%) | 17mo | $181,030 | $118 | 39 |
| 105 Dale Dr | 0.74mi | 4/2.0 (+1) | 1,440 (-1%) | 24mo | $255,000 | $177 | 39 |
| 604 Ellicott Creek Rd | 0.70mi | 3/2.0 | 1,550 (+6%) | 23mo | $350,000 | $226 | 38 |
| 2778 Colvin Blvd | 0.75mi | 3/1.5 | 1,368 (-6%) | 21mo | $310,000 | $227 | 35 |
| 45 Marlee Dr | 0.68mi | 3/1.5 | 1,248 (-14%) | 11mo | $305,000 | $244 | 33 |
Match score weights: distance 35% · size 25% · config 20% · recency 20%. Top-matched comps best support the ARV.
Projected returns pro-forma
-3.0% appreciation · 6.75% rent growth · sell at horizon
- IRR
- -4.7%
- Equity multiple
- 0.82×
- Total profit
- $-8,462
- Equity at exit
- $24,587
- IRR
- 8.9%
- Equity multiple
- 1.80×
- Total profit
- $37,142
- Equity at exit
- $14,258
Cash invested: $46,172 (down + closing). Projections, not guarantees.
Landlord ↔ Tenant lean methodology
- Overall (STATE)
- 15 Strongly Tenant-Friendly
- State New York
- 15 Strongly Tenant-Friendly · D+10
- County
- — inherits STATE
- City
- — inherits STATE
ZIP-level market 14150
- Rents YoY
- 6.8%
- Active inventory
- 191
- Price-to-rent
- 8.1×
Monthly cashflow live
- Estimated rent
- $1,697 high interval (Pro) →
- Mortgage (P&I)
- −$865
- Tax from tax record
- −$225 /mo · $2,702/yr
- Insurance
- −$69
- HOA
- −$0
- Vacancy / Maint / Mgmt
- −$356
- Net cashflow
- $182
Break-even live
UW: 25.0% down · 7.5% · 30yr · 1.5% tax · 5.0% vac · 8.0% maint · 8.0% mgmt
Financing live
Cash to close
- Down payment
- $41,225
- Closing costs
- $4,947
- Reserves months
- —
- Total cash needed
- —
Loan-product check · same deal, 3 products live
Conventional
25% down · 7.5% · 30yr
- Down + closing
- —
- Monthly P&I
- —
- Monthly cashflow
- —
- DSCR
- —
- Eligible?
- —
Personal DTI + credit; lowest rate.
DSCR
20% down · 8.5% · 30yr
- Down + closing
- —
- Monthly P&I
- —
- Monthly cashflow
- —
- DSCR
- —
- Eligible?
- —
No personal income docs; deal must DSCR.
Hard money
10% down · 12.0% · 12mo
- Down + closing
- —
- Monthly P&I
- —
- Monthly cashflow
- —
- DSCR
- —
- Eligible?
- —
Short-term bridge; refi at stabilization.
Rent comps 7 comps
| Address | Beds | Baths | Sqft | Rent | $/sqft | DOM | Units | Dist |
|---|---|---|---|---|---|---|---|---|
| 86 Scott St Tonawanda, NY | 2.0 | 1.0 | 1584 | $1,450 | $0.92 | 2d | 1 | 0.66mi |
| 330 E Niagara St Tonawanda, NY | 1.0–2.0 | 1.0–2.0 | 975 | $1,900 | $1.95 | 2d | 1 | 0.76mi |
| 103 Raintree Is Tonawanda, NY | 1.0–2.0 | 1.0 | 700 | $1,800 | $2.57 | 2d | 35 | 0.91mi |
| 184 Sweeney St North Tonawanda, NY | 2.0 | 2.0 | 1155 | $2,000 | $1.73 | 2d | 1 | 1.04mi |
| 53 Winkler Dr Tonawanda, NY | 3.0 | 1.0 | 1060 | $2,100 | $1.98 | 12d | 1 | 1.04mi |
| 166 Spruce St Unit 5 North Tonawanda, NY | 2.0 | 1.0 | 1000 | $1,300 | $1.30 | 24d | 1 | 1.14mi |
| 115 Klinger Ave Tonawanda, NY | 3.0 | 1.0 | 1200 | $1,450 | $1.21 | 3d | 1 | 1.30mi |
Listing history 17 events
-
2026-06-18days on market $164,900 Active 49 DOM
-
2026-06-17days on market $164,900 Active 48 DOM
-
2026-06-16days on market $164,900 Active 47 DOM
-
2026-06-15days on market $164,900 Active 46 DOM
-
2026-06-13days on market $164,900 Active 44 DOM
-
2026-06-13days on market $164,900 Active 43 DOM
-
2026-06-10days on market $164,900 Active 41 DOM
-
2026-06-09days on market $164,900 Active 40 DOM
-
2026-06-08days on market $164,900 Active 39 DOM
-
2026-06-07days on market $164,900 Active 38 DOM
-
2026-06-05days on market $164,900 Active 35 DOM
-
2026-06-03days on market $164,900 Active 34 DOM
-
2026-06-02days on market $164,900 Active 33 DOM
-
2026-06-01days on market $164,900 Active 32 DOM
-
2026-05-31days on market $164,900 Active 31 DOM
-
2026-05-13price $164,900 489-char remark
-
2026-04-30$174,900 Active 489-char remark
ⓘ Source: listings_history table (triggers on properties + properties_extension) + one-shot
backfill from property_details.listing_events for pre-trigger history.
Tax reassessment forecast NY · Partial reset (capped growth)
- Current annual tax
- $2,702 · $225/mo
- Projected year-2 tax
- $2,744 · $229/mo
- Expected delta
- +$42/yr (+$4/mo · 1.6%)
ⓘ Screening estimate from a state-policy table — verify with the county assessor before closing.
Climate risk First Street
- Flood 4/10 Moderate FEMA zone X (unshaded) · 24% chance over 30 yrs
- Wildfire 1/10 Low
- Heat 2/10 Low 7 d/yr ≥93°F today · 15 d/yr by 30 yrs out
- Wind 1/10 Low
- Air quality 3/10 Moderate 3 unhealthy d/yr today · 4 by 30 yrs out
Nearby sold comps map
Loading sold comps map…
Walkable amenities ~0.75 mi
Loading nearby amenities…
Taxation est. · year 1
- Rental income
- $20,361
- − Mortgage interest
- −$9,237
- − Property taxes
- −$2,702
- − Insurance
- −$824
- − Repairs & maintenance
- −$1,629
- − Management
- −$1,629
- − Depreciation
- −$4,797
- Taxable loss
- −$457
- Est. tax savings @ 24.0%
- +$110
- After-tax cash flow
- $2,291/yr
For passive investors: Depreciation is non-cash, so a rental often shows a tax loss while cash-flowing — sheltering income. Rental losses are passive: they offset passive income freely, and up to $25,000/yr can offset ordinary (W-2) income if you actively participate and your MAGI is under $100k (phasing out to $0 by $150k); unused losses carry forward. On sale, claimed depreciation is recaptured at up to 25%, and gains may owe capital-gains tax (a 1031 exchange can defer both). Figures are a year-1 estimate at your 24.0% rate — not tax advice; consult a CPA.
Schools (NCES district)
- District
- Tonawanda City School District
- NCES district ID
- 3628740
- Math proficiency
- 39% ▼ -19.00%
- Reading proficiency
- 43% ▼ -7.00%
- Median HH income
- $47,061
- Composite
- 35.03/100
- National rank
- #5041
- State rank
- #508 of 590 in NY
Livability — Tonawanda
- Score
- 89/100
- State rank
- #8
- US rank
- #169
Category grades
Schools grade is shown separately in the Schools card above.
Census & demographics
- Census place
- Tonawanda, NY
- County
- Erie County · 714,559 people
- City population
- 41,260
- Metro
- Buffalo-Cheektowaga, NY
- Population (ZIP)
- 41,260
- Household income
- $71,406
- Rent vs Own
- Severe rent burden
- 1427.0
Population outlook (Erie County) Hauer SSP2
- Today (2025)
- 933,037 people
- By 2030
- 935,181 · +0.2%
- By 2040
- 928,531 · -0.5%
- By 2050
- 905,725 · -2.9%
- By 2075
- 834,037 · -10.6%
- By 2100
- 708,033 · -24.1%
Race, ethnicity, and origin ACS 2023
- Neighborhood character
- Predominantly White (87%)
- Race & ethnicity
- White 87% Two or more races 5% Hispanic / Latino 5% Black 4% Asian 2%
- Common ancestry
- Romanian 13% Lithuanian 3% Slovak 2%
- Foreign-born
- 6% · Canada, Philippines, Vietnam
- Languages at home
- 94% English-only · Other Indo-European 2% Spanish 1% Russian/Polish/Slavic 1%
Political lean MEDSL · Erie
- 2024 margin
- Lean D (+9.7) · D 54.8% · R 45.2%
- 2008→2024 swing
- -7.9pp toward R · 2008: 17.5pp · 2024: 9.7pp
- All cycles
- 2024: D+9.7 2020: D+14.7 2016: D+4.8 2012: D+15.6 2008: D+17.5
Not yet ingested
- Civics
- —
Market trends
- HPI YoY
- ▼ -260.43%
- Current HPI
- 334.5893
- Rent YoY
- ▲ 6.75%
- Metro
- Buffalo-Cheektowaga, NY
- State GDP YoY
- ▲ 2.60%
- F500 in state
- 92
Industry mix (Fortune 500 HQ in NY)
| Industry | F500 HQs | Revenue |
|---|---|---|
| Financial Services | 10 | $950B |
|
||
| Consumer Goods | 9 | $162B |
|
||
| Insurance | 4 | $225B |
|
||
| Telecommunications | 2 | $144B |
|
||
| Pharmaceuticals | 2 | $112B |
|
||
| Media / Entertainment | 2 | $69B |
|
||
Price history
-5.7% since first listed2 events — show timeline
- 2026-05-13 Price Changed $164,900 WNYREIS
- 2026-04-30 Listed $174,900 WNYREIS
Property tax history
+6.3%/yrLatest (2025): $2,702 · +3.4% YoY. Source: county tax records.
Cash-flow waterfall
monthlySold comps — $/sqft
last 12 mo · ≤1 miLoading sold comps…