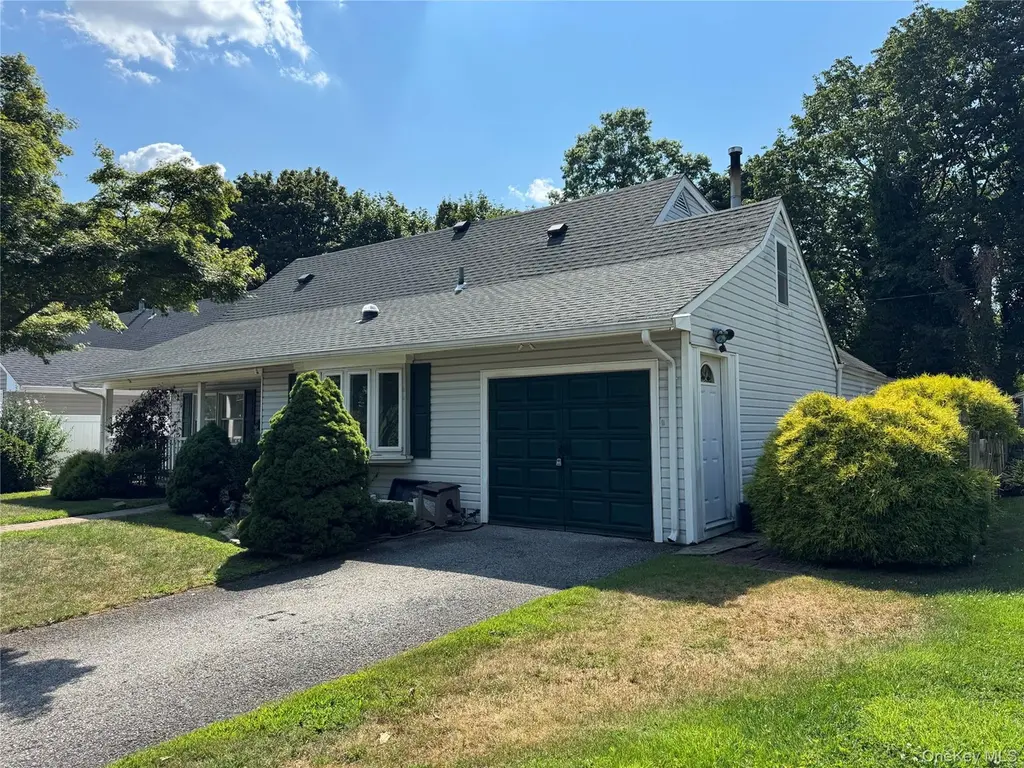
332 Jamaica Blvd · Carle Place, NY
Flood risk 1/10 · Minimal
- FEMA flood zone
- X (unshaded)
- Chance of flooding over 30 yrs
- 0.0%
- Est. flood insurance / yr
- $507 – $1,088
Fire risk 1/10 · Minimal
- Est. fire insurance / yr
- $691 – $1,283
Heat risk 6/10 · Moderate
- Hot days now (above 96°F)
- 7 days/yr
- Hot days in 30 yrs
- 16 days/yr
Wind risk 6/10 · Moderate
- Chance of severe wind over 30 yrs
- 41.0%
Air-quality risk 4/10 · Minor
- Unhealthy air days now
- 4 days/yr
- Unhealthy air days in 30 yrs
- 5 days/yr
Risk factors via First Street. Map © Google.
Why this score? — see what drove the D grade
The composite is a weighted blend of 9 inputs, each scored 0–100. Each bar is that input's sub-score; the figure is the points it added to the 100-point composite (weight × sub-score).
- ARV discount +15.0/15.0
- Cash flow +7.9/30.0
- Schools +6.4/10.0
- Livability +4.2/5.0
- 1% rule +2.5/10.0
- Rent growth +2.5/5.0
- Condition / age +2.5/5.0
- DSCR +1.9/10.0
- Appreciation +0.0/10.0
$649,000
🖨 Deal sheet (PDF) 📄 Offer letter ✓ Due diligence
Listing remarks
Opportunity knocks! This spacious 4-bedroom, 3-bathroom home is located in a desirable neighborhood, surrounded by parks, schools, and local amenities. While the property will require a full gut renovation, it offers incredible potential for the right buyer to create their dream home or a profitable investment. Whether you're an experienced renovator or looking for a project, this home is ready for transformation. Being sold as-is, but we’re happy to provide trusted handyman recommendations to help you get started. Don’t miss your chance to invest in a prime location with great upside!
Key facts
- Surrounded by parks
- Full gut renovation
- Prime location
Tags
Property features AI
Exterior
- Parking: Driveway; 1-car garage
- Utilities: Public sewer; Sewer connected
- Home design: Single-family residence
- Construction: Shingle siding construction
- Exterior features: Shingle siding; Not waterfront
Interior
- Kitchen: No appliances included
- Bedrooms: Bedroom on the first floor
- Bathrooms: Three full bathrooms
- Heating & cooling: Baseboard heating; No central cooling
- Interior features: First-floor bedroom; First-floor full bathroom; 12 total rooms
- Laundry & utility: No basement
Neighborhood map
What this means for you Summary
Snapshot
- This is a 4-bed/2.0-bath single-family listed at $649k.
Deal economics
- At list price, monthly cash flow is $-702 ($-8k/yr) — negative.
- To cash-flow at today's rent, offer at most $525k (19.1% below list).
- To meet the 1% rule (rent ≥ 1% of price), the offer needs to be $489k (24.7% below list).
- Recommended offer: $489k (24.7% below list) — sets the bar for 1% rule.
Location & tenants
- Location reads 84/100 on livability (#52 in NY, #801 nationally) — a professional / high-income tenant draw. Strengths: crime A+, amenities A+, commute A+; Watch: cost of living F.
- Carle Place Union Free School District (suburban): math 74% / reading 68% proficiency, ranked #99 of 590 in NY (top 17%) — strong family-tenant draw, lease renewals of 3-5y typical; only 12% free/reduced lunch — higher-income household profile.
- Zoned schools: Rushmore Avenue School (math 78% / reading 68%, grade A, #374 of 2,108 statewide, top 18%, 401 students, 18% FRL); Carle Place Middle Senior High School (math 68% / reading 67%, grade B, #745 of 1,100 statewide, top 68%, 598 students, 20% FRL).
- Market conditions: 15 active listings in the ZIP; 11 comparable units currently listed for rent nearby; rentals leasing fast (median 0d on market — plan ~1-2 weeks tenant-placement turnaround); 824 units permitted in Nassau County in 2024 (153 in 5+ unit buildings).
Forward outlook
- Local home prices are declining (-3.0%/yr); year-one equity from $4k of loan paydown is wiped out by about $19k of value loss. Plan a longer hold.
- Nassau County population projected at +7% by 2050 — modest demand growth; plan on rents tracking national, not racing it.
Negotiation context
- It's been on market 23 days — a 2% lower offer ($639k) is reasonable based on typical stale-listing flexibility.
- 6 sale attempts with the ask held roughly flat each time — persistent listings suggest the price (not the market) is what's stuck; bring a comps-based counter.
- Current owner paid $550k; 18% above their basis — modest negotiation headroom, anchor on the comps not their cost.
Risks & watch-outs
- Watch-outs: built in 1947 — expect roof / HVAC / electrical / plumbing capex.
- Climate carrying-cost: major wind risk, 41% chance of damaging wind over 30y; extreme-heat days projected 7→16/yr by 2055 (HVAC capex compounding) — expect insurance premiums to compound above CPI over the hold.
Questions for the listing agent
- What do current leases actually rent for vs. the listed asking? Can we see a recent rent roll and the last 12 months of T-12 income?
- Built in 1947 — when were the roof, HVAC, electrical panel, plumbing, and water heater last replaced?
- Is there a deadline driving the sale (1031 exchange, divorce, estate, relocation)? That informs how much negotiation room exists.
- Schools are A-rated — typically a magnet for longer-tenancy family renters. What's the average tenant stay here, and is there a school-zone premium baked into asking?
- The area grade is low — what's the realistic commute time and amenity access for the typical tenant pool here? Any planned neighborhood developments (good or bad) we should know about?
- What's the average days-on-market for RENTAL listings here right now (not sales)? A rising rental-DOM trend means longer vacancies and softer asking-rent achievability than the comps imply.
- What's the recent tenant-quality profile in this submarket — average credit score on applications, eviction rate, late-payment / NSF rate, and stable-employment percentage? A property-management company in the area should have these aggregated.
- How much new for-sale + rental construction is in the pipeline within 1–3 miles? Heavy new supply typically softens prices + rents 12–24 months out; constrained supply supports both.
Investment metrics
- 1% rule
- 0.75% ✗
- Cap rate
- 4.99%
- Cash-on-cash
- -4.64%
- DSCR
- 0.79
- GRM
- 11.1
CMA / ARV
- ARV (median comp)
- $1,039,070
- List price
- $649,000
- Delta
- -37.54%
- Verdict
- UNDERPRICED
- Comps
- 20 within 1.0 mi
Show comp detail 12 sales within ~0.75 mi
| Address | Dist | Beds/Ba | Sqft | Sold | Price | $/sf | Match |
|---|---|---|---|---|---|---|---|
| 296 Jerome Ave | 0.29mi | 4/1.5 | 1,716 (+2%) | 6mo | $800,000 | $466 | 76 |
| 253 Raff Ave | 0.35mi | 4/2.0 | 1,806 (+7%) | 1mo | $888,000 | $492 | 71 |
| 16 Eighth St | 0.17mi | 4/2.5 | 1,912 (+13%) | 2mo | $1,150,000 | $601 | 66 |
| 230 Mineola Ave | 0.50mi | 3/2.0 (-1) | 1,640 (-3%) | 8mo | $870,000 | $530 | 60 |
| 201 Jamaica Blvd | 0.41mi | 4/1.5 | 1,500 (-11%) | 3mo | $750,000 | $500 | 58 |
| 177 Sheridan Blvd | 0.66mi | 5/3.0 (+1) | 1,724 (+2%) | 2mo | $940,000 | $545 | 54 |
| 323 Barwick Blvd | 0.64mi | 3/2.5 (-1) | 1,604 (-5%) | 3mo | $960,000 | $599 | 52 |
| 222 Clemens Rd | 0.60mi | 4/3.0 | 1,800 (+7%) | 6mo | $850,000 | $472 | 52 |
| 227 Brown St | 0.65mi | 4/2.0 | 1,895 (+12%) | 3mo | $950,000 | $501 | 46 |
| 250 Mallard Rd | 0.62mi | 3/3.0 (-1) | 1,577 (-6%) | 7mo | $915,000 | $580 | 45 |
| 85 Aspinwall St | 0.74mi | 4/2.5 | 1,844 (+9%) | 8mo | $800,000 | $434 | 41 |
| 43 Pembrook Dr | 0.53mi | 3/2.5 (-1) | 1,906 (+13%) | 8mo | $1,570,000 | $824 | 40 |
Match score weights: distance 35% · size 25% · config 20% · recency 20%. Top-matched comps best support the ARV.
Projected returns pro-forma
-3.0% appreciation · 3.0% rent growth · sell at horizon
- IRR
- -24.1%
- Equity multiple
- 0.18×
- Total profit
- $-149,785
- Equity at exit
- $96,768
- IRR
- -19.3%
- Equity multiple
- -0.03×
- Total profit
- $-187,545
- Equity at exit
- $56,114
Cash invested: $181,720 (down + closing). Projections, not guarantees.
Landlord ↔ Tenant lean methodology
- Overall (STATE)
- 15 Strongly Tenant-Friendly
- State New York
- 15 Strongly Tenant-Friendly · D+10
- County
- — inherits STATE
- City
- — inherits STATE
ZIP-level market 11514
- Home prices YoY
- -19.7%
- Active inventory
- 15
- Price-to-rent
- 11.1×
Monthly cashflow live
- Estimated rent
- $4,888 high interval (Pro) →
- Mortgage (P&I)
- −$3,403
- Tax from tax record
- −$890 /mo · $10,682/yr
- Insurance
- −$270
- HOA
- −$0
- Vacancy / Maint / Mgmt
- −$1,026
- Net cashflow
- $-702
Break-even live
Sensitivity live
| Price | -10% $-335 | -5% $-519 | +0% $-702 | +5% $-886 | +10% $-1,070 |
|---|---|---|---|---|---|
| Rent | -10% $-1,089 | -5% $-896 | +0% $-702 | +5% $-509 | +10% $-316 |
| Rate | -1.0pp $-376 | -0.5pp $-537 | base $-702 | +0.5pp $-871 | +1.0pp $-1,042 |
UW: 25.0% down · 7.5% · 30yr · 1.5% tax · 5.0% vac · 8.0% maint · 8.0% mgmt
Financing live
Cash to close
- Down payment
- $162,250
- Closing costs
- $19,470
- Reserves months
- —
- Total cash needed
- —
Loan-product check · same deal, 3 products live
Conventional
25% down · 7.5% · 30yr
- Down + closing
- —
- Monthly P&I
- —
- Monthly cashflow
- —
- DSCR
- —
- Eligible?
- —
Personal DTI + credit; lowest rate.
DSCR
20% down · 8.5% · 30yr
- Down + closing
- —
- Monthly P&I
- —
- Monthly cashflow
- —
- DSCR
- —
- Eligible?
- —
No personal income docs; deal must DSCR.
Hard money
10% down · 12.0% · 12mo
- Down + closing
- —
- Monthly P&I
- —
- Monthly cashflow
- —
- DSCR
- —
- Eligible?
- —
Short-term bridge; refi at stabilization.
Rent comps 11 comps
| Address | Beds | Baths | Sqft | Rent | $/sqft | DOM | Units | Dist |
|---|---|---|---|---|---|---|---|---|
| 33 Cherry Ln Carle Place, NY | 4.0 | 2.0 | 1224 | $4,800 | $3.92 | 0d | 1 | 0.74mi |
| 191 Raff Ave Mineola, NY | 3.0 | 2.0 | 1500 | $4,500 | $3.00 | 0d | 1 | 0.76mi |
| 220 Pershing Pkwy Mineola, NY | 4.0 | 2.0 | 1550 | $4,750 | $3.06 | 0d | 1 | 0.84mi |
| 367 Columbus Pkwy Mineola, NY | 3.0 | 3.0 | 1611 | $5,350 | $3.32 | 45d | 1 | 0.97mi |
| 131 Roslyn Rd Unit 1st Floor Mineola, NY | 3.0 | 2.0 | 2200 | $4,100 | $1.86 | 0d | 1 | 1.24mi |
| 50 Albertson Pl Mineola, NY | 3.0 | 2.0 | 1525 | $4,750 | $3.11 | 0d | 1 | 1.26mi |
| 186 Wilson Ave Westbury, NY | 4.0 | 1.5 | 2000 | $4,950 | $2.48 | 0d | 1 | 1.27mi |
| 80 Old Country Rd Mineola, NY | 3.0 | 2.0 | 1400 | $3,200 | $2.29 | 26d | 1 | 1.28mi |
| 74 Mulberry Ave Garden City, NY | 4.0 | 2.5 | 2102 | $7,500 | $3.57 | 12d | 1 | 1.36mi |
| 405 I U Willets Rd Roslyn Heights, NY | 3.0 | 2.0 | 1691 | $5,000 | $2.96 | 18d | 1 | 1.45mi |
| 159 Harrison Ave Unit C Mineola, NY | 3.0 | 2.0 | 1820 | $5,300 | $2.91 | 4d | 1 | 1.47mi |
Listing history 26 events
-
2026-06-04days on market $649,000 Active 23 DOM
-
2026-06-03days on market $649,000 Active 22 DOM
-
2026-06-02days on market $649,000 Active 21 DOM
-
2026-06-01days on market $649,000 Active 20 DOM
-
2026-05-31days on market $649,000 Active 19 DOM
-
2026-05-18price $649,000 604-char remark
-
2026-05-08historical
-
2026-05-07$679,000 Active
-
2026-05-01$699,000 Active 604-char remark
-
2026-04-28historical
-
2026-04-28$779,000
-
2026-04-08status Pending
-
2026-04-07historical
-
2026-03-21price $679,000
-
2026-02-06status Active
-
2026-01-29status Pending
-
2026-01-02status Active
-
2026-01-02price $699,000
-
2025-10-04status Pending
-
2025-09-08price $679,000
-
2025-08-10price $699,000
-
2025-08-04price $724,000
-
2025-07-27$749,000 Active
-
2025-07-24soldstatus $550,000
-
1990-02-08soldstatus $165,000
-
1975-05-01soldstatus $37,500
ⓘ Source: listings_history table (triggers on properties + properties_extension) + one-shot
backfill from property_details.listing_events for pre-trigger history.
Tax reassessment forecast NY · Partial reset (capped growth)
- Current annual tax
- $10,682 · $890/mo
- Projected year-2 tax
- $10,825 · $902/mo
- Expected delta
- +$143/yr (+$12/mo · 1.3%)
ⓘ Screening estimate from a state-policy table — verify with the county assessor before closing.
Climate risk First Street
- Flood 1/10 Low FEMA zone X (unshaded) · 0% chance over 30 yrs
- Wildfire 1/10 Low
- Heat 6/10 Major 7 d/yr ≥96°F today · 16 d/yr by 30 yrs out
- Wind 6/10 Major 41% chance of damaging wind over 30 yrs
- Air quality 4/10 Moderate 4 unhealthy d/yr today · 5 by 30 yrs out
Nearby sold comps map
Loading sold comps map…
Walkable amenities ~0.75 mi
Loading nearby amenities…
Taxation est. · year 1
- Rental income
- $58,657
- − Mortgage interest
- −$36,354
- − Property taxes
- −$10,682
- − Insurance
- −$3,245
- − Repairs & maintenance
- −$4,693
- − Management
- −$4,693
- − Depreciation
- −$18,880
- Taxable loss
- −$19,890
- Est. tax savings @ 24.0%
- +$4,774
- After-tax cash flow
- $-3,656/yr
For passive investors: Depreciation is non-cash, so a rental often shows a tax loss while cash-flowing — sheltering income. Rental losses are passive: they offset passive income freely, and up to $25,000/yr can offset ordinary (W-2) income if you actively participate and your MAGI is under $100k (phasing out to $0 by $150k); unused losses carry forward. On sale, claimed depreciation is recaptured at up to 25%, and gains may owe capital-gains tax (a 1031 exchange can defer both). Figures are a year-1 estimate at your 24.0% rate — not tax advice; consult a CPA.
Schools (NCES district)
- District
- Carle Place Union Free School District
- NCES district ID
- 3606540
- Math proficiency
- 74% ▼ -2.00%
- Reading proficiency
- 68% ▼ -2.00%
- Median HH income
- $93,519
- Composite
- 64.39/100
- National rank
- #546
- State rank
- #99 of 590 in NY
Livability — Carle Place
- Score
- 84/100
- State rank
- #52
- US rank
- #801
Category grades
Schools grade is shown separately in the Schools card above.
Census & demographics
- Census place
- Carle Place, NY
- City population
- 4,421
- Population (ZIP)
- 4,421
Population outlook (Nassau County) Hauer SSP2
- Today (2025)
- 1,409,302 people
- By 2030
- 1,431,482 · +1.6%
- By 2040
- 1,471,607 · +4.4%
- By 2050
- 1,502,845 · +6.6%
- By 2075
- 1,575,403 · +11.8%
- By 2100
- 1,554,356 · +10.3%
Race, ethnicity, and origin ACS 2023
- Neighborhood character
- Predominantly White (68%)
- Race & ethnicity
- White 68% Asian 13% Hispanic / Latino 12% Two or more races 6% Black 2%
- Hispanic origin (detail)
- Puerto Rican 2%
- Common ancestry
- Romanian 2% Russian 2% Slovak 1%
- Foreign-born
- 24% · Canada, Jamaica, South Korea
- Languages at home
- 60% English-only · Other Indo-European 14% Spanish 14% Russian/Polish/Slavic 4%
Political lean MEDSL · Nassau
- 2024 margin
- Toss-up / Even · D 47.9% · R 52.1%
- 2008→2024 swing
- -12.6pp toward R · 2008: 8.4pp · 2024: -4.2pp
- All cycles
- 2024: R+4.2 2020: D+9.5 2016: D+5.3 2012: D+6.7 2008: D+8.4
Not yet ingested
- Civics
- —
Market trends
- HPI YoY
- ▼ -78.88%
- Current HPI
- 321.7934
- Rent YoY
- —
- Metro
- —
- State GDP YoY
- ▲ 2.60%
- F500 in state
- 92
Industry mix (Fortune 500 HQ in NY)
| Industry | F500 HQs | Revenue |
|---|---|---|
| Financial Services | 10 | $950B |
|
||
| Consumer Goods | 9 | $162B |
|
||
| Insurance | 4 | $225B |
|
||
| Telecommunications | 2 | $144B |
|
||
| Pharmaceuticals | 2 | $112B |
|
||
| Media / Entertainment | 2 | $69B |
|
||
Price history
+1630.7% since first listed21 events — show timeline
- 2026-05-18 Price Changed $649,000 OneKey® MLS as Distributed by MLS Grid
- 2026-05-08 Listing Removed — OneKey® MLS as Distributed by MLS Grid
- 2026-05-07 Listed $679,000 OneKey® MLS as Distributed by MLS Grid
- 2026-05-01 Listed $699,000 OneKey® MLS as Distributed by MLS Grid
- 2026-04-28 Listed $779,000 OneKey® MLS as Distributed by MLS Grid
- 2026-04-28 Listing Removed — OneKey® MLS as Distributed by MLS Grid
- 2026-04-08 Pending — OneKey® MLS as Distributed by MLS Grid
- 2026-04-07 Listing Removed — OneKey® MLS as Distributed by MLS Grid
- 2026-03-21 Price Changed $679,000 OneKey® MLS as Distributed by MLS Grid
- 2026-02-06 Relisted — OneKey® MLS as Distributed by MLS Grid
- 2026-01-29 Pending — OneKey® MLS as Distributed by MLS Grid
- 2026-01-02 Relisted — OneKey® MLS as Distributed by MLS Grid
- 2026-01-02 Price Changed $699,000 OneKey® MLS as Distributed by MLS Grid
- 2025-10-04 Pending — OneKey® MLS as Distributed by MLS Grid
- 2025-09-08 Price Changed $679,000 OneKey® MLS as Distributed by MLS Grid
- 2025-08-10 Price Changed $699,000 OneKey® MLS as Distributed by MLS Grid
- 2025-08-04 Price Changed $724,000 OneKey® MLS as Distributed by MLS Grid
- 2025-07-27 Listed $749,000 OneKey® MLS as Distributed by MLS Grid
- 2025-07-24 Sold (Public Records) $550,000 Public Records
- 1990-02-08 Sold (Public Records) $165,000 Public Records
- 1975-05-01 Sold (Public Records) $37,500 Public Records
Property tax history
+2.9%/yrLatest (2024): $10,682 · +8.0% YoY. Source: county tax records.
Cash-flow waterfall
monthlySold comps — $/sqft
last 12 mo · ≤1 miLoading sold comps…