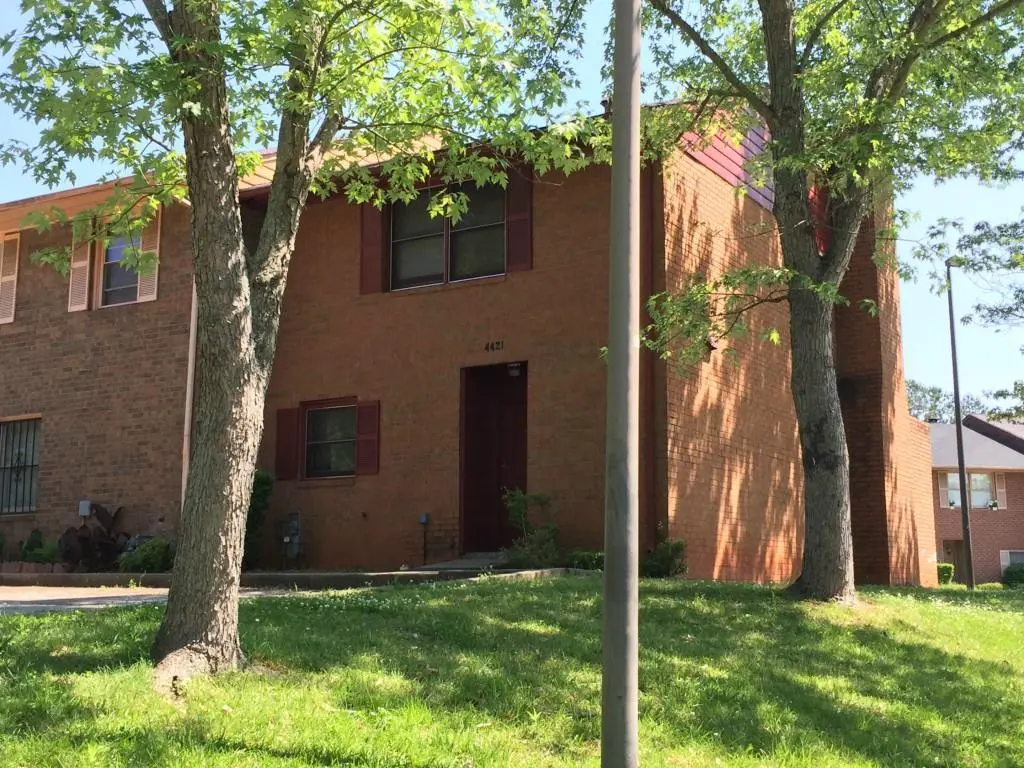
4421 Golf Vista Cir · Stonecrest, GA
Flood risk 1/10 · Minimal
- FEMA flood zone
- X (unshaded)
- Chance of flooding over 30 yrs
- 0.0%
- Est. flood insurance / yr
- $507 – $1,088
Fire risk 1/10 · Minimal
- Est. fire insurance / yr
- $963 – $1,789
Heat risk 6/10 · Moderate
- Hot days now (above 105°F)
- 7 days/yr
- Hot days in 30 yrs
- 18 days/yr
Wind risk 5/10 · Moderate
- Chance of severe wind over 30 yrs
- 26.0%
Air-quality risk 5/10 · Moderate
- Unhealthy air days now
- 7 days/yr
- Unhealthy air days in 30 yrs
- 10 days/yr
Risk factors via First Street. Map © Google.
Why this score? — see what drove the C+ grade
The composite is a weighted blend of 9 inputs, each scored 0–100. Each bar is that input's sub-score; the figure is the points it added to the 100-point composite (weight × sub-score).
- Cash flow +30.0/30.0
- 1% rule +10.0/10.0
- DSCR +10.0/10.0
- ARV discount +4.7/15.0
- Rent growth +2.7/5.0
- Livability +2.5/5.0
- Condition / age +2.5/5.0
- Schools +2.1/10.0
- Appreciation +0.0/10.0
$105,000
🖨 Deal sheet 📄 Offer letter ✓ Due diligence
Listing remarks MLS
Don't miss out on this great investment opportunity. Great location and a price you cant beat!!!
Key facts
- Built 1984
- Listed 3 days
Property features AI
Exterior
- Parking: Parking lot
- Utilities: Public water; Public sewer; 110-volt electric; Cable available; Electricity available; Sewer available; Water available
- Home design: Two levels; Brick on three sides; Resale property; Slab foundation; Fee simple ownership; Composition roof
- Construction: Brick exterior (3 sides); Composition roof; Slab foundation
- Exterior features: Balcony; Patio
Interior
- Kitchen: Laminate counters; Dishwasher; Gas oven; Gas range; Range hood; Refrigerator
- Bedrooms: Two upper-level bedrooms; Bedrooms with other/unspecified features
- Flooring: Carpet; Vinyl
- Bathrooms: One full bathroom on upper level; One half bathroom on main level; Master bath with double vanity and separate his-and-hers areas
- Heating & cooling: Central heating; Central air; Ceiling fan(s)
- Interior features: One fireplace in the living room; Double vanity in master bath; Walk-in closet(s); End unit with one common wall
- Laundry & utility: Electric dryer hookup; Gas dryer hookup; Gas water heater
Neighborhood map
What this means for you Summary
Snapshot
- This is a 2-bed/1.5-bath townhouse listed at $105k.
Deal economics
- At list price, monthly cash flow is $644 ($8k/yr) — positive.
- The deal already cash-flows at list — no discount required.
- Meets the 1% rule at list price ($2k rent vs $105k).
- Cap rate 13.6% vs local median 5.1% in Stonecrest — top-decile yield for the area; either an underpriced asset or a hidden risk that comps aren't pricing in. Stress-test before assuming the spread holds.
Location & tenants
- Location reads: area grade C — affects rentability + tenant quality, not the cash-flow math above.
- Dekalb County (suburban): math 19% / reading 28% proficiency, ranked #125 of 174 in GA (top 72%) — low school quality limits family demand, transient renter base, plan for 1-2y turnover; 68% free/reduced lunch — lower-income household profile, screen leases tightly.
- Zoned schools: Canby Lane Elementary School (math 8% / reading 17%, grade F, #1,032 of 1,228 statewide, top 85%, 461 students, 100% FRL); Mary Mcleod Bethune Middle School (math 4% / reading 13%, grade F, #439 of 470 statewide, top 94%, 718 students, 100% FRL); Towers High School (math 2% / reading 12%, grade F, #385 of 424 statewide, top 92%, 764 students, 100% FRL) — zoned schools average 100% FRL vs 68% district-wide (32 pts higher); higher-poverty schools than district average — tighter screening recommended.
- Zoned-school proficiency averages 9% at this address vs 24% district-wide (-14 pts) — the specific schools serving this property underperform the Dekalb County average; the district grade overstates school quality for this exact location.
- Market conditions: Rents flat; 180 active listings in the ZIP; 31 comparable units currently listed for rent nearby; rentals at typical pace (median 24d on market — plan ~3-4 weeks tenant-placement turnaround); 48% of comp listings sitting > 30 days — soft ceiling on asking rent; 1,240 units permitted in DeKalb County in 2024 (385 in 5+ unit buildings).
- This rent runs 33% of the median local income ($67k/yr) — at the standard rent-burdened threshold; future hikes will face affordability resistance.
Forward outlook
- Local home prices are declining (-3.0%/yr); year-one equity from $726 of loan paydown is wiped out by about $3k of value loss. Plan a longer hold.
- DeKalb County population projected at +28% by 2050 — long-run rental-demand tailwind backs the buy-and-hold thesis.
- At projected returns (-3.0% appreciation + 0.9% rent growth), your $29k cash investment doubles in ~6 years — after that, you're playing with house money.
Negotiation context
- Only 3 days on market — expect competitive offers; lowballing is unlikely to land.
- 5 sale attempts since 13y ago with the ask held roughly flat each time — persistent listings suggest the price (not the market) is what's stuck; bring a comps-based counter.
- Current owner paid $30k; list at $105k implies a 250% gain — meaningful room to come down on a strong offer.
Risks & watch-outs
- Climate carrying-cost: moderate wind risk, 26% chance of damaging wind over 30y; extreme-heat days projected 7→18/yr by 2055 (HVAC capex compounding) — expect insurance premiums to compound above CPI over the hold.
Questions for the listing agent
- Is there a deadline driving the sale (1031 exchange, divorce, estate, relocation)? That informs how much negotiation room exists.
- What's the average days-on-market for RENTAL listings here right now (not sales)? A rising rental-DOM trend means longer vacancies and softer asking-rent achievability than the comps imply.
- What's the recent tenant-quality profile in this submarket — average credit score on applications, eviction rate, late-payment / NSF rate, and stable-employment percentage? A property-management company in the area should have these aggregated.
- How much new for-sale + rental construction is in the pipeline within 1–3 miles? Heavy new supply typically softens prices + rents 12–24 months out; constrained supply supports both.
Investment metrics
- 1% rule
- 1.74% ✓
- Cap rate
- 13.65%
- Cash-on-cash
- 26.27%
- DSCR
- 2.17
- GRM
- 4.8
CMA / ARV
- ARV (on-the-fly)
- $98,904
- Comps found
- 3
Show comp detail 3 sales within ~0.75 mi
| Address | Dist | Beds/Ba | Sqft | Sold | Price | $/sf | Match |
|---|---|---|---|---|---|---|---|
| 4421 Golf Vista Cir | 0.00mi | 2/1.5 | 1,268 (0%) | 0mo | $99,000 | $78 | 100 |
| 4485 Golf Vista Cir | 0.05mi | 2/1.5 | 1,271 (+0%) | 11mo | $101,600 | $80 | 88 |
| 4522 Golf Vista Cir #4522 | 0.11mi | 2/2.5 | 1,268 (0%) | 19mo | $95,000 | $75 | 75 |
Match score weights: distance 35% · size 25% · config 20% · recency 20%. Top-matched comps best support the ARV.
Projected returns pro-forma
-3.0% appreciation · 0.87% rent growth · sell at horizon
- IRR
- 17.5%
- Equity multiple
- 1.69×
- Total profit
- $20,220
- Equity at exit
- $15,656
- IRR
- 24.4%
- Equity multiple
- 2.89×
- Total profit
- $55,615
- Equity at exit
- $9,078
Cash invested: $29,400 (down + closing). Projections, not guarantees.
Landlord ↔ Tenant lean methodology
- Overall (STATE)
- 90 Strongly Landlord-Friendly
- State Georgia
- 90 Strongly Landlord-Friendly · R+3
- County
- — inherits STATE
- City
- — inherits STATE
ZIP-level market 30035
- Home prices YoY
- -33.8%
- Rents YoY
- 0.9%
- Active inventory
- 180
- Price-to-rent
- 4.8×
Monthly cashflow live
- Estimated rent
- $1,827 high interval (Pro) →
- Mortgage (P&I)
- −$551
- Tax from tax record
- −$206 /mo · $2,467/yr
- Insurance
- −$44
- HOA
- −$0
- Vacancy / Maint / Mgmt
- −$384
- Net cashflow
- $644
Break-even live
UW: 25.0% down · 7.5% · 30yr · 1.5% tax · 5.0% vac · 8.0% maint · 8.0% mgmt
Financing live
Cash to close
- Down payment
- $26,250
- Closing costs
- $3,150
- Reserves months
- —
- Total cash needed
- —
Loan-product check · same deal, 3 products live
Conventional
25% down · 7.5% · 30yr
- Down + closing
- —
- Monthly P&I
- —
- Monthly cashflow
- —
- DSCR
- —
- Eligible?
- —
Personal DTI + credit; lowest rate.
DSCR
20% down · 8.5% · 30yr
- Down + closing
- —
- Monthly P&I
- —
- Monthly cashflow
- —
- DSCR
- —
- Eligible?
- —
No personal income docs; deal must DSCR.
Hard money
10% down · 12.0% · 12mo
- Down + closing
- —
- Monthly P&I
- —
- Monthly cashflow
- —
- DSCR
- —
- Eligible?
- —
Short-term bridge; refi at stabilization.
Rent comps 31 comps
| Address | Beds | Baths | Sqft | Rent | $/sqft | DOM | Units | Dist |
|---|---|---|---|---|---|---|---|---|
| 4433 Golf Vista Cir Decatur, GA | 3.0 | 2.5 | 1495 | $1,350 | $0.90 | 24d | 1 | 0.01mi |
| 4336 Pleasant Point Dr Decatur, GA | 1.0–3.0 | 1.0–2.0 | 1010 | $1,088 | $1.08 | 1d | 4 | 0.27mi |
| 10 Friendly Hills Dr Decatur, GA | 2.0 | 2.0 | 994 | $1,534 | $1.54 | 24d | 1 | 0.29mi |
| 2692 Paxton PL #14 Decatur, GA | 3.0 | 2.5 | 1611 | $2,299 | $1.43 | 43d | 1 | 0.30mi |
| 4292 Callum Ct Decatur, GA | 3.0 | 2.5 | 1611 | $2,200 | $1.37 | 43d | 1 | 0.32mi |
| 4282 Callum Ct Decatur, GA | 3.0 | 2.5 | 1611 | $2,200 | $1.37 | 43d | 1 | 0.34mi |
| 4707 Riverwood Cir Decatur, GA | 3.0 | 2.0 | 1826 | $1,850 | $1.01 | 24d | 1 | 0.77mi |
| 4225 Wingfoot Ct Decatur, GA | 2.0 | 2.0 | 1120 | $1,600 | $1.43 | 24d | 1 | 0.82mi |
| 2937 Thompson Cir Decatur, GA | 3.0 | 2.0 | 1480 | $1,860 | $1.26 | 1d | 1 | 0.85mi |
| 2319 Wingfoot Pl Decatur, GA | 3.0 | 2.5 | 1840 | $1,800 | $0.98 | 43d | 1 | 0.86mi |
| 2347 Greenway Dr Decatur, GA | 3.0 | 2.0 | 1200 | $1,975 | $1.65 | 24d | 1 | 0.93mi |
| 2878 Snapfinger Mnr Decatur, GA | 3.0 | 2.5 | 1670 | $1,780 | $1.07 | 3d | 1 | 0.96mi |
| 2559 Walden Lake Dr Unit 1 Decatur, GA | 3.0 | 2.5 | 1464 | $2,000 | $1.37 | 43d | 1 | 0.96mi |
| 2569 Terrace Trl Decatur, GA | 3.0 | 3.0 | 1752 | $1,800 | $1.03 | 43d | 1 | 0.97mi |
| 2563 Terrace Trl Decatur, GA | 3.0 | 3.0 | 1752 | $1,950 | $1.11 | 12d | 1 | 0.97mi |
| 2525 Terrace Trl Unit 2525 Decatur, GA | 3.0 | 3.0 | 1593 | $1,850 | $1.16 | 12d | 1 | 0.97mi |
| 2545 Walden Lake Dr Unit 1 Decatur, GA | 3.0 | 2.5 | 1464 | $2,000 | $1.37 | 43d | 1 | 0.98mi |
| 2481 Terrace Trl Decatur, GA | 3.0 | 3.0 | 1752 | $2,050 | $1.17 | 43d | 1 | 0.99mi |
| 2553 Terrace Trl Unit 2553 Decatur, GA | 3.0 | 2.0 | 1865 | $1,950 | $1.05 | 12d | 1 | 1.01mi |
| 4908 Longview Walk Decatur, GA | 3.0 | 2.5 | 1480 | $2,000 | $1.35 | 43d | 1 | 1.10mi |
| 4917 Longview Walk Decatur, GA | 3.0 | 2.5 | 1486 | $2,000 | $1.35 | 20d | 1 | 1.12mi |
| 4946 Snapfinger Woods Dr Decatur, GA | 1.0–2.0 | 1.0–2.5 | 965 | $1,259 | $1.30 | 1d | 18 | 1.15mi |
| 3095 Riders Trl Decatur, GA | 3.0 | 2.0 | 1800 | $4,500 | $2.50 | 1d | 1 | 1.15mi |
| 5038 Longview Walk Decatur, GA | 3.0 | 2.5 | 1577 | $1,995 | $1.27 | 43d | 1 | 1.18mi |
| 4010 Emerald Lake Dr Decatur, GA | 2.0 | 2.0 | 1177 | $1,500 | $1.27 | 43d | 1 | 1.19mi |
| 2658 Avanti Way Decatur, GA | 3.0 | 2.5 | 1616 | $2,000 | $1.24 | 43d | 1 | 1.19mi |
| 4909 Truitt Ln Decatur, GA | 3.0 | 2.0 | 1697 | $2,500 | $1.47 | 43d | 1 | 1.21mi |
| 4919 Wilkins Station Dr Decatur, GA | 3.0 | 2.0 | 1770 | $2,161 | $1.22 | 20d | 1 | 1.26mi |
| 5108 Jack Dr Decatur, GA | 3.0 | 2.5 | 1872 | $2,185 | $1.17 | 24d | 1 | 1.28mi |
| 4066 Marble Arch Ct Decatur, GA | 3.0 | 2.0 | 1344 | $1,800 | $1.34 | 43d | 1 | 1.43mi |
| 3122 Northchester Pl Lithonia, GA | 1.0 | 1.0 | 1281 | $1,350 | $1.05 | 43d | 1 | 1.49mi |
Listing history 20 events
-
2026-05-21$105,000 Active
-
2015-09-15price $30,000 96-char remark
Show marketing remark (96 chars)
Don't miss out on this great investment opportunity. Great location and a price you cant beat!!!
-
2015-09-01price $30,000 96-char remark
Show marketing remark (96 chars)
Don't miss out on this great investment opportunity. Great location and a price you cant beat!!!
-
2015-08-31historical Pending 96-char remark
Show marketing remark (96 chars)
Don't miss out on this great investment opportunity. Great location and a price you cant beat!!!
-
2015-08-31status Under Contract 96-char remark
Show marketing remark (96 chars)
Don't miss out on this great investment opportunity. Great location and a price you cant beat!!!
-
2015-08-21soldstatus $30,000 Sold 96-char remark
Show marketing remark (96 chars)
Don't miss out on this great investment opportunity. Great location and a price you cant beat!!!
-
2015-08-21price $35,000 96-char remark
Show marketing remark (96 chars)
Don't miss out on this great investment opportunity. Great location and a price you cant beat!!!
-
2015-08-21soldstatus $30,000 Sold 96-char remark
Show marketing remark (96 chars)
Don't miss out on this great investment opportunity. Great location and a price you cant beat!!!
-
2015-07-29price $35,000 96-char remark
Show marketing remark (96 chars)
Don't miss out on this great investment opportunity. Great location and a price you cant beat!!!
-
2015-07-03status Back On Market 96-char remark
Show marketing remark (96 chars)
Don't miss out on this great investment opportunity. Great location and a price you cant beat!!!
-
2015-06-17status Pending Offer Approval 96-char remark
Show marketing remark (96 chars)
Don't miss out on this great investment opportunity. Great location and a price you cant beat!!!
-
2015-05-08$35,000 New 96-char remark
Show marketing remark (96 chars)
Don't miss out on this great investment opportunity. Great location and a price you cant beat!!!
-
2015-05-08$35,000 Active 96-char remark
Show marketing remark (96 chars)
Don't miss out on this great investment opportunity. Great location and a price you cant beat!!!
-
2013-07-22historical
-
2013-03-13price $35,000 Reduced
-
2013-01-22$40,000 New
-
1989-09-21soldstatus $45,700
-
1989-09-21soldstatus $45,700
-
1989-04-01soldstatus $46,300
-
1987-03-03soldstatus $45,900
ⓘ Source: listings_history table (triggers on properties + properties_extension) + one-shot
backfill from property_details.listing_events for pre-trigger history.
Tax reassessment forecast GA · Resets to sale price
- Current annual tax
- $2,467 · $206/mo
- Projected year-2 tax
- $2,467 · $206/mo
- Expected delta
- $0/yr ($0/mo · 0.0%)
ⓘ Screening estimate from a state-policy table — verify with the county assessor before closing.
Climate risk First Street
- Flood 1/10 Low FEMA zone X (unshaded) · 0% chance over 30 yrs
- Wildfire 1/10 Low
- Heat 6/10 Major 7 d/yr ≥105°F today · 18 d/yr by 30 yrs out
- Wind 5/10 Major 26% chance of damaging wind over 30 yrs
- Air quality 5/10 Major 7 unhealthy d/yr today · 10 by 30 yrs out
Nearby sold comps map
Loading sold comps map…
Walkable amenities ~0.75 mi
Loading nearby amenities…
Taxation est. · year 1
- Rental income
- $21,928
- − Mortgage interest
- −$5,882
- − Property taxes
- −$2,467
- − Insurance
- −$525
- − Repairs & maintenance
- −$1,754
- − Management
- −$1,754
- − Depreciation
- −$3,055
- Taxable income
- $6,492
- Est. tax owed @ 24.0%
- −$1,558
- After-tax cash flow
- $6,166/yr
For passive investors: Depreciation is non-cash, so a rental often shows a tax loss while cash-flowing — sheltering income. Rental losses are passive: they offset passive income freely, and up to $25,000/yr can offset ordinary (W-2) income if you actively participate and your MAGI is under $100k (phasing out to $0 by $150k); unused losses carry forward. On sale, claimed depreciation is recaptured at up to 25%, and gains may owe capital-gains tax (a 1031 exchange can defer both). Figures are a year-1 estimate at your 24.0% rate — not tax advice; consult a CPA.
Schools (NCES district)
- District
- Dekalb County
- NCES district ID
- 1301740
- Math proficiency
- 19% ▼ -12.00%
- Reading proficiency
- 28% ▼ -7.00%
- Median HH income
- $51,448
- Composite
- 20.92/100
- National rank
- #8482
- State rank
- #125 of 174 in GA
Livability — Stonecrest
No livability data for this city. (Only ~50 U.S. cities are tracked.)
Census & demographics
- County
- Dekalb County · 782,738 people
- City population
- 106,165
- Metro
- Atlanta-Sandy Springs-Alpharetta, GA
- Population (ZIP)
- 21,569
- Household income
- $66,799
- Rent vs Own
- Severe rent burden
- 1304.0
Population outlook (DeKalb County) Hauer SSP2
- Today (2025)
- 839,977 people
- By 2030
- 891,768 · +6.2%
- By 2040
- 988,894 · +17.7%
- By 2050
- 1,074,583 · +27.9%
- By 2075
- 1,245,026 · +48.2%
- By 2100
- 1,303,135 · +55.1%
Race, ethnicity, and origin ACS 2023
- Neighborhood character
- Predominantly Black (91%)
- Race & ethnicity
- Black 91% White 4% Hispanic / Latino 4% Two or more races 3%
- Common ancestry
- Italian 1% Swiss 0%
- Foreign-born
- 12% · Canada, Jamaica
- Languages at home
- 86% English-only · Spanish 4% French/Haitian/Cajun 2%
Political lean MEDSL · DeKalb
- 2024 margin
- Solid D (+64.8) · D 81.9% · R 17.1% · Other 1.0%
- 2008→2024 swing
- +6.1pp toward D · 2008: 58.6pp · 2024: 64.8pp
- All cycles
- 2024: D+64.8 2020: D+67.4 2016: D+64.8 2012: D+56.8 2008: D+58.6
Not yet ingested
- Civics
- —
Market trends
- HPI YoY
- ▼ -111.60%
- Current HPI
- 218.8323
- Rent YoY
- ▲ 0.87%
- Metro
- Atlanta-Sandy Springs-Alpharetta, GA
- State GDP YoY
- ▲ 2.66%
- F500 in state
- 28
Industry mix (Fortune 500 HQ in GA)
| Industry | F500 HQs | Revenue |
|---|---|---|
| Paper / Packaging | 2 | $29B |
|
||
| Retail | 1 | $160B |
|
||
| Transportation / Logistics | 1 | $91B |
|
||
| Airlines | 1 | $62B |
|
||
| Consumer Goods | 1 | $47B |
|
||
| Utilities | 1 | $25B |
|
||
Price history
+128.8% since first listed20 events — show timeline
- 2026-05-21 Listed $105,000 FMLS
- 2015-09-15 Price Changed $30,000 GAMLS
- 2015-09-01 Price Changed $30,000 FMLS
- 2015-08-31 Contingent — FMLS
- 2015-08-31 Pending — GAMLS
- 2015-08-21 Sold (MLS) $30,000 GAMLS
- 2015-08-21 Sold (MLS) $30,000 FMLS
- 2015-08-21 Price Changed $35,000 FMLS
- 2015-07-29 Price Changed $35,000 GAMLS
- 2015-07-03 Relisted — GAMLS
- 2015-06-17 Pending — GAMLS
- 2015-05-08 Listed $35,000 GAMLS
- 2015-05-08 Listed $35,000 FMLS
- 2013-07-22 Listing Removed — GAMLS
- 2013-03-13 Price Changed $35,000 GAMLS
- 2013-01-22 Listed $40,000 GAMLS
- 1989-09-21 Sold (Public Records) $45,700 Public Records
- 1989-09-21 Sold (Public Records) $45,700 Public Records
- 1989-04-01 Sold (Public Records) $46,300 Public Records
- 1987-03-03 Sold (Public Records) $45,900 Public Records
Property tax history
+3.3%/yrLatest (2025): $2,467 · -7.8% YoY. Source: county tax records.
Cash-flow waterfall
monthlySold comps — $/sqft
last 12 mo · ≤1 miLoading sold comps…