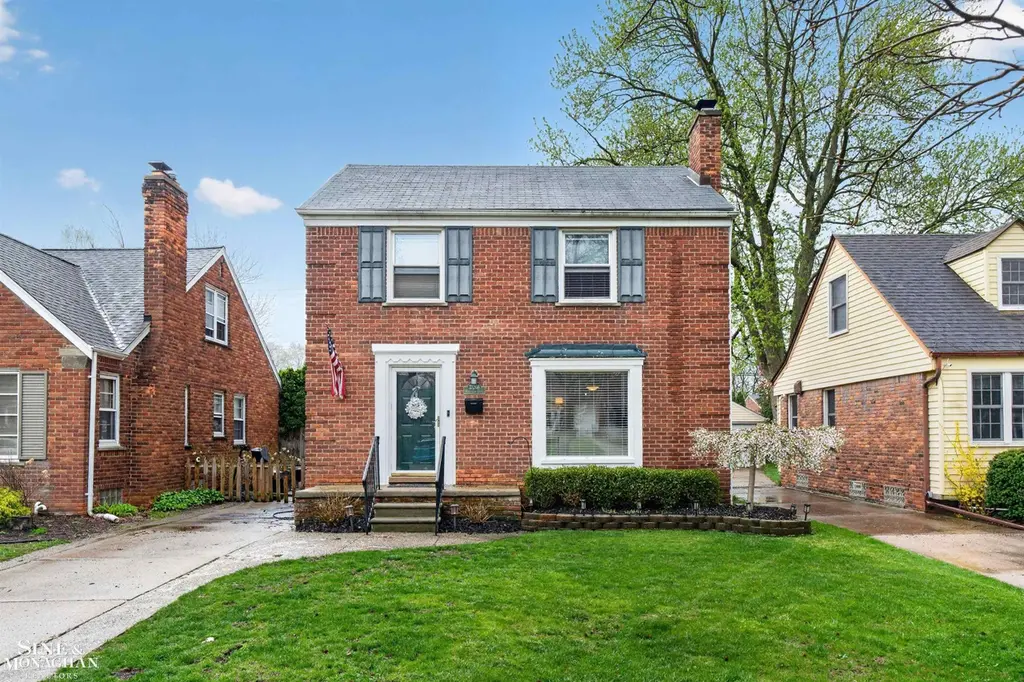
21208 Hunt Club Dr · Harper Woods, MI
Flood risk 1/10 · Minimal
- FEMA flood zone
- X (unshaded)
- Chance of flooding over 30 yrs
- 0.0%
- Est. flood insurance / yr
- $473 – $860
Fire risk 1/10 · Minimal
- Est. fire insurance / yr
- $784 – $1,456
Heat risk 3/10 · Minor
- Hot days now (above 96°F)
- 7 days/yr
- Hot days in 30 yrs
- 15 days/yr
Wind risk 2/10 · Minimal
- Chance of severe wind over 30 yrs
- —
Air-quality risk 3/10 · Minor
- Unhealthy air days now
- 3 days/yr
- Unhealthy air days in 30 yrs
- 4 days/yr
Risk factors via First Street. Map © Google.
Why this score? — see what drove the F grade
The composite is a weighted blend of 9 inputs, each scored 0–100. Each bar is that input's sub-score; the figure is the points it added to the 100-point composite (weight × sub-score).
- Cash flow +8.5/30.0
- Schools +5.7/10.0
- Rent growth +3.8/5.0
- Livability +3.7/5.0
- Condition / age +2.5/5.0
- DSCR +2.3/10.0
- 1% rule +1.5/10.0
- ARV discount +0.0/15.0
- Appreciation +0.0/10.0
$299,000
🖨 Deal sheet 📄 Offer letter ✓ Due diligence
Listing remarks MLS
3 bedrooms 1.5 bath colonial with Grosse Pointe Public Schools. Welcome to this charming and well maintained brick colonial located east of Mack Avenue. Step inside to find a bright and spacious layout featuring a large living room with a cozy fireplace-ideal for relaxing evenings. The open concept kitchen flows into the dining area and living room creating a space for entertaining or staying connected with family and friends. The kitchen and bathrooms have been nicely updated. Underneath the carpeting you will find hardwood floors. Enjoy additional living and entertaining space with both a spacious family room and a deck-perfect for gathering and relaxing. Upstairs is 3 nicely sized bedrooms. Don't miss this special home.
Key facts
- Open concept kitchen
- Large living room
- Updated bathrooms
Tags
Neighborhood map
What this means for you Summary
Snapshot
- This is a 3-bed/1.5-bath single-family listed at $299k.
Deal economics
- At list price, monthly cash flow is $-264 ($-3k/yr) — negative.
- To cash-flow at today's rent, offer at most $252k (15.6% below list).
- To meet the 1% rule (rent ≥ 1% of price), the offer needs to be $195k (34.9% below list).
- Recommended offer: $195k (34.9% below list) — sets the bar for 1% rule.
- Cap rate 5.2% vs local median 7.7% in Harper Woods — below-typical yield; the buyer is paying a premium for something (appreciation thesis, condition, location) that the cap rate doesn't capture.
Location & tenants
- Location reads 73/100 on livability (#199 in MI) — a middle-class / working-renter tenant base. Strengths: commute A+, cost of living A+, housing A+; Watch: employment D+, health & safety D+, schools D-.
- Grosse Pointe Public Schools (suburban): math 56% / reading 68% proficiency, ranked #24 of 540 in MI (top 4%) — acceptable for families but not a draw, mixed tenant base, ~2y average lease; only 13% free/reduced lunch — higher-income household profile.
- Market conditions: Rents rising fast (+5.1%/yr); 133 active listings in the ZIP; 19 comparable units currently listed for rent nearby; rentals leasing fast (median 11d on market — plan ~1-2 weeks tenant-placement turnaround); 2,639 units permitted in Wayne County in 2024 (1,216 in 5+ unit buildings).
- This rent runs 38% of the median local income ($62k/yr) — at the standard rent-burdened threshold; future hikes will face affordability resistance.
Forward outlook
- Local home prices are declining (-3.0%/yr); year-one equity from $2k of loan paydown is wiped out by about $9k of value loss. Plan a longer hold.
- Wayne County population projected at -17% by 2050 — secular population decline; favor cash flow + early exit over multi-decade hold.
Negotiation context
- It's been on market 55 days — a 3% lower offer ($290k) is reasonable based on typical stale-listing flexibility.
- 14 sale attempts since 26y ago with the ask held roughly flat each time — persistent listings suggest the price (not the market) is what's stuck; bring a comps-based counter.
- Current owner paid $115k; list at $299k implies a 160% gain — meaningful room to come down on a strong offer.
Risks & watch-outs
- Watch-outs: built in 1948 — expect roof / HVAC / electrical / plumbing capex.
Questions for the listing agent
- What do current leases actually rent for vs. the listed asking? Can we see a recent rent roll and the last 12 months of T-12 income?
- It's been on market 55 days. Have you received any prior offers? Is the seller open to a 35% concession, seller financing, or rate buy-down credit?
- Built in 1948 — when were the roof, HVAC, electrical panel, plumbing, and water heater last replaced?
- Is there a deadline driving the sale (1031 exchange, divorce, estate, relocation)? That informs how much negotiation room exists.
- Schools are D-rated, which usually means shorter tenancies and higher turnover. Who's the typical renter profile here, and what's been the actual vacancy rate?
- Crime grade is F in this area — have there been break-ins, vandalism, or insurance claims at this property in the last 3 years? What carrier currently insures it and at what premium?
- The area grade is low — what's the realistic commute time and amenity access for the typical tenant pool here? Any planned neighborhood developments (good or bad) we should know about?
- What's the average days-on-market for RENTAL listings here right now (not sales)? A rising rental-DOM trend means longer vacancies and softer asking-rent achievability than the comps imply.
- What's the recent tenant-quality profile in this submarket — average credit score on applications, eviction rate, late-payment / NSF rate, and stable-employment percentage? A property-management company in the area should have these aggregated.
- How much new for-sale + rental construction is in the pipeline within 1–3 miles? Heavy new supply typically softens prices + rents 12–24 months out; constrained supply supports both.
Investment metrics
- 1% rule
- 0.65% ✗
- Cap rate
- 5.24%
- Cash-on-cash
- -3.78%
- DSCR
- 0.83
- GRM
- 12.8
CMA / ARV
- ARV (median comp)
- $254,905
- List price
- $299,000
- Delta
- 17.30%
- Verdict
- OVERPRICED
- Comps
- 20 within 1.0 mi
Show comp detail 12 sales within ~0.75 mi
| Address | Dist | Beds/Ba | Sqft | Sold | Price | $/sf | Match |
|---|---|---|---|---|---|---|---|
| 1906 Oxford Rd | 0.23mi | 3/1.0 | 1,510 (+0%) | 2mo | $285,000 | $189 | 86 |
| 20879 Hunt Club Dr | 0.19mi | 3/1.0 | 1,621 (+8%) | 3mo | $210,000 | $130 | 74 |
| 1866 Country Club Rd | 0.29mi | 3/1.5 | 1,367 (-9%) | 1mo | $299,000 | $219 | 70 |
| 1837 Country Club Dr | 0.30mi | 3/2.0 | 1,714 (+14%) | 3mo | $325,000 | $190 | 59 |
| 2073 Hawthorne Rd | 0.63mi | 3/1.5 | 1,640 (+9%) | 0mo | $337,500 | $206 | 56 |
| 20631 Lochmoor St | 0.40mi | 3/2.5 | 1,311 (-13%) | 2mo | $219,000 | $167 | 54 |
| 20640 Fleetwood Dr | 0.45mi | 3/1.0 | 1,300 (-14%) | 1mo | $125,000 | $96 | 53 |
| 1988 Hollywood Ave | 0.73mi | 3/2.0 | 1,600 (+6%) | 1mo | $250,000 | $156 | 53 |
| 20946 Littlestone Rd | 0.61mi | 3/1.0 | 1,660 (+10%) | 1mo | $212,000 | $128 | 52 |
| 1937 Allard Ave | 0.56mi | 3/2.0 | 1,685 (+12%) | 0mo | $270,000 | $160 | 52 |
| 1776 Manchester Blvd | 0.57mi | 3/1.0 | 1,699 (+13%) | 2mo | $315,000 | $185 | 48 |
| 2202 Hollywood Ave | 0.72mi | 3/1.0 | 1,340 (-11%) | 0mo | $207,000 | $154 | 46 |
Match score weights: distance 35% · size 25% · config 20% · recency 20%. Top-matched comps best support the ARV.
Projected returns pro-forma
-3.0% appreciation · 5.1% rent growth · sell at horizon
- IRR
- -20.7%
- Equity multiple
- 0.27×
- Total profit
- $-61,171
- Equity at exit
- $44,582
- IRR
- -10.5%
- Equity multiple
- 0.31×
- Total profit
- $-57,431
- Equity at exit
- $25,852
Cash invested: $83,720 (down + closing). Projections, not guarantees.
Landlord ↔ Tenant lean methodology
- Overall (STATE)
- 62 Landlord-Friendly
- State Michigan
- 62 Landlord-Friendly · EVEN
- County
- — inherits STATE
- City
- — inherits STATE
ZIP-level market 48225
- Rents YoY
- 5.1%
- Active inventory
- 133
- Price-to-rent
- 12.8×
Monthly cashflow live
- Estimated rent
- $1,947 high interval (Pro) →
- Mortgage (P&I)
- −$1,568
- Tax from tax record
- −$109 /mo · $1,311/yr
- Insurance
- −$125
- HOA
- −$0
- Vacancy / Maint / Mgmt
- −$409
- Net cashflow
- $-264
Break-even live
UW: 25.0% down · 7.5% · 30yr · 1.5% tax · 5.0% vac · 8.0% maint · 8.0% mgmt
Financing live
Cash to close
- Down payment
- $74,750
- Closing costs
- $8,970
- Reserves months
- —
- Total cash needed
- —
Loan-product check · same deal, 3 products live
Conventional
25% down · 7.5% · 30yr
- Down + closing
- —
- Monthly P&I
- —
- Monthly cashflow
- —
- DSCR
- —
- Eligible?
- —
Personal DTI + credit; lowest rate.
DSCR
20% down · 8.5% · 30yr
- Down + closing
- —
- Monthly P&I
- —
- Monthly cashflow
- —
- DSCR
- —
- Eligible?
- —
No personal income docs; deal must DSCR.
Hard money
10% down · 12.0% · 12mo
- Down + closing
- —
- Monthly P&I
- —
- Monthly cashflow
- —
- DSCR
- —
- Eligible?
- —
Short-term bridge; refi at stabilization.
Rent comps 19 comps
| Address | Beds | Baths | Sqft | Rent | $/sqft | DOM | Units | Dist |
|---|---|---|---|---|---|---|---|---|
| 1883 Lochmoor Blvd Grosse Pointe Woods, MI | 3.0 | 2.5 | 1744 | $2,900 | $1.66 | 2d | 1 | 0.26mi |
| 1992 Hawthorne Rd Grosse Pointe Woods, MI | 3.0 | 2.0 | 1071 | $2,100 | $1.96 | 10d | 1 | 0.66mi |
| 2175 Ridgemont Rd Grosse Pointe Woods, MI | 2.0 | 1.0 | 1100 | $1,300 | $1.18 | 44d | 1 | 0.73mi |
| 20270 Hollywood St Harper Woods, MI | 3.0 | 1.0 | 1228 | $1,650 | $1.34 | 2d | 1 | 0.90mi |
| 20600 Balfour St Harper Woods, MI | 1.0–2.0 | 1.0–2.0 | 971 | $1,671 | $1.72 | 2d | 12 | 0.90mi |
| 1423 Hollywood Ave Grosse Pointe Woods, MI | 2.0 | 1.5 | 2050 | $2,100 | $1.02 | 2d | 1 | 0.99mi |
| 19203 Edgefield St Harper Woods, MI | 2.0 | 1.0 | 1100 | $1,100 | $1.00 | 24d | 1 | 1.02mi |
| 20461 Kingsville St Harper Woods, MI | 4.0 | 1.0 | 1100 | $1,399 | $1.27 | 15d | 1 | 1.08mi |
| 19168 Berden St Grosse Pointe, MI | 3.0 | 1.0 | 1200 | $1,800 | $1.50 | 2d | 1 | 1.12mi |
| 1150 Anita Ave Grosse Pointe Woods, MI | 3.0 | 1.5 | 1129 | $2,600 | $2.30 | 10d | 1 | 1.12mi |
| 1150 Anita Ave Grosse Pointe Woods, MI | 3.0 | 1.5 | 1829 | $2,600 | $1.42 | 44d | 1 | 1.12mi |
| 20926 Moross Rd Grosse Pointe, MI | 3.0 | 1.0 | 1200 | $1,350 | $1.12 | 44d | 1 | 1.18mi |
| 10870 Marne St Detroit, MI | 3.0 | 1.0 | 1156 | $1,100 | $0.95 | 17d | 1 | 1.37mi |
| 19000 Chandler Park Dr Grosse Pointe, MI | 2.0 | 1.0 | 1374 | $2,300 | $1.67 | 4d | 1 | 1.39mi |
| 19000 Chandler Park Dr Grosse Pointe, MI | 2.0 | 1.0 | 1374 | $2,300 | $1.67 | 2d | 1 | 1.39mi |
| 22126 Alger St Saint Clair Shores, MI | 2.0 | 1.5 | 1060 | $1,750 | $1.65 | 11d | 1 | 1.41mi |
| 6301 Lodewyck St Detroit, MI | 3.0 | 1.0 | 1084 | $1,300 | $1.20 | 12d | 1 | 1.43mi |
| 18808 Eastwood Dr Harper Woods, MI | 2.0 | 1.0 | 2021 | $1,500 | $0.74 | 24d | 1 | 1.44mi |
| 19435 McCormick St Detroit, MI | 3.0 | 2.0 | 1148 | $1,300 | $1.13 | 17d | 1 | 1.44mi |
Listing history 45 events
-
2026-06-13statusdays on market $299,000 Pending 55 DOM
-
2026-06-09days on market $299,000 Active Under Contract 53 DOM
-
2026-06-08days on market $299,000 Active Under Contract 52 DOM
-
2026-06-07days on market $299,000 Active Under Contract 51 DOM
-
2026-06-04days on market $299,000 Active Under Contract 48 DOM
-
2026-06-03days on market $299,000 Active Under Contract 47 DOM
-
2026-06-02statusdays on market $299,000 Active Under Contract 46 DOM
-
2026-06-01days on market $299,000 Active 45 DOM
-
2026-05-31days on market $299,000 Active 44 DOM
-
2026-04-17$299,000 Active 732-char remark
Show marketing remark (738 chars)
3 bedrooms 1.5 bath colonial with Grosse Pointe Public Schools. Welcome to this charming and well maintained brick colonial located east of Mack Avenue. Step inside to find a bright and spacious layout featuring a large living room with a cozy fireplace-ideal for relaxing evenings. The open concept kitchen flows into the dining area and living room creating a space for entertaining or staying connected with family and friends. The kitchen and bathrooms have been nicely updated. Underneath the carpeting you will find hardwood floors. Enjoy additional living and entertaining space with both a spacious family room and a deck-perfect for gathering and relaxing. Upstairs is 3 nicely sized bedrooms. Don’t miss this special home.
-
2026-04-17$299,000 Active 738-char remark
Show marketing remark (738 chars)
3 bedrooms 1.5 bath colonial with Grosse Pointe Public Schools. Welcome to this charming and well maintained brick colonial located east of Mack Avenue. Step inside to find a bright and spacious layout featuring a large living room with a cozy fireplace-ideal for relaxing evenings. The open concept kitchen flows into the dining area and living room creating a space for entertaining or staying connected with family and friends. The kitchen and bathrooms have been nicely updated. Underneath the carpeting you will find hardwood floors. Enjoy additional living and entertaining space with both a spacious family room and a deck-perfect for gathering and relaxing. Upstairs is 3 nicely sized bedrooms. Don’t miss this special home.
-
2025-10-07soldstatus $115,000
-
2023-11-07historical
-
2023-11-07historical
-
2023-10-28price $246,000
-
2023-10-27price $246,000
-
2023-10-27status Active
-
2023-10-27status Active
-
2023-10-17status Pending
-
2023-10-17status Pending
-
2023-10-11$249,000 Active
-
2023-10-11$249,000 Active
-
2015-03-27soldstatus $115,000
-
2015-03-23soldstatus $115,000
-
2015-03-23soldstatus $115,000
-
2015-03-23soldstatus $115,000 Closed
-
2015-01-24price $108,500
-
2014-08-22historical
-
2014-08-14$128,500
-
2014-08-14$128,500
-
2014-08-14$128,500
-
2008-09-29soldstatus $155,000
-
2008-08-28soldstatus $155,000
-
2008-08-01historical
-
2008-04-14$159,000
-
2008-04-11historical
-
2007-12-02$179,900
-
2007-11-03historical
-
2007-11-03historical
-
2007-05-07$179,900
-
2007-05-07$187,000
-
2001-05-23soldstatus $182,900
-
2001-03-26soldstatus $182,900
-
2001-03-19historical
-
2000-11-10$186,900
ⓘ Source: listings_history table (triggers on properties + properties_extension) + one-shot
backfill from property_details.listing_events for pre-trigger history.
Tax reassessment forecast MI · Partial reset (capped growth)
- Current annual tax
- $1,311 · $109/mo
- Projected year-2 tax
- $2,958 · $246/mo
- Expected delta
- +$1,647/yr (+$137/mo · 125.7%)
ⓘ Screening estimate from a state-policy table — verify with the county assessor before closing.
Climate risk First Street
- Flood 1/10 Low FEMA zone X (unshaded) · 0% chance over 30 yrs
- Wildfire 1/10 Low
- Heat 3/10 Moderate 7 d/yr ≥96°F today · 15 d/yr by 30 yrs out
- Wind 2/10 Low
- Air quality 3/10 Moderate 3 unhealthy d/yr today · 4 by 30 yrs out
Nearby sold comps map
Loading sold comps map…
Walkable amenities ~0.75 mi
Loading nearby amenities…
Taxation est. · year 1
- Rental income
- $23,365
- − Mortgage interest
- −$16,749
- − Property taxes
- −$1,311
- − Insurance
- −$1,495
- − Repairs & maintenance
- −$1,869
- − Management
- −$1,869
- − Depreciation
- −$8,698
- Taxable loss
- −$8,626
- Est. tax savings @ 24.0%
- +$2,070
- After-tax cash flow
- $-1,093/yr
For passive investors: Depreciation is non-cash, so a rental often shows a tax loss while cash-flowing — sheltering income. Rental losses are passive: they offset passive income freely, and up to $25,000/yr can offset ordinary (W-2) income if you actively participate and your MAGI is under $100k (phasing out to $0 by $150k); unused losses carry forward. On sale, claimed depreciation is recaptured at up to 25%, and gains may owe capital-gains tax (a 1031 exchange can defer both). Figures are a year-1 estimate at your 24.0% rate — not tax advice; consult a CPA.
Schools (NCES district)
- District
- Grosse Pointe Public Schools
- NCES district ID
- 2625740
- Math proficiency
- 56% ▼ -2.00%
- Reading proficiency
- 68% ▲ 2.00%
- Median HH income
- $89,975
- Composite
- 56.51/100
- National rank
- #1152
- State rank
- #24 of 540 in MI
Livability — Harper Woods
- Score
- 73/100
- State rank
- #199
- US rank
- #5054
Category grades
Schools grade is shown separately in the Schools card above.
Census & demographics
- Census place
- Harper Woods, MI
- County
- Wayne County · 1,562,939 people
- City population
- 16,098
- Metro
- Detroit-Warren-Dearborn, MI
- Population (ZIP)
- 16,098
- Household income
- $61,750
- Rent vs Own
- Severe rent burden
- 410.0
Population outlook (Wayne County) Hauer SSP2
- Today (2025)
- 1,675,273 people
- By 2030
- 1,620,300 · -3.3%
- By 2040
- 1,502,341 · -10.3%
- By 2050
- 1,384,039 · -17.4%
- By 2075
- 1,124,592 · -32.9%
- By 2100
- 881,193 · -47.4%
Race, ethnicity, and origin ACS 2023
- Neighborhood character
- Predominantly Black (65%)
- Race & ethnicity
- Black 65% White 28% Two or more races 4% Hispanic / Latino 1%
- Common ancestry
- Romanian 4% Lithuanian 1% German 1%
- Foreign-born
- 2% · Canada
- Languages at home
- 95% English-only · Arabic 2% Spanish 1%
Political lean MEDSL · Wayne
- 2024 margin
- Strong D (+29.0) · D 62.7% · R 33.7% · Other 3.6%
- 2008→2024 swing
- -20.5pp toward R · 2008: 49.5pp · 2024: 29.0pp
- All cycles
- 2024: D+29.0 2020: D+38.1 2016: D+37.3 2012: D+46.9 2008: D+49.5
Not yet ingested
- Civics
- —
Market trends
- HPI YoY
- ▼ -150.40%
- Current HPI
- 181.4961
- Rent YoY
- ▲ 5.10%
- Metro
- Detroit-Warren-Dearborn, MI
- State GDP YoY
- ▲ 1.37%
- F500 in state
- 28
Industry mix (Fortune 500 HQ in MI)
| Industry | F500 HQs | Revenue |
|---|---|---|
| Automotive Parts | 3 | $48B |
|
||
| Automotive | 2 | $372B |
|
||
| Chemicals | 1 | $45B |
|
||
| Automotive Retail | 1 | $29B |
|
||
| Healthcare / Medical Devices | 1 | $23B |
|
||
| Automotive Technology | 1 | $20B |
|
||
Price history
+60.0% since first listed36 events — show timeline
- 2026-04-17 Listed $299,000 MiRealSource-MiMLS
- 2026-04-17 Listed $299,000 REALCOMP
- 2025-10-07 Sold (Public Records) $115,000 Public Records
- 2023-11-07 Listing Removed — MiRealSource-MiMLS
- 2023-11-07 Listing Removed — REALCOMP
- 2023-10-28 Price Changed $246,000 MiRealSource-MiMLS
- 2023-10-27 Price Changed $246,000 REALCOMP
- 2023-10-27 Relisted — MiRealSource-MiMLS
- 2023-10-27 Relisted — REALCOMP
- 2023-10-17 Pending — MiRealSource-MiMLS
- 2023-10-17 Pending — REALCOMP
- 2023-10-11 Listed $249,000 MiRealSource-MiMLS
- 2023-10-11 Listed $249,000 REALCOMP
- 2015-03-27 Sold (Public Records) $115,000 Public Records
- 2015-03-23 Sold (MLS) $115,000 MiRealSource-MiMLS
- 2015-03-23 Sold (MLS) $115,000 MiRealSource-MiMLS
- 2015-03-23 Sold (MLS) $115,000 REALCOMP
- 2015-01-24 Price Changed $108,500 MiRealSource-MiMLS
- 2014-08-22 Listing Removed — MiRealSource-MiMLS
- 2014-08-14 Listed $128,500 MiRealSource-MiMLS
- 2014-08-14 Listed $128,500 MiRealSource-MiMLS
- 2014-08-14 Listed $128,500 REALCOMP
- 2008-09-29 Sold (Public Records) $155,000 Public Records
- 2008-08-28 Sold (MLS) $155,000 MiRealSource-MiMLS
- 2008-08-01 Listing Removed — MiRealSource-MiMLS
- 2008-04-14 Listed $159,000 MiRealSource-MiMLS
- 2008-04-11 Listing Removed — MiRealSource-MiMLS
- 2007-12-02 Listed $179,900 MiRealSource-MiMLS
- 2007-11-03 Listing Removed — REALCOMP
- 2007-11-03 Listing Removed — MiRealSource-MiMLS
- 2007-05-07 Listed $187,000 REALCOMP
- 2007-05-07 Listed $179,900 MiRealSource-MiMLS
- 2001-05-23 Sold (Public Records) $182,900 Public Records
- 2001-03-26 Sold (MLS) $182,900 MiRealSource-MiMLS
- 2001-03-19 Listing Removed — MiRealSource-MiMLS
- 2000-11-10 Listed $186,900 MiRealSource-MiMLS
Property tax history
-6.4%/yrLatest (2025): $1,311 · -74.5% YoY. Source: county tax records.
Cash-flow waterfall
monthlySold comps — $/sqft
last 12 mo · ≤1 miLoading sold comps…