209 Peach St · South Mills, NC
Flood risk No data
- FEMA flood zone
- —
- Chance of flooding over 30 yrs
- —
- Est. flood insurance / yr
- —
Fire risk No data
- Est. fire insurance / yr
- —
Heat risk No data
- Hot days now (above threshold)
- —
- Hot days in 30 yrs
- —
Wind risk No data
- Chance of severe wind over 30 yrs
- —
Air-quality risk No data
- Unhealthy air days now
- —
- Unhealthy air days in 30 yrs
- —
Risk factors via First Street. Map © Google.
Why this score? — see what drove the C+ grade
The composite is a weighted blend of 9 inputs, each scored 0–100. Each bar is that input's sub-score; the figure is the points it added to the 100-point composite (weight × sub-score).
- Cash flow +20.8/30.0
- ARV discount +12.8/15.0
- DSCR +6.6/10.0
- 1% rule +5.9/10.0
- Schools +5.2/10.0
- Appreciation +4.8/10.0
- Livability +2.9/5.0
- Rent growth +2.5/5.0
- Condition / age +2.5/5.0
$302,855
🖨 Deal sheet 📄 Offer letter ✓ Due diligence
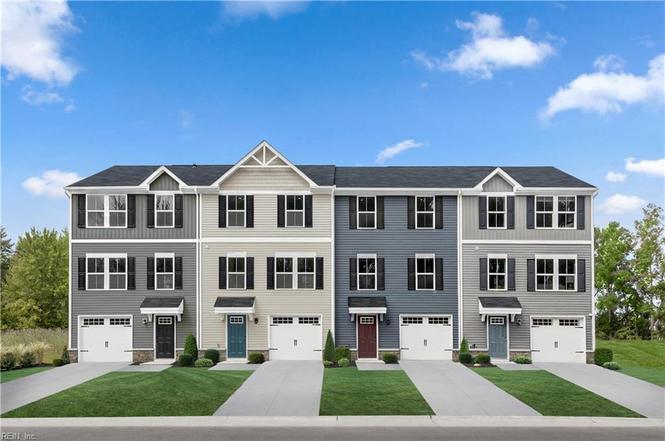
Listing remarks
The Juniper townhome combines all the amenities of single-family living with total convenience. The main level is highlighted by a gourmet kitchen that's open to the living area so you'll never miss a moment. Choose the optional island for more workspace. A dining area provides room for entertaining or cozy evenings at home. Upstairs, three large bedrooms offer plenty of closet space and a generous hall bath. The luxury owner's suite is a quiet retreat with its own full bath and huge walk-in closet. The lower level provides plenty of storage space. Discover all The Juniper has to offer.
Key facts
- $100 HOA
- Garage
- Built 2026
Neighborhood map
What this means for you Summary
Snapshot
- This is a 3-bed/3.0-bath townhouse listed at $303k.
Deal economics
- At list price, monthly cash flow is $414 ($5k/yr) — positive.
- The deal already cash-flows at list — no discount required.
- Meets the 1% rule at list price ($3k rent vs $303k).
- Cap rate 7.9% vs local median 5.0% in South Mills — top-decile yield for the area; either an underpriced asset or a hidden risk that comps aren't pricing in. Stress-test before assuming the spread holds.
Location & tenants
- Location reads 57/100 on livability (#612 in NC) — a working-class tenant base; expect higher turnover. Strengths: cost of living A+, crime A, housing A; Watch: amenities F, commute F, employment F.
- Camden County Schools (rural): math 56% / reading 64% proficiency, ranked #29 of 178 in NC (top 16%) — acceptable for families but not a draw, mixed tenant base, ~2y average lease.
- Zoned schools: Grandy Primary (math 87% / reading 72%, grade A, #24 of 1,410 statewide, top 2%, 607 students, 32% FRL); Camden County High (math 62% / reading 62%, grade B-, #184 of 535 statewide, top 37%, 464 students, 25% FRL).
- Market conditions: 86 active listings in the ZIP; 1 comparable units currently listed for rent nearby; 105 units permitted in Camden County in 2024 (0 in 5+ unit buildings).
Forward outlook
- In year one you build about $909 of equity ($2k loan paydown + $-1k appreciation (-0.4% local appreciation)).
- Camden County population projected at +5% by 2050 — modest demand growth; plan on rents tracking national, not racing it.
- At projected returns (-0.4% appreciation + 3.0% rent growth), your $85k cash investment doubles in ~9 years — after that, you're playing with house money.
Negotiation context
- Only 0 days on market — expect competitive offers; lowballing is unlikely to land.
Questions for the listing agent
- What does the HOA fee cover, when was the last increase, and are there any pending special assessments or reserve-fund shortfalls?
- Is there a deadline driving the sale (1031 exchange, divorce, estate, relocation)? That informs how much negotiation room exists.
- Schools are D-rated, which usually means shorter tenancies and higher turnover. Who's the typical renter profile here, and what's been the actual vacancy rate?
- What's the average days-on-market for RENTAL listings here right now (not sales)? A rising rental-DOM trend means longer vacancies and softer asking-rent achievability than the comps imply.
- What's the recent tenant-quality profile in this submarket — average credit score on applications, eviction rate, late-payment / NSF rate, and stable-employment percentage? A property-management company in the area should have these aggregated.
- How much new for-sale + rental construction is in the pipeline within 1–3 miles? Heavy new supply typically softens prices + rents 12–24 months out; constrained supply supports both.
Investment metrics
- 1% rule
- 1.09% ✓
- Cap rate
- 7.93%
- Cash-on-cash
- 5.86%
- DSCR
- 1.26
- GRM
- 7.6
CMA / ARV
- ARV (on-the-fly)
- $343,520
- Comps found
- 12
Show comp detail 12 sales within ~0.75 mi
| Address | Dist | Beds/Ba | Sqft | Sold | Price | $/sf | Match |
|---|---|---|---|---|---|---|---|
| 204 Peach St | 0.00mi | 3/2.5 | 1,307 (-14%) | 1mo | $289,680 | $222 | 74 |
| 210 Peach St | 0.47mi | 3/2.5 | 1,520 (0%) | 2mo | $296,310 | $195 | 74 |
| 102 Tee Olive St | 0.00mi | 3/2.5 | 1,307 (-14%) | 1mo | $294,990 | $226 | 74 |
| 206 Peach St | 0.00mi | 3/2.5 | 1,307 (-14%) | 2mo | $289,405 | $221 | 73 |
| 202 Peach St | 0.00mi | 3/2.5 | 1,307 (-14%) | 2mo | $315,150 | $241 | 73 |
| 216 Peach St | 0.49mi | 3/2.5 | 1,520 (0%) | 3mo | $313,485 | $206 | 73 |
| 208 Peach St | 0.00mi | 3/2.5 | 1,307 (-14%) | 2mo | $289,520 | $222 | 73 |
| 220 Peach St | 0.00mi | 3/2.5 | 1,307 (-14%) | 3mo | $302,360 | $231 | 72 |
| 218 Peach St | 0.00mi | 3/2.5 | 1,307 (-14%) | 3mo | $303,450 | $232 | 72 |
| 226 Peach St | 0.00mi | 3/2.5 | 1,307 (-14%) | 3mo | $314,450 | $241 | 72 |
| 214 Peach St | 0.45mi | 3/2.5 | 1,307 (-14%) | 3mo | $293,910 | $225 | 51 |
| 112 Tee Olive St | 0.49mi | 3/2.5 | 1,311 (-14%) | 3mo | $330,990 | $252 | 50 |
Match score weights: distance 35% · size 25% · config 20% · recency 20%. Top-matched comps best support the ARV.
Projected returns pro-forma
-0.39% appreciation · 3.0% rent growth · sell at horizon
- IRR
- 3.1%
- Equity multiple
- 1.14×
- Total profit
- $12,094
- Equity at exit
- $82,059
- IRR
- 8.9%
- Equity multiple
- 1.93×
- Total profit
- $78,536
- Equity at exit
- $94,061
Cash invested: $84,799 (down + closing). Projections, not guarantees.
Landlord ↔ Tenant lean methodology
- Overall (STATE)
- 85 Strongly Landlord-Friendly
- State North Carolina
- 85 Strongly Landlord-Friendly · R+3
- County
- — inherits STATE
- City
- — inherits STATE
ZIP-level market 27976
- Home prices YoY
- -0.2%
- Active inventory
- 86
- Price-to-rent
- 7.6×
Monthly cashflow live
- Estimated rent
- $3,300 medium interval (Pro) →
- Mortgage (P&I)
- −$1,588
- Tax est. 1.5%
- −$379 /mo · $4,543/yr
- Insurance
- −$126
- HOA
- −$100
- Vacancy / Maint / Mgmt
- −$693
- Net cashflow
- $414
Break-even live
UW: 25.0% down · 7.5% · 30yr · 1.5% tax · 5.0% vac · 8.0% maint · 8.0% mgmt
Financing live
Cash to close
- Down payment
- $75,714
- Closing costs
- $9,086
- Reserves months
- —
- Total cash needed
- —
Loan-product check · same deal, 3 products live
Conventional
25% down · 7.5% · 30yr
- Down + closing
- —
- Monthly P&I
- —
- Monthly cashflow
- —
- DSCR
- —
- Eligible?
- —
Personal DTI + credit; lowest rate.
DSCR
20% down · 8.5% · 30yr
- Down + closing
- —
- Monthly P&I
- —
- Monthly cashflow
- —
- DSCR
- —
- Eligible?
- —
No personal income docs; deal must DSCR.
Hard money
10% down · 12.0% · 12mo
- Down + closing
- —
- Monthly P&I
- —
- Monthly cashflow
- —
- DSCR
- —
- Eligible?
- —
Short-term bridge; refi at stabilization.
Rent comps 1 comps
| Address | Beds | Baths | Sqft | Rent | $/sqft | DOM | Units | Dist |
|---|---|---|---|---|---|---|---|---|
| 125 Pampas ST South Mills, NC | 4.0 | 2.5 | 1903 | $3,300 | $1.73 | 1d | 1 | 0.44mi |
HOA detail
- Monthly dues
- $100 · $1,200/yr
Listing history 2 events
-
2026-01-02$302,855
-
2026-01-02historical
ⓘ Source: listings_history table (triggers on properties + properties_extension) + one-shot
backfill from property_details.listing_events for pre-trigger history.
Nearby sold comps map
Loading sold comps map…
Walkable amenities ~0.75 mi
Loading nearby amenities…
Taxation est. · year 1
- Rental income
- $39,600
- − Mortgage interest
- −$16,965
- − Property taxes
- −$4,543
- − Insurance
- −$1,514
- − Repairs & maintenance
- −$3,168
- − Management
- −$3,168
- − HOA
- −$1,200
- − Depreciation
- −$8,810
- Taxable income
- $232
- Est. tax owed @ 24.0%
- −$56
- After-tax cash flow
- $4,913/yr
For passive investors: Depreciation is non-cash, so a rental often shows a tax loss while cash-flowing — sheltering income. Rental losses are passive: they offset passive income freely, and up to $25,000/yr can offset ordinary (W-2) income if you actively participate and your MAGI is under $100k (phasing out to $0 by $150k); unused losses carry forward. On sale, claimed depreciation is recaptured at up to 25%, and gains may owe capital-gains tax (a 1031 exchange can defer both). Figures are a year-1 estimate at your 24.0% rate — not tax advice; consult a CPA.
Schools (NCES district)
- District
- Camden County Schools
- NCES district ID
- 3700600
- Math proficiency
- 56% ▲ 8.00%
- Reading proficiency
- 64% ▲ 4.00%
- Median HH income
- $59,622
- Composite
- 51.97/100
- National rank
- #1643
- State rank
- #29 of 178 in NC
Livability — South Mills
- Score
- 57/100
- State rank
- #612
- US rank
- #22229
Category grades
Schools grade is shown separately in the Schools card above.
Census & demographics
- Census place
- South Mills, NC
- Population (ZIP)
- 4,237
Population outlook (Camden County) Hauer SSP2
- Today (2025)
- 10,980 people
- By 2030
- 11,246 · +2.4%
- By 2040
- 11,562 · +5.3%
- By 2050
- 11,572 · +5.4%
- By 2075
- 11,450 · +4.3%
- By 2100
- 10,648 · -3.0%
Race, ethnicity, and origin ACS 2023
- Neighborhood character
- Predominantly White (79%)
- Race & ethnicity
- White 79% Two or more races 8% Black 8% Hispanic / Latino 6%
- Hispanic origin (detail)
- Mexican 2% Puerto Rican 1%
- Common ancestry
- Scotch-Irish 4% Portuguese 3% Romanian 3%
- Languages at home
- 98% English-only · Arabic 1%
Political lean MEDSL · Camden
- 2024 margin
- Solid R (+50.8) · D 24.2% · R 75.0%
- 2008→2024 swing
- -18.8pp toward R · 2008: -32.0pp · 2024: -50.8pp
- All cycles
- 2024: R+50.8 2020: R+46.6 2016: R+45.8 2012: R+34.0 2008: R+32.0
Not yet ingested
- Civics
- —
Market trends
- HPI YoY
- ▼ -0.39%
- Current HPI
- 174.2102
- Rent YoY
- —
- Metro
- —
- State GDP YoY
- ▲ 3.28%
- F500 in state
- 26
Industry mix (Fortune 500 HQ in NC)
| Industry | F500 HQs | Revenue |
|---|---|---|
| Financial Services | 2 | $213B |
|
||
| Retail | 2 | $95B |
|
||
| Industrial Conglomerate | 1 | $38B |
|
||
| Metals / Steel | 1 | $35B |
|
||
| Utilities | 1 | $30B |
|
||
| Industrial Machinery | 1 | $19B |
|
||
Price history
2 events — show timeline
- 2026-01-02 Listing Removed — REINMLS
- 2026-01-02 Listed $302,855 REINMLS
Cash-flow waterfall
monthlySold comps — $/sqft
last 12 mo · ≤1 miLoading sold comps…