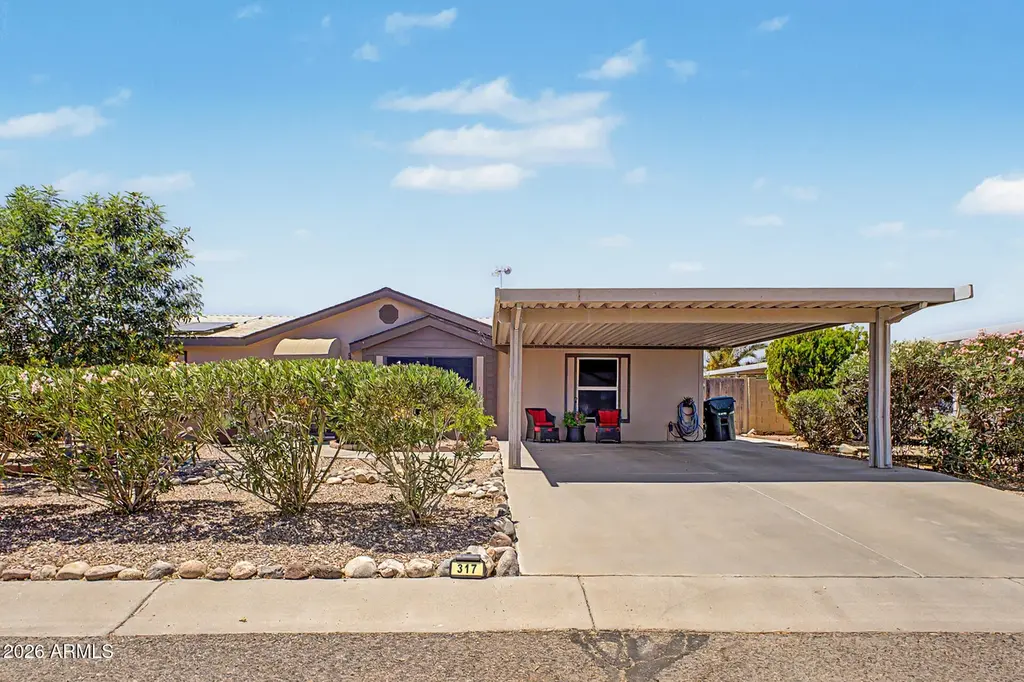
16101 N El Mirage Rd #317 · El Mirage, AZ
Flood risk 1/10 · Minimal
- FEMA flood zone
- X (shaded)
- Chance of flooding over 30 yrs
- 0.0%
- Est. flood insurance / yr
- $507 – $1,088
Fire risk 4/10 · Minor
- Est. fire insurance / yr
- $610 – $1,132
Heat risk 9/10 · Severe
- Hot days now (above 114°F)
- 7 days/yr
- Hot days in 30 yrs
- 18 days/yr
Wind risk 1/10 · Minimal
- Chance of severe wind over 30 yrs
- —
Air-quality risk 2/10 · Minimal
- Unhealthy air days now
- 1 days/yr
- Unhealthy air days in 30 yrs
- 1 days/yr
Risk factors via First Street. Map © Google.
Why this score? — see what drove the C+ grade
The composite is a weighted blend of 9 inputs, each scored 0–100. Each bar is that input's sub-score; the figure is the points it added to the 100-point composite (weight × sub-score).
- Cash flow +30.0/30.0
- 1% rule +10.0/10.0
- DSCR +10.0/10.0
- Condition / age +4.0/5.0
- Schools +3.3/10.0
- Livability +3.2/5.0
- Rent growth +2.5/5.0
- ARV discount +0.0/15.0
- Appreciation +0.0/10.0
$129,000
🖨 Deal sheet 📄 Offer letter ✓ Due diligence
Listing remarks
This adorable 3-bedroom, 2-bathroom home features a popular split floor plan and fantastic natural light. Every bedroom includes a generous walk-in closet, and skylights brighten the living spaces throughout. The spacious kitchen offers plenty of room to cook and entertain, complete with a gas range, refrigerator, dishwasher, and a large walk-in pantry. Outside, relax on the screened-in patio, a beautifully manicured front and backyard with mature landscaping, low-maintenance artificial grass in the back, and a handy storage shed. Residents enjoy access to an impressive array of resort-style amenities, including a clubhouse with billiards, a fitness center, a heated swimming pool and spa, p
Key facts
- Walk-in closet
- Split floor plan
- Screened-in patio
Tags
Property features AI
Finance
- Other: Property information and building area reported by owner
- HOA & community: No association fees; Land lease: $1,105 monthly; Community pool and heated spa; Pickleball courts; Fitness center
Exterior
- Parking: 2 covered parking spaces; 2 open parking spaces; 2 carport spaces
- Security: Gated community
- Utilities: City water; Public sewer
- Home design: Manufactured/mobile home; Leasehold ownership
- Construction: Wood frame construction; Painted exterior; Composition roof
- Exterior features: Screened-in patio; Storage; Shed(s); Sprinklers front and rear; Synthetic grass in back; Automatic water timers front and back; Desert front and back landscaping; Block fencing
Interior
- Kitchen: Built-in microwave; Laminate counters; Walk-in pantry
- Bedrooms: Up to 3 bedrooms
- Flooring: Carpet; Laminate; Vinyl
- Bathrooms: 2 full bathrooms
- Heating & cooling: Natural gas heating; Central air; Ceiling fans
- Interior features: High-speed internet; Double vanity in bathroom; Eat-in kitchen; No interior steps; Vaulted ceilings; Pantry; Full bathroom in primary bedroom; Separate shower and tub; Skylights; Dual-pane windows; Solar panels
- Laundry & utility: Inside laundry
Neighborhood map
What this means for you Summary
Snapshot
- This is a 3-bed/2.0-bath manufactured listed at $129k. Condition is rated good.
Deal economics
- At list price, monthly cash flow is $647 ($8k/yr) — positive.
- The deal already cash-flows at list — no discount required.
- Meets the 1% rule at list price ($2k rent vs $129k).
- Recommended offer: $125k (3.0% below list) — sets the bar for market timing.
- Cap rate 12.3% vs local median 4.5% in El Mirage — top-decile yield for the area; either an underpriced asset or a hidden risk that comps aren't pricing in. Stress-test before assuming the spread holds.
Location & tenants
- Location reads 63/100 on livability (#112 in AZ) — a middle-class / working-renter tenant base. Strengths: housing A+, cost of living A; Watch: schools D-, amenities F, commute F.
- Dysart Unified District (4243) (suburban): math 34% / reading 40% proficiency, ranked #73 of 249 in AZ (top 29%) — families likely to look elsewhere, expect single-tenant / working-renter base with shorter leases.
- Market conditions: Rents flat; 132 active listings in the ZIP; 39 comparable units currently listed for rent nearby; rentals at typical pace (median 24d on market — plan ~3-4 weeks tenant-placement turnaround); solid renter incomes; 36,011 units permitted in Maricopa County in 2024 (12,801 in 5+ unit buildings).
Forward outlook
- Local home prices are declining (-3.0%/yr); year-one equity from $892 of loan paydown is wiped out by about $4k of value loss. Plan a longer hold.
- Maricopa County population projected at +38% by 2050 — long-run rental-demand tailwind backs the buy-and-hold thesis.
- At projected returns (-3.0% appreciation + 0.1% rent growth), your $36k cash investment doubles in ~7 years — after that, you're playing with house money.
Negotiation context
- It's been on market 37 days — a 3% lower offer ($125k) is reasonable based on typical stale-listing flexibility.
Risks & watch-outs
- Climate carrying-cost: extreme-heat days projected 7→18/yr by 2055 (HVAC capex compounding) — expect insurance premiums to compound above CPI over the hold.
Questions for the listing agent
- It's been on market 37 days. Have you received any prior offers? Is the seller open to a 3% concession, seller financing, or rate buy-down credit?
- Is there a deadline driving the sale (1031 exchange, divorce, estate, relocation)? That informs how much negotiation room exists.
- Schools are D-rated, which usually means shorter tenancies and higher turnover. Who's the typical renter profile here, and what's been the actual vacancy rate?
- What's the average days-on-market for RENTAL listings here right now (not sales)? A rising rental-DOM trend means longer vacancies and softer asking-rent achievability than the comps imply.
- What's the recent tenant-quality profile in this submarket — average credit score on applications, eviction rate, late-payment / NSF rate, and stable-employment percentage? A property-management company in the area should have these aggregated.
- How much new for-sale + rental construction is in the pipeline within 1–3 miles? Heavy new supply typically softens prices + rents 12–24 months out; constrained supply supports both.
Investment metrics
- 1% rule
- 1.51% ✓
- Cap rate
- 12.31%
- Cash-on-cash
- 21.48%
- DSCR
- 1.96
- GRM
- 5.5
CMA / ARV
- ARV (median comp)
- $93,067
- List price
- $129,000
- Delta
- 38.61%
- Verdict
- OVERPRICED
- Comps
- 20 within 1.0 mi
Show comp detail 12 sales within ~0.75 mi
| Address | Dist | Beds/Ba | Sqft | Sold | Price | $/sf | Match |
|---|---|---|---|---|---|---|---|
| 16101 N EL Mirage Rd #434 | 0.08mi | 3/2.0 | 1,430 (-2%) | 6mo | $120,000 | $84 | 89 |
| 16101 N EL Mirage Rd #320 | 0.06mi | 3/2.0 | 1,456 (0%) | 14mo | $135,900 | $93 | 86 |
| 16101 N EL Mirage Rd #425 | 0.00mi | 2/2.0 (-1) | 1,428 (-2%) | 7mo | $97,750 | $68 | 86 |
| 16101 N EL Mirage Rd #378 | 0.06mi | 3/2.0 | 1,377 (-5%) | 4mo | $112,000 | $81 | 85 |
| 16101 N El Mirage Rd #16 | 0.04mi | 3/2.0 | 1,560 (+7%) | 3mo | $150,000 | $96 | 84 |
| 16101 N EL Mirage Rd #371 | 0.09mi | 3/2.0 | 1,344 (-8%) | 0mo | $64,000 | $48 | 83 |
| 16101 N EL Mirage Rd #435 | 0.04mi | 3/2.0 | 1,408 (-3%) | 15mo | $105,000 | $75 | 80 |
| 16101 N EL Mirage Rd #369 | 0.00mi | 3/2.0 | 1,326 (-9%) | 8mo | $85,000 | $64 | 78 |
| 16101 N EL Mirage Rd #426 | 0.12mi | 3/2.0 | 1,568 (+8%) | 7mo | $115,000 | $73 | 76 |
| 16101 N EL Mirage Rd #354 | 0.04mi | 3/2.0 | 1,326 (-9%) | 11mo | $90,000 | $68 | 74 |
| 16101 N EL Mirage Rd #445 | 0.04mi | 3/2.0 | 1,351 (-7%) | 22mo | $92,000 | $68 | 68 |
| 15632 N Greasewood St | 0.43mi | 3/2.0 | 1,352 (-7%) | 20mo | $315,000 | $233 | 51 |
Match score weights: distance 35% · size 25% · config 20% · recency 20%. Top-matched comps best support the ARV.
Projected returns pro-forma
-3.0% appreciation · 0.08% rent growth · sell at horizon
- IRR
- 10.7%
- Equity multiple
- 1.41×
- Total profit
- $14,750
- Equity at exit
- $19,234
- IRR
- 17.3%
- Equity multiple
- 2.23×
- Total profit
- $44,478
- Equity at exit
- $11,154
Cash invested: $36,120 (down + closing). Projections, not guarantees.
Landlord ↔ Tenant lean methodology
- Overall (STATE)
- 87 Strongly Landlord-Friendly
- State Arizona
- 87 Strongly Landlord-Friendly · R+3
- County
- — inherits STATE
- City
- — inherits STATE
ZIP-level market 85335
- Home prices YoY
- -13.3%
- Rents YoY
- 0.1%
- Active inventory
- 132
- Price-to-rent
- 5.5×
Monthly cashflow live
- Estimated rent
- $1,947 high interval (Pro) →
- Mortgage (P&I)
- −$676
- Tax est. 1.5%
- −$161 /mo · $1,935/yr
- Insurance
- −$54
- HOA
- −$0
- Vacancy / Maint / Mgmt
- −$409
- Net cashflow
- $647
Break-even live
UW: 25.0% down · 7.5% · 30yr · 1.5% tax · 5.0% vac · 8.0% maint · 8.0% mgmt
Financing live
Cash to close
- Down payment
- $32,250
- Closing costs
- $3,870
- Reserves months
- —
- Total cash needed
- —
Loan-product check · same deal, 3 products live
Conventional
25% down · 7.5% · 30yr
- Down + closing
- —
- Monthly P&I
- —
- Monthly cashflow
- —
- DSCR
- —
- Eligible?
- —
Personal DTI + credit; lowest rate.
DSCR
20% down · 8.5% · 30yr
- Down + closing
- —
- Monthly P&I
- —
- Monthly cashflow
- —
- DSCR
- —
- Eligible?
- —
No personal income docs; deal must DSCR.
Hard money
10% down · 12.0% · 12mo
- Down + closing
- —
- Monthly P&I
- —
- Monthly cashflow
- —
- DSCR
- —
- Eligible?
- —
Short-term bridge; refi at stabilization.
Rent comps 39 comps
| Address | Beds | Baths | Sqft | Rent | $/sqft | DOM | Units | Dist |
|---|---|---|---|---|---|---|---|---|
| 12134 W Ironwood St El Mirage, AZ | 3.0 | 2.0 | 1680 | $1,950 | $1.16 | 24d | 1 | 0.13mi |
| 12121 W Ironwood St El Mirage, AZ | 3.0 | 2.0 | 1680 | $1,999 | $1.19 | 24d | 1 | 0.17mi |
| 15620 N El Mirage Rd Surprise, AZ | 3.0 | 2.5 | 1310 | $1,599 | $1.22 | 24d | 2 | 0.27mi |
| 15427 N Jerry St Surprise, AZ | 2.0 | 1.5 | 920 | $1,450 | $1.58 | 5d | 1 | 0.37mi |
| 16520 N Greasewood St Surprise, AZ | 2.0–3.0 | 2.5 | 1267 | $1,850 | $1.46 | 1d | 17 | 0.50mi |
| 16629 N Greasewood St Surprise, AZ | 2.0 | 1.5 | 1052 | $1,462 | $1.39 | 1d | 3 | 0.51mi |
| 15109 N Verbena St El Mirage, AZ | 4.0 | 2.0 | 1642 | $1,869 | $1.14 | 43d | 1 | 0.60mi |
| 12817 W Cottonwood St Surprise, AZ | 2.0 | 1.0 | 1795 | $1,300 | $0.72 | 3d | 1 | 0.77mi |
| 14715 N 124th Ave El Mirage, AZ | 4.0 | 2.0 | 1534 | $2,010 | $1.31 | 43d | 1 | 0.77mi |
| 14809 N El Frio Cir El Mirage, AZ | 4.0 | 2.0 | 1459 | $2,199 | $1.51 | 21d | 1 | 0.78mi |
| 14809 N El Frio Cir El Mirage, AZ | 4.0 | 2.0 | 1700 | $2,300 | $1.35 | 24d | 1 | 0.78mi |
| 12438 W Hearn Rd El Mirage, AZ | 3.0 | 2.0 | 1308 | $1,595 | $1.22 | 23d | 1 | 0.82mi |
| 14815 N Tonya Cir El Mirage, AZ | 4.0 | 2.0 | 1642 | $2,040 | $1.24 | 43d | 1 | 0.84mi |
| 12437 W Via Camille El Mirage, AZ | 3.0 | 2.0 | 1534 | $1,875 | $1.22 | 16d | 1 | 0.86mi |
| 11759 W Banff Ln El Mirage, AZ | 4.0 | 2.5 | 1495 | $2,000 | $1.34 | 43d | 1 | 0.92mi |
| 12532 W Saint Moritz Ln El Mirage, AZ | 4.0 | 2.0 | 1534 | $1,875 | $1.22 | 5d | 1 | 0.97mi |
| 12945 W Greenway Rd El Mirage, AZ | 2.0 | 2.0 | 1060 | $1,300 | $1.23 | 23d | 4 | 0.99mi |
| 12574 W Lisbon Ln El Mirage, AZ | 3.0 | 2.0 | 1058 | $1,700 | $1.61 | 4d | 1 | 1.03mi |
| 11402 W Hutton Dr Surprise, AZ | 4.0 | 2.0 | 1600 | $1,800 | $1.12 | 24d | 1 | 1.07mi |
| 12537 W Redfield Rd El Mirage, AZ | 3.0 | 2.0 | 1600 | $1,795 | $1.12 | 24d | 1 | 1.07mi |
| 11417 W Amber Trl Surprise, AZ | 3.0 | 2.0 | 1130 | $1,750 | $1.55 | 5d | 1 | 1.09mi |
| 15426 N Cactus Ln Surprise, AZ | 3.0 | 1.0 | 1376 | $1,634 | $1.19 | 43d | 1 | 1.09mi |
| 11345 W Loma Blanca Dr Surprise, AZ | 3.0 | 2.0 | 1368 | $1,930 | $1.41 | 43d | 1 | 1.11mi |
| 16608 N 113th Dr Surprise, AZ | 4.0 | 2.0 | 1571 | $1,900 | $1.21 | 43d | 1 | 1.14mi |
| 11755 W Thompson Ranch Rd El Mirage, AZ | 1.0–3.0 | 1.0–2.0 | 936 | $2,771 | $2.96 | 1d | 1 | 1.23mi |
| 13227 W Port au Prince Ln Surprise, AZ | 3.0 | 2.0 | 1522 | $1,759 | $1.16 | 23d | 1 | 1.33mi |
| 13227 W Port au Prince Ln Surprise, AZ | 3.0 | 2.0 | 1522 | $1,709 | $1.12 | 14d | 1 | 1.33mi |
| 17590 N 114th Ln Surprise, AZ | 3.0 | 2.5 | 1737 | $1,695 | $0.98 | 24d | 1 | 1.38mi |
| 17590 N 114th Ln Surprise, AZ | 3.0 | 3.0 | 1737 | $1,695 | $0.98 | 5d | 1 | 1.38mi |
| 17447 Avenue of the Arts Unit 3 Surprise, AZ | 3.0 | 2.0 | 1183 | $1,822 | $1.54 | 24d | 1 | 1.38mi |
| 17447 Avenue of the Arts Unit 2 Surprise, AZ | 2.0 | 2.0 | 1078 | $1,732 | $1.61 | 24d | 1 | 1.38mi |
| 17447 N Avenue of the Arts Surprise, AZ | 2.0 | 2.0 | 1078 | $1,813 | $1.68 | 12d | 1 | 1.44mi |
| 17447 N Avenue of the Arts Surprise, AZ | 3.0 | 2.0 | 1183 | $1,981 | $1.67 | 1d | 1 | 1.44mi |
| 13002 W Hearn Rd El Mirage, AZ | 3.0 | 2.0 | 1518 | $1,795 | $1.18 | 10d | 1 | 1.44mi |
| 13217 W Mauna Loa Ln Surprise, AZ | 3.0 | 2.0 | 1672 | $1,900 | $1.14 | 1d | 1 | 1.45mi |
| 13342 W Canyon Creek Dr Surprise, AZ | 3.0 | 2.0 | 1419 | $1,750 | $1.23 | 24d | 1 | 1.45mi |
| 12022 W Ash St El Mirage, AZ | 3.0 | 2.0 | 1040 | $1,800 | $1.73 | 24d | 1 | 1.45mi |
| 14417 N Gil Balcome Surprise, AZ | 3.0 | 2.0 | 1446 | $1,900 | $1.31 | 5d | 1 | 1.49mi |
| 12430 W Willow Ave El Mirage, AZ | 3.0 | 2.0 | 1183 | $5,900 | $4.99 | 4d | 1 | 1.49mi |
Listing history 14 events
-
2026-06-18days on market $129,000 Active 37 DOM
-
2026-06-17days on market $129,000 Active 36 DOM
-
2026-06-16days on market $129,000 Active 35 DOM
-
2026-06-15days on market $129,000 Active 34 DOM
-
2026-06-13days on market $129,000 Active 32 DOM
-
2026-06-09days on market $129,000 Active 28 DOM
-
2026-06-08days on market $129,000 Active 27 DOM
-
2026-06-07days on market $129,000 Active 26 DOM
-
2026-06-04days on market $129,000 Active 23 DOM
-
2026-06-03days on market $129,000 Active 22 DOM
-
2026-06-02days on market $129,000 Active 21 DOM
-
2026-06-01days on market $129,000 Active 20 DOM
-
2026-05-31days on market $129,000 Active 19 DOM
-
2026-05-08$129,000 Active 747-char remark
ⓘ Source: listings_history table (triggers on properties + properties_extension) + one-shot
backfill from property_details.listing_events for pre-trigger history.
Climate risk First Street
- Flood 1/10 Low FEMA zone X (shaded) · 0% chance over 30 yrs
- Wildfire 4/10 Moderate
- Heat 9/10 Extreme 7 d/yr ≥114°F today · 18 d/yr by 30 yrs out
- Wind 1/10 Low
- Air quality 2/10 Low 1 unhealthy d/yr today · 1 by 30 yrs out
Nearby sold comps map
Loading sold comps map…
Walkable amenities ~0.75 mi
Loading nearby amenities…
Taxation est. · year 1
- Rental income
- $23,363
- − Mortgage interest
- −$7,226
- − Property taxes
- −$1,935
- − Insurance
- −$645
- − Repairs & maintenance
- −$1,869
- − Management
- −$1,869
- − Depreciation
- −$3,753
- Taxable income
- $6,066
- Est. tax owed @ 24.0%
- −$1,456
- After-tax cash flow
- $6,303/yr
For passive investors: Depreciation is non-cash, so a rental often shows a tax loss while cash-flowing — sheltering income. Rental losses are passive: they offset passive income freely, and up to $25,000/yr can offset ordinary (W-2) income if you actively participate and your MAGI is under $100k (phasing out to $0 by $150k); unused losses carry forward. On sale, claimed depreciation is recaptured at up to 25%, and gains may owe capital-gains tax (a 1031 exchange can defer both). Figures are a year-1 estimate at your 24.0% rate — not tax advice; consult a CPA.
Condition & rehab AI · 30 photos
This well-maintained, split-floor plan home is move-in ready with good condition and potential for further value through cosmetic updates.
Value-add opportunities
- Resale Paint exterior walls — Enhances curb appeal and can add value
- Resale Replace ceiling fans — Modernize and improve air circulation
- Resale Replace kitchen appliances — Modern appliances can add value
- Resale Replace bathroom fixtures — Modern fixtures can add value
- Resale Landscaping improvements — Enhances curb appeal and can add value
Renovation cost estimate screening
Value-add ROI direction
- Resale Paint exterior walls — Enhances curb appeal and can add value ↑
- Resale Replace ceiling fans — Modernize and improve air circulation ↑
- Resale Replace kitchen appliances — Modern appliances can add value ↑
- Resale Replace bathroom fixtures — Modern fixtures can add value ↑
- Resale Landscaping improvements — Enhances curb appeal and can add value ↑
ⓘ Cost ranges are severity-bucket heuristics (US national rule-of-thumb). Get contractor quotes + a written scope before underwriting a rehab budget.
Schools (NCES district)
- District
- Dysart Unified District (4243)
- NCES district ID
- 0402690
- Math proficiency
- 34% ▼ -10.00%
- Reading proficiency
- 40% ▼ -5.00%
- Median HH income
- $58,033
- Composite
- 32.76/100
- National rank
- #5634
- State rank
- #73 of 249 in AZ
Livability — El Mirage
- Score
- 63/100
- State rank
- #112
- US rank
- #15164
Category grades
Schools grade is shown separately in the Schools card above.
Census & demographics
- Census place
- El Mirage, AZ
- County
- Maricopa County · 4,537,380 people
- City population
- 36,088
- Metro
- Phoenix-Mesa-Chandler, AZ
- Population (ZIP)
- 36,088
- Household income
- $78,050
- Rent vs Own
- Severe rent burden
- 669.0
Population outlook (Maricopa County) Hauer SSP2
- Today (2025)
- 4,979,203 people
- By 2030
- 5,378,229 · +8.0%
- By 2040
- 6,156,598 · +23.6%
- By 2050
- 6,872,376 · +38.0%
- By 2075
- 8,401,270 · +68.7%
- By 2100
- 9,247,439 · +85.7%
Race, ethnicity, and origin ACS 2023
- Neighborhood character
- Diverse neighborhood (Simpson 0.62)
- Race & ethnicity
- Hispanic / Latino 50% White 35% Two or more races 28% Black 6% Native American 1% Pacific Islander 1%
- Hispanic origin (detail)
- Mexican 37%
- Common ancestry
- Lithuanian 2% Romanian 1% Iranian 1%
- Foreign-born
- 15% · Canada
- Languages at home
- 66% English-only · Spanish 30% Other Indo-European 1% Other Asian/Pacific 1%
Political lean MEDSL · Maricopa
- 2024 margin
- Toss-up / Even · D 47.7% · R 51.2% · Other 1.1%
- 2008→2024 swing
- +7.1pp toward D · 2008: -10.6pp · 2024: -3.5pp
- All cycles
- 2024: R+3.5 2020: D+2.2 2016: R+3.5 2012: R+12.0 2008: R+10.6
Not yet ingested
- Civics
- —
Market trends
- HPI YoY
- ▼ -52.81%
- Current HPI
- 342.6503
- Rent YoY
- ▲ 0.08%
- Metro
- Phoenix-Mesa-Chandler, AZ
- State GDP YoY
- ▲ 4.54%
- F500 in state
- 20
Industry mix (Fortune 500 HQ in AZ)
| Industry | F500 HQs | Revenue |
|---|---|---|
| Technology | 2 | $13B |
|
||
| Mining / Metals | 1 | $23B |
|
||
| Environmental Services | 1 | $16B |
|
||
| Metals / Steel | 1 | $14B |
|
||
| Technology Distribution | 1 | $9B |
|
||
| Homebuilding | 1 | $8B |
|
||
Price history
1 event — show timeline
- 2026-05-08 Listed $129,000 ARMLS
Cash-flow waterfall
monthlySold comps — $/sqft
last 12 mo · ≤1 miLoading sold comps…