None · Tamarac, FL
Flood risk 1/10 · Minimal
- FEMA flood zone
- X (shaded)
- Chance of flooding over 30 yrs
- 0.0%
- Est. flood insurance / yr
- $507 – $1,088
Fire risk 1/10 · Minimal
- Est. fire insurance / yr
- $947 – $1,759
Heat risk 10/10 · Severe
- Hot days now (above 105°F)
- 7 days/yr
- Hot days in 30 yrs
- 24 days/yr
Wind risk 10/10 · Severe
- Chance of severe wind over 30 yrs
- 99.0%
Air-quality risk 3/10 · Minor
- Unhealthy air days now
- 3 days/yr
- Unhealthy air days in 30 yrs
- 3 days/yr
Risk factors via First Street. Map © Google.
Why this score? — see what drove the B- grade
The composite is a weighted blend of 9 inputs, each scored 0–100. Each bar is that input's sub-score; the figure is the points it added to the 100-point composite (weight × sub-score).
- Cash flow +27.0/30.0
- 1% rule +10.0/10.0
- DSCR +9.4/10.0
- ARV discount +7.5/15.0
- Schools +4.1/10.0
- Livability +3.8/5.0
- Condition / age +2.5/5.0
- Rent growth +2.2/5.0
- Appreciation +0.0/10.0
$99,900
🖨 Deal sheet 📄 Offer letter ✓ Due diligence
Listing remarks
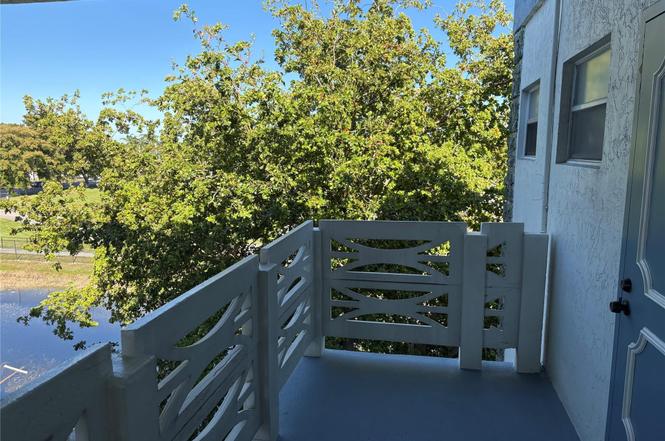
CORNER UNIT LARGE 1 BEDROOM 1.5 BATHROOM CONDO, QUIET AREA, IN THE CENTER OF LAUDERDALE LAKESLARGE BEDROOM LOTS OF CLOSETS, DINING ROOM AND LIVING ROOM ARE ALSO SPACIOUS OPEN BALCONY. PUBLIC TRANSPORTATION IS STEP AWAY. CLUB HOUSE IS IN FRONT THE BUILDING AMENITIES ARE EXCELLENT YOU NAME IT IT'S THERE. LOW MAINTENANCE FEES A LOW TAXES. ADULT COMMUNITY NO CHILDREN UNDER 18 YEARS OLD LIVING THERE.
Key facts
- Low maintenance fees
- Excellent amenities
- Corner unit
Tags
Property features AI
Finance
- HOA & community: Has association; Monthly HOA fee: $445; Association includes insurance, grounds and structure maintenance, pest control, sewer, water, common areas, elevator, and recreation facilities; Community amenities: Pool, fitness center, clubhouse, billiard room, picnic area, bocce ball, shuffleboard court, trash chute, parking, maintenance, security; Senior community
Exterior
- Parking: Assigned parking; Guest parking
- Security: Security patrol; Smoke detector(s)
- Utilities: Cable available; Water included in association; Sewer included in association; Electric service (heating & cooling electric)
- Home design: Condominium; 4-story building; Entry level: 1; Faces north; Resale property
- Construction: Block, stucco, CBS construction
- Exterior features: First floor entry; Waterfront: Yes (no waterfront features listed)
Interior
- Kitchen: Dishwasher; Electric range; Microwave; Refrigerator
- Bedrooms: 1 bedroom on the main level
- Flooring: Ceramic tile; Tile
- Bathrooms: 1 full bathroom; 1 half bathroom
- Heating & cooling: Central heating (electric); Central air conditioning (electric)
- Interior features: Furnished; Disposal; Smoke detector(s); Security patrol
- Laundry & utility: Electric water heater
Neighborhood map
What this means for you Summary
Snapshot
- This is a 1-bed/1.5-bath condo listed at $100k.
Deal economics
- At list price, monthly cash flow is $280 ($3k/yr) — positive.
- The deal already cash-flows at list — no discount required.
- Meets the 1% rule at list price ($2k rent vs $100k).
- Recommended offer: $91k (9.0% below list) — sets the bar for market timing.
- Cap rate 9.7% vs local median 3.9% in Tamarac — top-decile yield for the area; either an underpriced asset or a hidden risk that comps aren't pricing in. Stress-test before assuming the spread holds.
Location & tenants
- Location reads 76/100 on livability (#239 in FL, #3,785 nationally) — a middle-class / working-renter tenant base. Strengths: housing A+, health & safety A+, cost of living A-; Watch: employment C-, amenities F, commute F.
- Broward (suburban): math 42% / reading 53% proficiency, ranked #46 of 73 in FL (top 63%) — families likely to look elsewhere, expect single-tenant / working-renter base with shorter leases.
- Zoned schools: Park Lakes Elementary School (math 35% / reading 44%, grade F, #1,513 of 2,144 statewide, top 73%, 970 students, 82% FRL); Lauderdale Lakes Middle School (math 21% / reading 26%, grade F, #536 of 571 statewide, top 95%, 816 students, 79% FRL); Boyd H. Anderson High School (math 10% / reading 14%, grade F, #622 of 667 statewide, top 93%, 2,038 students, 72% FRL) — zoned schools average 78% FRL vs 51% district-wide (27 pts higher); higher-poverty schools than district average — tighter screening recommended.
- Zoned-school proficiency averages 25% at this address vs 48% district-wide (-22 pts) — the specific schools serving this property underperform the Broward average; the district grade overstates school quality for this exact location.
- Market conditions: Rents soft (-1.4%/yr); 821 active listings in the ZIP; 40 comparable units currently listed for rent nearby; rentals at typical pace (median 24d on market — plan ~3-4 weeks tenant-placement turnaround); 2,111 units permitted in Broward County in 2024 (1,265 in 5+ unit buildings).
- This rent runs 37% of the median local income ($58k/yr) — at the standard rent-burdened threshold; future hikes will face affordability resistance.
Forward outlook
- Local home prices are declining (-3.0%/yr); year-one equity from $691 of loan paydown is wiped out by about $3k of value loss. Plan a longer hold.
- Broward County population projected at +34% by 2050 — long-run rental-demand tailwind backs the buy-and-hold thesis.
Negotiation context
- It's been on market 99 days — a 9% lower offer ($91k) is reasonable based on typical stale-listing flexibility.
Risks & watch-outs
- Watch-outs: HOA is 25% of rent.
- Climate carrying-cost: severe wind risk, 99% chance of damaging wind over 30y; extreme-heat days projected 7→24/yr by 2055 (HVAC capex compounding) — expect insurance premiums to compound above CPI over the hold.
Questions for the listing agent
- It's been on market 99 days. Have you received any prior offers? Is the seller open to a 9% concession, seller financing, or rate buy-down credit?
- Built in 1974 — when were the roof, HVAC, electrical panel, plumbing, and water heater last replaced?
- What does the HOA fee cover, when was the last increase, and are there any pending special assessments or reserve-fund shortfalls?
- Any open or pending special assessments — roof, HVAC, plumbing, elevator, façade? What's the per-unit balance and payoff schedule, and is the seller paying it off at close or rolling it to the buyer?
- Why hasn't it sold? Are there any deal-killer items the seller is aware of (foundation, flood, title, zoning, code violations)?
- Is there a deadline driving the sale (1031 exchange, divorce, estate, relocation)? That informs how much negotiation room exists.
- Schools are B-rated — typically a magnet for longer-tenancy family renters. What's the average tenant stay here, and is there a school-zone premium baked into asking?
- What's the average days-on-market for RENTAL listings here right now (not sales)? A rising rental-DOM trend means longer vacancies and softer asking-rent achievability than the comps imply.
- What's the recent tenant-quality profile in this submarket — average credit score on applications, eviction rate, late-payment / NSF rate, and stable-employment percentage? A property-management company in the area should have these aggregated.
- How much new apartment / multifamily construction is in the pipeline within 1–3 miles? Heavy new supply (>2% of stock underway) typically softens rents 12–24 months out; light construction supports rent growth.
Investment metrics
- 1% rule
- 1.79% ✓
- Cap rate
- 9.66%
- Cash-on-cash
- 12.02%
- DSCR
- 1.54
- GRM
- 4.6
CMA / ARV
No comps found within radius.
Projected returns pro-forma
-3.0% appreciation · 0.0% rent growth · sell at horizon
- IRR
- -3.3%
- Equity multiple
- 0.88×
- Total profit
- $-3,288
- Equity at exit
- $14,895
- IRR
- 0.7%
- Equity multiple
- 1.04×
- Total profit
- $1,049
- Equity at exit
- $8,638
Cash invested: $27,972 (down + closing). Projections, not guarantees.
Landlord ↔ Tenant lean methodology
- Overall (STATE)
- 87 Strongly Landlord-Friendly
- State Florida
- 87 Strongly Landlord-Friendly · R+3
- County
- — inherits STATE
- City
- — inherits STATE
ZIP-level market 33319
- Rents YoY
- -1.4%
- Active inventory
- 821
- Price-to-rent
- 4.6×
Monthly cashflow live
- Estimated rent
- $1,792 high interval (Pro) →
- Mortgage (P&I)
- −$524
- Tax est. 1.5%
- −$125 /mo · $1,498/yr
- Insurance
- −$42
- HOA
- −$445
- Vacancy / Maint / Mgmt
- −$376
- Net cashflow
- $280
Break-even live
UW: 25.0% down · 7.5% · 30yr · 1.5% tax · 5.0% vac · 8.0% maint · 8.0% mgmt
Financing live
Cash to close
- Down payment
- $24,975
- Closing costs
- $2,997
- Reserves months
- —
- Total cash needed
- —
Loan-product check · same deal, 3 products live
Conventional
25% down · 7.5% · 30yr
- Down + closing
- —
- Monthly P&I
- —
- Monthly cashflow
- —
- DSCR
- —
- Eligible?
- —
Personal DTI + credit; lowest rate.
DSCR
20% down · 8.5% · 30yr
- Down + closing
- —
- Monthly P&I
- —
- Monthly cashflow
- —
- DSCR
- —
- Eligible?
- —
No personal income docs; deal must DSCR.
Hard money
10% down · 12.0% · 12mo
- Down + closing
- —
- Monthly P&I
- —
- Monthly cashflow
- —
- DSCR
- —
- Eligible?
- —
Short-term bridge; refi at stabilization.
Rent comps 40 comps
| Address | Beds | Baths | Sqft | Rent | $/sqft | DOM | Units | Dist |
|---|---|---|---|---|---|---|---|---|
| 5900 NW 44th St #106 Lauderhill, FL | 2.0 | 2.0 | 1100 | $1,700 | $1.55 | 14d | 1 | 0.60mi |
| 5550 NW 44th St Unit 418B Lauderhill, FL | 2.0 | 2.0 | 1290 | $1,900 | $1.47 | 24d | 1 | 0.61mi |
| 5903 NW 57th Ct Tamarac, FL | 1.0–3.0 | 1.0–2.0 | 1080 | $1,784 | $1.65 | 3d | 30 | 0.61mi |
| 5530 NW 44th St Lauderhill, FL | 2.0 | 2.0 | 1187 | $2,050 | $1.73 | 24d | 2 | 0.62mi |
| 5860 NW 44th St #603 Lauderhill, FL | 2.0 | 2.0 | 1100 | $1,800 | $1.64 | 18d | 1 | 0.62mi |
| 6200 NW 44th St #109 Lauderhill, FL | 2.0 | 2.0 | 1092 | $1,850 | $1.69 | 10d | 1 | 0.65mi |
| 6100 NW 44th St #302 Lauderhill, FL | 2.0 | 2.0 | 1092 | $1,800 | $1.65 | 24d | 1 | 0.67mi |
| 4166 Inverrary Dr #403 Lauderhill, FL | 2.0 | 2.0 | 972 | $1,750 | $1.80 | 24d | 1 | 0.70mi |
| 4168 Inverrary Dr #408 Lauderhill, FL | 2.0 | 2.0 | 1073 | $1,750 | $1.63 | 24d | 1 | 0.70mi |
| 5821 Swordfish Ct Unit B Tamarac, FL | 2.0 | 2.5 | 1380 | $2,250 | $1.63 | 24d | 1 | 0.71mi |
| 4172 Inverrary Dr #306 Lauderhill, FL | 1.0 | 1.5 | 783 | $1,500 | $1.92 | 10d | 1 | 0.73mi |
| 6161 NW 57th Ct #103 Tamarac, FL | 2.0 | 2.0 | 880 | $2,200 | $2.50 | 24d | 1 | 0.73mi |
| 5628 Rock Island Rd Tamarac, FL | 1.0–2.0 | 1.0–2.0 | 867 | $1,700 | $1.96 | 5d | 2 | 0.73mi |
| 5961 N Falls Circle Dr Lauderhill, FL | 1.0 | 1.5–2.0 | 885 | $1,745 | $1.97 | 3d | 2 | 0.75mi |
| 6001 N Falls Circle Dr #310 Lauderhill, FL | 2.0 | 2.0 | 1320 | $2,400 | $1.82 | 24d | 1 | 0.75mi |
| 5646 Rock Island Rd #198 Tamarac, FL | 2.0 | 2.0 | 1030 | $2,150 | $2.09 | 24d | 1 | 0.75mi |
| 4176 Inverrary Dr #110 Lauderhill, FL | 2.0 | 2.0 | 972 | $2,000 | $2.06 | 24d | 1 | 0.76mi |
| 6001 Shakerwood Cir #205 Tamarac, FL | 2.0 | 2.0 | 775 | $1,800 | $2.32 | 24d | 1 | 0.79mi |
| 4174 Inverrary Dr #903 Lauderhill, FL | 2.0 | 2.0 | 972 | $1,700 | $1.75 | 20d | 1 | 0.79mi |
| 4174 Inverrary Dr #1004 Lauderhill, FL | 2.0 | 2.0 | 972 | $1,750 | $1.80 | 24d | 1 | 0.79mi |
| 4174 Inverrary Dr #401 Lauderhill, FL | 2.0 | 2.0 | 1116 | $2,100 | $1.88 | 24d | 1 | 0.79mi |
| 4174 Inverrary Dr #303 Lauderhill, FL | 2.0 | 2.0 | 972 | $1,675 | $1.72 | 12d | 1 | 0.79mi |
| 4174 Inverrary Dr #811 Lauderhill, FL | 1.0 | 1.5 | 783 | $1,550 | $1.98 | 24d | 1 | 0.79mi |
| 4934 NW 55th Ct Tamarac, FL | 2.0 | 1.0 | 1059 | $1,895 | $1.79 | 15d | 1 | 0.80mi |
| 4156 Inverrary Dr Lauderhill, FL | 2.0 | 2.0 | 993 | $2,200 | $2.22 | 24d | 4 | 0.80mi |
| 4156 Inverrary Dr Lauderhill, FL | 1.0–2.0 | 1.5–2.0 | 899 | $1,625 | $1.81 | 7d | 3 | 0.80mi |
| 4154 Inverrary Dr Lauderhill, FL | 1.0–2.0 | 1.5–2.0 | 877 | $1,250 | $1.42 | 24d | 2 | 0.82mi |
| 4154 Inverrary Dr #407 Lauderhill, FL | 2.0 | 2.0 | 972 | $1,800 | $1.85 | 10d | 1 | 0.82mi |
| 4154 Inverrary Dr #206 Lauderhill, FL | 1.0 | 1.5 | 783 | $1,575 | $2.01 | 2d | 1 | 0.82mi |
| 4152 Inverrary Dr Lauderhill, FL | 2.0 | 2.0 | 1016 | $2,025 | $1.99 | 24d | 2 | 0.82mi |
| 4158 Inverrary Dr #202 Lauderhill, FL | 2.0 | 2.0 | 1116 | $2,200 | $1.97 | 3d | 1 | 0.82mi |
| 5672 Rock Island Rd Tamarac, FL | 1.0 | 1.0 | 717 | $1,748 | $2.44 | 3d | 2 | 0.82mi |
| 5860 NW 64th Ave Tamarac, FL | 1.0–2.0 | 1.0–2.0 | 770 | $1,485 | $1.93 | 24d | 2 | 0.84mi |
| 5860 NW 64th Ave Tamarac, FL | 1.0–2.0 | 1.0–2.0 | 770 | $1,450 | $1.88 | 7d | 3 | 0.84mi |
| 5740 Rock Island Rd #299 Tamarac, FL | 1.0 | 1.0 | 750 | $1,895 | $2.53 | 14d | 1 | 0.84mi |
| 4158 Inverrary Dr Lauderhill, FL | 2.0 | 2.0 | 1108 | $2,100 | $1.90 | 17d | 2 | 0.84mi |
| 4158 Inverrary Dr Lauderhill, FL | 2.0 | 2.0 | 1044 | $2,100 | $2.01 | 7d | 2 | 0.84mi |
| 5740 Rock Island Rd Tamarac, FL | 1.0 | 1.0 | 722 | $1,722 | $2.38 | 24d | 1 | 0.84mi |
| 4164 Inverrary Dr #102 Lauderhill, FL | 2.0 | 2.0 | 1120 | $2,200 | $1.96 | 15d | 1 | 0.84mi |
| 4164 Inverrary Dr #806 Lauderhill, FL | 1.0 | 1.5 | 783 | $1,600 | $2.04 | 24d | 1 | 0.84mi |
HOA detail condo
- Monthly dues
- $445 · $5,340/yr
- Assessments
- None detected in remarks — confirm with the listing agent.
Listing history 13 events
-
2026-06-18days on market $99,900 Active 99 DOM
-
2026-06-17days on market $99,900 Active 98 DOM
-
2026-06-16days on market $99,900 Active 97 DOM
-
2026-06-15days on market $99,900 Active 96 DOM
-
2026-06-13days on market $99,900 Active 94 DOM
-
2026-06-09days on market $99,900 Active 90 DOM
-
2026-06-07days on market $99,900 Active 88 DOM
-
2026-06-04days on market $99,900 Active 85 DOM
-
2026-06-03days on market $99,900 Active 84 DOM
-
2026-06-02days on market $99,900 Active 83 DOM
-
2026-06-01days on market $99,900 Active 82 DOM
-
2026-05-31days on market $99,900 Active 81 DOM
-
2025-12-16$99,900 Active
ⓘ Source: listings_history table (triggers on properties + properties_extension) + one-shot
backfill from property_details.listing_events for pre-trigger history.
Climate risk First Street
- Flood 1/10 Low FEMA zone X (shaded) · 0% chance over 30 yrs
- Wildfire 1/10 Low
- Heat 10/10 Extreme 7 d/yr ≥105°F today · 24 d/yr by 30 yrs out
- Wind 10/10 Extreme 99% chance of damaging wind over 30 yrs
- Air quality 3/10 Moderate 3 unhealthy d/yr today · 3 by 30 yrs out
Nearby sold comps map
Loading sold comps map…
Walkable amenities ~0.75 mi
Loading nearby amenities…
Taxation est. · year 1
- Rental income
- $21,504
- − Mortgage interest
- −$5,596
- − Property taxes
- −$1,498
- − Insurance
- −$500
- − Repairs & maintenance
- −$1,720
- − Management
- −$1,720
- − HOA
- −$5,340
- − Depreciation
- −$2,906
- Taxable income
- $2,223
- Est. tax owed @ 24.0%
- −$534
- After-tax cash flow
- $2,830/yr
For passive investors: Depreciation is non-cash, so a rental often shows a tax loss while cash-flowing — sheltering income. Rental losses are passive: they offset passive income freely, and up to $25,000/yr can offset ordinary (W-2) income if you actively participate and your MAGI is under $100k (phasing out to $0 by $150k); unused losses carry forward. On sale, claimed depreciation is recaptured at up to 25%, and gains may owe capital-gains tax (a 1031 exchange can defer both). Figures are a year-1 estimate at your 24.0% rate — not tax advice; consult a CPA.
Schools (NCES district)
- District
- Broward
- NCES district ID
- 1200180
- Math proficiency
- 42% ▼ -18.00%
- Reading proficiency
- 53% ▼ -5.00%
- Median HH income
- $52,139
- Composite
- 40.88/100
- National rank
- #3621
- State rank
- #46 of 73 in FL
Livability — Tamarac
- Score
- 76/100
- State rank
- #239
- US rank
- #3785
Category grades
Schools grade is shown separately in the Schools card above.
Census & demographics
- Census place
- Tamarac, FL
- County
- Broward County · 1,963,430 people
- City population
- 105,666
- Metro
- Miami-Fort Lauderdale-Pompano Beach, FL
- Population (ZIP)
- 54,450
- Household income
- $58,388
- Rent vs Own
- Severe rent burden
- 2809.0
Population outlook (Broward County) Hauer SSP2
- Today (2025)
- 2,207,033 people
- By 2030
- 2,360,704 · +7.0%
- By 2040
- 2,661,208 · +20.6%
- By 2050
- 2,946,698 · +33.5%
- By 2075
- 3,602,273 · +63.2%
- By 2100
- 3,970,984 · +79.9%
Race, ethnicity, and origin ACS 2023
- Neighborhood character
- Diverse neighborhood (Simpson 0.58)
- Race & ethnicity
- Black 61% Hispanic / Latino 17% White 15% Two or more races 11% Asian 4%
- Hispanic origin (detail)
- Puerto Rican 4% Cuban 2% Dominican 1%
- Common ancestry
- Hispanic 13% Romanian 1% Italian 1%
- Foreign-born
- 46% · Canada, Jamaica, Vietnam
- Languages at home
- 64% English-only · Spanish 15% French/Haitian/Cajun 15% Other Indo-European 2%
Political lean MEDSL · Broward
- 2024 margin
- D (+17.0) · D 58.0% · R 41.0%
- 2008→2024 swing
- -17.8pp toward R · 2008: 34.7pp · 2024: 17.0pp
- All cycles
- 2024: D+17.0 2020: D+29.8 2016: D+35.0 2012: D+34.9 2008: D+34.7
Not yet ingested
- Civics
- —
Market trends
- HPI YoY
- ▼ -202.84%
- Current HPI
- 328.4307
- Rent YoY
- ▼ -1.38%
- Metro
- Miami-Fort Lauderdale-Pompano Beach, FL
- State GDP YoY
- ▲ 3.28%
- F500 in state
- 36
Industry mix (Fortune 500 HQ in FL)
| Industry | F500 HQs | Revenue |
|---|---|---|
| Industrial Technology | 2 | $29B |
|
||
| Insurance | 2 | $17B |
|
||
| Retail | 1 | $60B |
|
||
| Technology Distribution | 1 | $58B |
|
||
| Homebuilding | 1 | $35B |
|
||
| Technology Manufacturing | 1 | $35B |
|
||
Price history
1 event — show timeline
- 2025-12-16 Listed $99,900 Beaches MLS
Cash-flow waterfall
monthlySold comps — $/sqft
last 12 mo · ≤1 miLoading sold comps…