236 Maple St · New Bloomfield, MO
Flood risk 1/10 · Minimal
- FEMA flood zone
- X (unshaded)
- Chance of flooding over 30 yrs
- 0.0%
- Est. flood insurance / yr
- $473 – $860
Fire risk 4/10 · Minor
- Est. fire insurance / yr
- $1,054 – $1,958
Heat risk 4/10 · Minor
- Hot days now (above 107°F)
- 7 days/yr
- Hot days in 30 yrs
- 19 days/yr
Wind risk 2/10 · Minimal
- Chance of severe wind over 30 yrs
- 0.0%
Air-quality risk 1/10 · Minimal
- Unhealthy air days now
- 0 days/yr
- Unhealthy air days in 30 yrs
- 0 days/yr
Risk factors via First Street. Map © Google.
Why this score? — see what drove the D- grade
The composite is a weighted blend of 9 inputs, each scored 0–100. Each bar is that input's sub-score; the figure is the points it added to the 100-point composite (weight × sub-score).
- Cash flow +17.2/30.0
- DSCR +5.4/10.0
- 1% rule +3.9/10.0
- Schools +3.3/10.0
- Livability +3.2/5.0
- Rent growth +2.5/5.0
- Condition / age +2.5/5.0
- ARV discount +0.0/15.0
- Appreciation +0.0/10.0
$199,900
🖨 Deal sheet 📄 Offer letter ✓ Due diligence
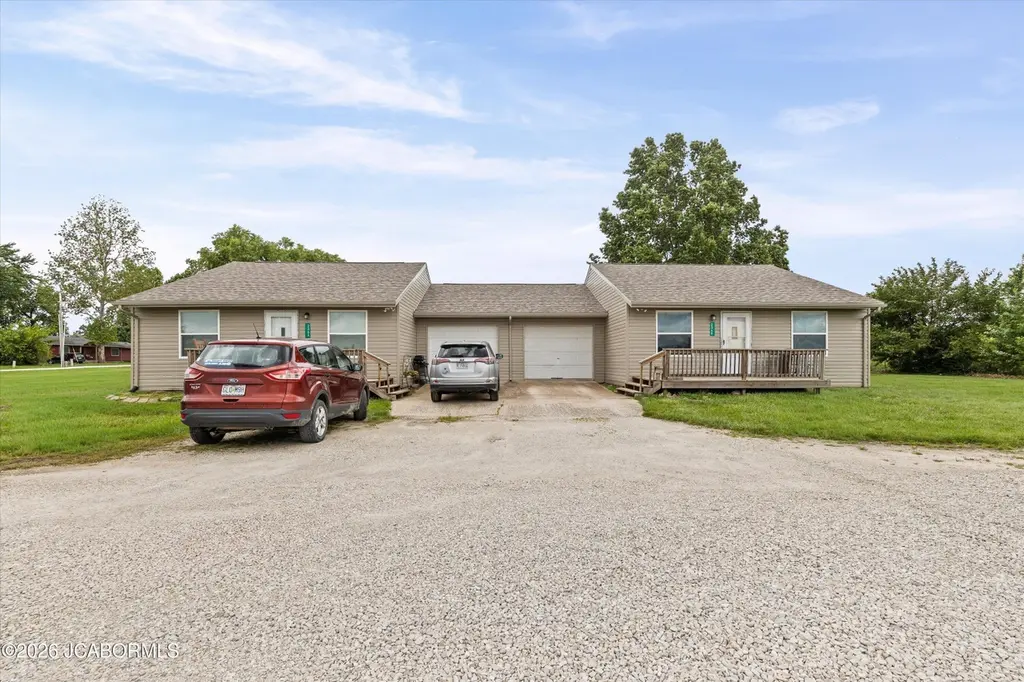
Listing remarks
Well-maintained duplex offering two spacious units, each featuring 2 bedrooms, 2 full bathrooms, and an attached 1-car garage. Both units are conveniently located on the main level, providing desirable single-level living that appeals to a wide variety of tenants. One unit has been updated with new flooring, cabinets, paint, and light fixtures, adding modern appeal and value. The functional floor plans offer generous living spaces, ample storage, and private garage parking for each tenant. Situated on a large half-acre lot, this property offers additional upside with potential room to build another rental unit (buyer to verify). The duplex directly across the street is also available for pu
Key facts
- Two spacious units
- Large half acre lot
- 0.5 acre lot
Tags
Property features AI
Finance
- Financial info: Two rental units with current rents: one unit at $675, the other at $750
Exterior
- Parking: Detached or attached garage with 2 garage spaces
- Utilities: Public water; Public sewer
- Home design: Residential income property; Updated/remodeled
- Construction: Vinyl siding
- Exterior features: Half-acre lot
Interior
- Bedrooms: Two 2-bedroom units (each unit has 2 bedrooms)
- Bathrooms: Four full bathrooms (total)
- Heating & cooling: Central air conditioning; Electric heating
- Interior features: No fireplace; No basement
Neighborhood map
What this means for you Summary
Snapshot
- This is a 4-bed/1.0-bath single-family listed at $200k.
Deal economics
- At list price, monthly cash flow is $143 ($2k/yr) — positive.
- The deal already cash-flows at list — no discount required.
- To meet the 1% rule (rent ≥ 1% of price), the offer needs to be $179k (10.5% below list).
- Recommended offer: $179k (10.5% below list) — sets the bar for 1% rule.
Location & tenants
- Location reads 63/100 on livability (#365 in MO) — a middle-class / working-renter tenant base. Strengths: cost of living A+, housing A+; Watch: crime F, amenities F, commute F.
- New Bloomfield R-III (rural): math 35% / reading 39% proficiency, ranked #165 of 324 in MO (top 51%) — families likely to look elsewhere, expect single-tenant / working-renter base with shorter leases.
- Zoned schools: New Bloomfield Elem. (math 27% / reading 32%, grade F, #813 of 1,115 statewide, top 75%, 358 students, 34% FRL) — zoned schools at 34% FRL track the district average.
- Market conditions: 35 active listings in the ZIP; 40 units permitted in Callaway County in 2024 (0 in 5+ unit buildings).
Forward outlook
- Local home prices are declining (-3.0%/yr); year-one equity from $1k of loan paydown is wiped out by about $6k of value loss. Plan a longer hold.
Negotiation context
- Only 7 days on market — expect competitive offers; lowballing is unlikely to land.
Questions for the listing agent
- Is there a deadline driving the sale (1031 exchange, divorce, estate, relocation)? That informs how much negotiation room exists.
- Schools are D-rated, which usually means shorter tenancies and higher turnover. Who's the typical renter profile here, and what's been the actual vacancy rate?
- Crime grade is F in this area — have there been break-ins, vandalism, or insurance claims at this property in the last 3 years? What carrier currently insures it and at what premium?
- The area grade is low — what's the realistic commute time and amenity access for the typical tenant pool here? Any planned neighborhood developments (good or bad) we should know about?
- What's the average days-on-market for RENTAL listings here right now (not sales)? A rising rental-DOM trend means longer vacancies and softer asking-rent achievability than the comps imply.
- What's the recent tenant-quality profile in this submarket — average credit score on applications, eviction rate, late-payment / NSF rate, and stable-employment percentage? A property-management company in the area should have these aggregated.
- How much new for-sale + rental construction is in the pipeline within 1–3 miles? Heavy new supply typically softens prices + rents 12–24 months out; constrained supply supports both.
Investment metrics
- 1% rule
- 0.89% ✗
- Cap rate
- 7.15%
- Cash-on-cash
- 3.06%
- DSCR
- 1.14
- GRM
- 9.3
CMA / ARV
- ARV (on-the-fly)
- $168,350
- Comps found
- 4
Show comp detail 4 sales within ~0.75 mi
| Address | Dist | Beds/Ba | Sqft | Sold | Price | $/sf | Match |
|---|---|---|---|---|---|---|---|
| 108 Oak St | 0.31mi | 3/1.0 (-1) | 960 (+6%) | 22mo | $179,900 | $187 | 53 |
| 102 Chevy Chase Ln | 0.54mi | 3/1.0 (-1) | 1,000 (+10%) | 1mo | $184,900 | $185 | 53 |
| 614 Cedar Ln | 0.38mi | 3/1.0 (-1) | 959 (+5%) | 19mo | $161,900 | $169 | 52 |
| 336 Elmwood Circle Cir | 0.42mi | 3/1.0 (-1) | 1,022 (+12%) | 22mo | $165,000 | $161 | 36 |
Match score weights: distance 35% · size 25% · config 20% · recency 20%. Top-matched comps best support the ARV.
Projected returns pro-forma
-3.0% appreciation · 3.0% rent growth · sell at horizon
- IRR
- -11.5%
- Equity multiple
- 0.58×
- Total profit
- $-23,332
- Equity at exit
- $29,806
- IRR
- -2.3%
- Equity multiple
- 0.84×
- Total profit
- $-8,765
- Equity at exit
- $17,284
Cash invested: $55,972 (down + closing). Projections, not guarantees.
Landlord ↔ Tenant lean methodology
- Overall (STATE)
- 81 Strongly Landlord-Friendly
- State Missouri
- 81 Strongly Landlord-Friendly · R+10
- County
- — inherits STATE
- City
- — inherits STATE
ZIP-level market 65063
- Home prices YoY
- -26.8%
- Active inventory
- 35
- Price-to-rent
- 9.3×
Monthly cashflow live
- Estimated rent
- $1,788 medium interval (Pro) →
- Mortgage (P&I)
- −$1,048
- Tax from tax record
- −$138 /mo · $1,660/yr
- Insurance
- −$83
- HOA
- −$0
- Vacancy / Maint / Mgmt
- −$376
- Net cashflow
- $143
Break-even live
UW: 25.0% down · 7.5% · 30yr · 1.5% tax · 5.0% vac · 8.0% maint · 8.0% mgmt
Financing live
Cash to close
- Down payment
- $49,975
- Closing costs
- $5,997
- Reserves months
- —
- Total cash needed
- —
Loan-product check · same deal, 3 products live
Conventional
25% down · 7.5% · 30yr
- Down + closing
- —
- Monthly P&I
- —
- Monthly cashflow
- —
- DSCR
- —
- Eligible?
- —
Personal DTI + credit; lowest rate.
DSCR
20% down · 8.5% · 30yr
- Down + closing
- —
- Monthly P&I
- —
- Monthly cashflow
- —
- DSCR
- —
- Eligible?
- —
No personal income docs; deal must DSCR.
Hard money
10% down · 12.0% · 12mo
- Down + closing
- —
- Monthly P&I
- —
- Monthly cashflow
- —
- DSCR
- —
- Eligible?
- —
Short-term bridge; refi at stabilization.
Listing history 7 events
-
2026-06-19days on market $199,900 Active 7 DOM
-
2026-06-18days on market $199,900 Active 6 DOM
-
2026-06-17days on market $199,900 Active 5 DOM
-
2026-06-16days on market $199,900 Active 4 DOM
-
2026-06-15days on market $199,900 Active 3 DOM
-
2026-06-13remarks 699-char remark
-
2026-06-13$199,900 Active 1 DOM
ⓘ Source: listings_history table (triggers on properties + properties_extension) + one-shot
backfill from property_details.listing_events for pre-trigger history.
Tax reassessment forecast MO · Resets to sale price
- Current annual tax
- $1,660 · $138/mo
- Projected year-2 tax
- $1,939 · $162/mo
- Expected delta
- +$279/yr (+$23/mo · 16.8%)
ⓘ Screening estimate from a state-policy table — verify with the county assessor before closing.
Climate risk First Street
- Flood 1/10 Low FEMA zone X (unshaded) · 0% chance over 30 yrs
- Wildfire 4/10 Moderate
- Heat 4/10 Moderate 7 d/yr ≥107°F today · 19 d/yr by 30 yrs out
- Wind 2/10 Low 0% chance of damaging wind over 30 yrs
- Air quality 1/10 Low 0 unhealthy d/yr today · 0 by 30 yrs out
Nearby sold comps map
Loading sold comps map…
Walkable amenities ~0.75 mi
Loading nearby amenities…
Taxation est. · year 1
- Rental income
- $21,461
- − Mortgage interest
- −$11,198
- − Property taxes
- −$1,660
- − Insurance
- −$1,000
- − Repairs & maintenance
- −$1,717
- − Management
- −$1,717
- − Depreciation
- −$5,815
- Taxable loss
- −$1,645
- Est. tax savings @ 24.0%
- +$395
- After-tax cash flow
- $2,110/yr
For passive investors: Depreciation is non-cash, so a rental often shows a tax loss while cash-flowing — sheltering income. Rental losses are passive: they offset passive income freely, and up to $25,000/yr can offset ordinary (W-2) income if you actively participate and your MAGI is under $100k (phasing out to $0 by $150k); unused losses carry forward. On sale, claimed depreciation is recaptured at up to 25%, and gains may owe capital-gains tax (a 1031 exchange can defer both). Figures are a year-1 estimate at your 24.0% rate — not tax advice; consult a CPA.
Schools (NCES district)
- District
- New Bloomfield R-III
- NCES district ID
- 2921875
- Math proficiency
- 35% ▼ -5.00%
- Reading proficiency
- 39% ▼ -6.00%
- Median HH income
- $60,892
- Composite
- 33.04/100
- National rank
- #5574
- State rank
- #165 of 324 in MO
Livability — New Bloomfield
- Score
- 63/100
- State rank
- #365
- US rank
- #16061
Category grades
Schools grade is shown separately in the Schools card above.
Census & demographics
- Census place
- New Bloomfield, MO
- City population
- 4,180
- Population (ZIP)
- 4,180
Population outlook (Callaway County) Hauer SSP2
- Today (2025)
- 45,390 people
- By 2030
- 45,493 · +0.2%
- By 2040
- 45,092 · -0.7%
- By 2050
- 44,069 · -2.9%
- By 2075
- 41,875 · -7.7%
- By 2100
- 38,094 · -16.1%
Race, ethnicity, and origin ACS 2023
- Neighborhood character
- Predominantly White (91%)
- Race & ethnicity
- White 91% Two or more races 7% Hispanic / Latino 2%
- Common ancestry
- Italian 2% Slovak 2% Lithuanian 2%
- Foreign-born
- 1%
- Languages at home
- 97% English-only · Spanish 1%
Political lean MEDSL · Callaway
- 2024 margin
- Solid R (+43.3) · D 27.6% · R 70.9% · Other 1.5%
- 2008→2024 swing
- -23.6pp toward R · 2008: -19.7pp · 2024: -43.3pp
- All cycles
- 2024: R+43.3 2020: R+42.3 2016: R+42.2 2012: R+31.1 2008: R+19.7
Not yet ingested
- Civics
- —
Market trends
- HPI YoY
- ▼ -75.75%
- Current HPI
- 206.671
- Rent YoY
- —
- Metro
- —
- State GDP YoY
- ▲ 1.84%
- F500 in state
- 20
Industry mix (Fortune 500 HQ in MO)
| Industry | F500 HQs | Revenue |
|---|---|---|
| Healthcare | 1 | $163B |
|
||
| Insurance | 1 | $21B |
|
||
| Industrial Technology | 1 | $17B |
|
||
| Retail | 1 | $16B |
|
||
| Industrial Distribution | 1 | $10B |
|
||
| Utilities | 1 | $9B |
|
||
Price history
2 events — show timeline
- 2026-06-12 Listed $199,900 JCMLS
- 2005-09-22 Sold (Public Records) — Public Records
Property tax history
+0.8%/yrLatest (2025): $1,660 · -0.6% YoY. Source: county tax records.
Cash-flow waterfall
monthlySold comps — $/sqft
last 12 mo · ≤1 miLoading sold comps…