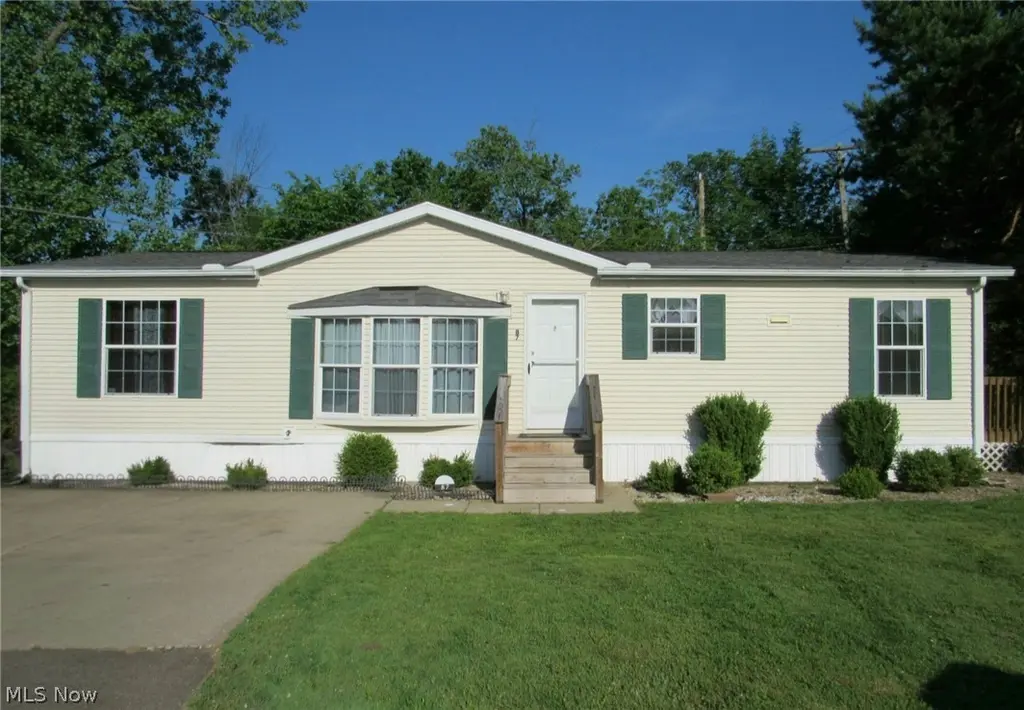
10328 Wellman Rd #87 · Streetsboro, OH
Flood risk 1/10 · Minimal
- FEMA flood zone
- X (unshaded)
- Chance of flooding over 30 yrs
- 0.0%
- Est. flood insurance / yr
- $507 – $1,088
Fire risk 1/10 · Minimal
- Est. fire insurance / yr
- $713 – $1,323
Heat risk 2/10 · Minimal
- Hot days now (above 96°F)
- 7 days/yr
- Hot days in 30 yrs
- 17 days/yr
Wind risk 1/10 · Minimal
- Chance of severe wind over 30 yrs
- —
Air-quality risk 3/10 · Minor
- Unhealthy air days now
- 2 days/yr
- Unhealthy air days in 30 yrs
- 3 days/yr
Risk factors via First Street. Map © Google.
Why this score? — see what drove the B grade
The composite is a weighted blend of 9 inputs, each scored 0–100. Each bar is that input's sub-score; the figure is the points it added to the 100-point composite (weight × sub-score).
- Cash flow +30.0/30.0
- 1% rule +10.0/10.0
- DSCR +10.0/10.0
- ARV discount +7.5/15.0
- Schools +4.4/10.0
- Livability +3.9/5.0
- Condition / age +3.8/5.0
- Rent growth +2.5/5.0
- Appreciation +0.0/10.0
$65,000
🖨 Deal sheet 📄 Offer letter ✓ Due diligence
Listing remarks
Welcome to this spacious 2005 Fairmont Triumph mobile home located in the Hidden Lakes Community and served by the Hudson City School District. Offering approximately 1,500 square feet of living space, this well-maintained home features 3 bedrooms and 2 full bathrooms with a functional layout. Recent updates include a new roof (July 2024), new furnace (2025), and updated kitchen light fixtures (2024). All kitchen appliances, along with the window A/C unit, will convey with the sale, making this home move-in ready. Enjoy affordable homeownership in a convenient location with easy access to shopping, dining, parks, and major roadways. Sale is contingent upon buyer approval by park management.
Key facts
- Move-in ready
- New furnace
- New roof
Tags
Property features AI
Finance
- Other: Above-grade finished area reported by owner
- Financial info: Has land lease (monthly land lease applies)
- HOA & community: Association management included in association fee; Community playground
Exterior
- Parking: No garage; Off-street paved parking pad
- Utilities: Public water; Public sewer; Energy-efficient appliances; Energy-efficient water heater; Low-flow plumbing fixtures
- Home design: Single-story home; Updated/remodeled condition; Entry level on main floor
- Construction: Built (year per public records); Frame construction; Vinyl and wood siding; Blown-in insulation; Asphalt/fiberglass roof; Slab foundation
- Exterior features: Back yard; Corner lot; Wooded lot; Wrought-iron fencing; Shed(s)
Interior
- Kitchen: Range; Refrigerator
- Bedrooms: 3 main-level bedrooms
- Bathrooms: 2 full bathrooms (both on the main level)
- Heating & cooling: Forced air heating; Ceiling fans; Wall/window cooling units
- Interior features: Ceiling fans; Eat-in kitchen; Kitchen island; Pantry; Soaking tub; Walk-in closets; Drapes; Window screens; Skylights; Shutters
- Laundry & utility: Main-level laundry room; Washer; Dryer
Neighborhood map
What this means for you Summary
Snapshot
- This is a 3-bed/2.0-bath single-family listed at $65k. Condition is rated good.
Deal economics
- At list price, monthly cash flow is $1k ($17k/yr) — positive.
- The deal already cash-flows at list — no discount required.
- Meets the 1% rule at list price ($2k rent vs $65k).
- Cap rate 32.5% vs local median 3.6% in Streetsboro — top-decile yield for the area; either an underpriced asset or a hidden risk that comps aren't pricing in. Stress-test before assuming the spread holds.
Location & tenants
- Location reads 77/100 on livability (#194 in OH, #2,965 nationally) — a middle-class / working-renter tenant base. Strengths: cost of living A+, housing A+, health & safety A+; Watch: amenities F, commute F.
- Streetsboro City (suburban): math 44% / reading 56% proficiency, ranked #425 of 656 in OH (top 65%) — acceptable for families but not a draw, mixed tenant base, ~2y average lease.
- Market conditions: 95 active listings in the ZIP; 3 comparable units currently listed for rent nearby; rentals at typical pace (median 14d on market — plan ~3-4 weeks tenant-placement turnaround); high-income renter base; 196 units permitted in Portage County in 2024 (10 in 5+ unit buildings).
- This rent is only 17% of the median local income ($169k/yr) — well below the 30% rent-burden line; pricing power to push rent on renewal without tenant pushback.
Forward outlook
- Local home prices are declining (-3.0%/yr); year-one equity from $449 of loan paydown is wiped out by about $2k of value loss. Plan a longer hold.
- At projected returns (-3.0% appreciation + 3.0% rent growth), your $18k cash investment doubles in ~2 years — after that, you're playing with house money.
Negotiation context
- Only 10 days on market — expect competitive offers; lowballing is unlikely to land.
Questions for the listing agent
- Is there a deadline driving the sale (1031 exchange, divorce, estate, relocation)? That informs how much negotiation room exists.
- Schools are B-rated — typically a magnet for longer-tenancy family renters. What's the average tenant stay here, and is there a school-zone premium baked into asking?
- What's the average days-on-market for RENTAL listings here right now (not sales)? A rising rental-DOM trend means longer vacancies and softer asking-rent achievability than the comps imply.
- What's the recent tenant-quality profile in this submarket — average credit score on applications, eviction rate, late-payment / NSF rate, and stable-employment percentage? A property-management company in the area should have these aggregated.
- How much new for-sale + rental construction is in the pipeline within 1–3 miles? Heavy new supply typically softens prices + rents 12–24 months out; constrained supply supports both.
Investment metrics
- 1% rule
- 3.64% ✓
- Cap rate
- 32.47%
- Cash-on-cash
- 93.51%
- DSCR
- 5.16
- GRM
- 2.3
CMA / ARV
No comps found within radius.
Projected returns pro-forma
-3.0% appreciation · 3.0% rent growth · sell at horizon
- IRR
- 94.3%
- Equity multiple
- 5.39×
- Total profit
- $79,826
- Equity at exit
- $9,692
- IRR
- 97.1%
- Equity multiple
- 11.22×
- Total profit
- $185,962
- Equity at exit
- $5,620
Cash invested: $18,200 (down + closing). Projections, not guarantees.
Landlord ↔ Tenant lean methodology
- Overall (STATE)
- 73 Landlord-Friendly
- State Ohio
- 73 Landlord-Friendly · R+6
- County
- — inherits STATE
- City
- — inherits STATE
ZIP-level market 44236
- Active inventory
- 95
- Price-to-rent
- 2.3×
Monthly cashflow live
- Estimated rent
- $2,364 medium interval (Pro) →
- Mortgage (P&I)
- −$341
- Tax est. 1.5%
- −$81 /mo · $975/yr
- Insurance
- −$27
- HOA
- −$0
- Vacancy / Maint / Mgmt
- −$496
- Net cashflow
- $1,418
Break-even live
UW: 25.0% down · 7.5% · 30yr · 1.5% tax · 5.0% vac · 8.0% maint · 8.0% mgmt
Financing live
Cash to close
- Down payment
- $16,250
- Closing costs
- $1,950
- Reserves months
- —
- Total cash needed
- —
Loan-product check · same deal, 3 products live
Conventional
25% down · 7.5% · 30yr
- Down + closing
- —
- Monthly P&I
- —
- Monthly cashflow
- —
- DSCR
- —
- Eligible?
- —
Personal DTI + credit; lowest rate.
DSCR
20% down · 8.5% · 30yr
- Down + closing
- —
- Monthly P&I
- —
- Monthly cashflow
- —
- DSCR
- —
- Eligible?
- —
No personal income docs; deal must DSCR.
Hard money
10% down · 12.0% · 12mo
- Down + closing
- —
- Monthly P&I
- —
- Monthly cashflow
- —
- DSCR
- —
- Eligible?
- —
Short-term bridge; refi at stabilization.
Rent comps 3 comps
| Address | Beds | Baths | Sqft | Rent | $/sqft | DOM | Units | Dist |
|---|---|---|---|---|---|---|---|---|
| 725 Bridgeport Ave Streetsboro, OH | 2.0–3.0 | 1.0–2.0 | 1221 | $1,930 | $1.58 | 14d | 25 | 1.13mi |
| 889 Holborn Rd Streetsboro, OH | 3.0 | 2.5 | 2110 | $2,750 | $1.30 | 44d | 1 | 1.39mi |
| 872 W Kensington Ln Streetsboro, OH | 2.0 | 1.5 | 1099 | $1,500 | $1.36 | 14d | 1 | 1.46mi |
Listing history 9 events
-
2026-06-18days on market $65,000 Active 10 DOM
-
2026-06-17days on market $65,000 Active 9 DOM
-
2026-06-16days on market $65,000 Active 8 DOM
-
2026-06-15days on market $65,000 Active 7 DOM
-
2026-06-14days on market $65,000 Active 5 DOM
-
2026-06-13days on market $65,000 Active 4 DOM
-
2026-06-10days on market $65,000 Active 2 DOM
-
2026-06-09remarks 699-char remark
-
2026-06-09$65,000 Active 1 DOM
ⓘ Source: listings_history table (triggers on properties + properties_extension) + one-shot
backfill from property_details.listing_events for pre-trigger history.
Climate risk First Street
- Flood 1/10 Low FEMA zone X (unshaded) · 0% chance over 30 yrs
- Wildfire 1/10 Low
- Heat 2/10 Low 7 d/yr ≥96°F today · 17 d/yr by 30 yrs out
- Wind 1/10 Low
- Air quality 3/10 Moderate 2 unhealthy d/yr today · 3 by 30 yrs out
Nearby sold comps map
Loading sold comps map…
Walkable amenities ~0.75 mi
Loading nearby amenities…
Taxation est. · year 1
- Rental income
- $28,365
- − Mortgage interest
- −$3,641
- − Property taxes
- −$975
- − Insurance
- −$325
- − Repairs & maintenance
- −$2,269
- − Management
- −$2,269
- − Depreciation
- −$1,891
- Taxable income
- $16,995
- Est. tax owed @ 24.0%
- −$4,079
- After-tax cash flow
- $12,939/yr
For passive investors: Depreciation is non-cash, so a rental often shows a tax loss while cash-flowing — sheltering income. Rental losses are passive: they offset passive income freely, and up to $25,000/yr can offset ordinary (W-2) income if you actively participate and your MAGI is under $100k (phasing out to $0 by $150k); unused losses carry forward. On sale, claimed depreciation is recaptured at up to 25%, and gains may owe capital-gains tax (a 1031 exchange can defer both). Figures are a year-1 estimate at your 24.0% rate — not tax advice; consult a CPA.
Condition & rehab AI · 12 photos
This 2005 Fairmont Triumph mobile home is well-maintained and move-in ready, with recent updates including a new roof and furnace. It offers a good condition score and is ready for a fresh coat of paint and carpet replacement to further enhance its resale and rental value.
Value-add opportunities
- Resale paint exterior — enhances curb appeal
- Resale replace carpet — improves comfort and appearance
- Both update kitchen appliances — modernizes space and adds value
Renovation cost estimate screening
Value-add ROI direction
- Resale paint exterior — enhances curb appeal ↑
- Resale replace carpet — improves comfort and appearance ↑
- Both update kitchen appliances — modernizes space and adds value ↑
ⓘ Cost ranges are severity-bucket heuristics (US national rule-of-thumb). Get contractor quotes + a written scope before underwriting a rehab budget.
Schools (NCES district)
- District
- Streetsboro City
- NCES district ID
- 3904923
- Math proficiency
- 44% ▼ -20.00%
- Reading proficiency
- 56% ▼ -13.00%
- Median HH income
- $59,660
- Composite
- 43.66/100
- National rank
- #2960
- State rank
- #425 of 656 in OH
Livability — Streetsboro
- Score
- 77/100
- State rank
- #194
- US rank
- #2965
Category grades
Schools grade is shown separately in the Schools card above.
Census & demographics
- Census place
- Streetsboro, OH
- County
- Summit County · 440,783 people
- City population
- 18,355
- Metro
- Akron, OH
- Population (ZIP)
- 25,941
- Household income
- $168,595
- Rent vs Own
- Severe rent burden
- 276.0
Population outlook (Portage County) Hauer SSP2
- Today (2025)
- 166,109 people
- By 2030
- 167,752 · +1.0%
- By 2040
- 168,640 · +1.5%
- By 2050
- 167,469 · +0.8%
- By 2075
- 170,131 · +2.4%
- By 2100
- 167,958 · +1.1%
Race, ethnicity, and origin ACS 2023
- Neighborhood character
- Predominantly White (88%)
- Race & ethnicity
- White 88% Two or more races 4% Black 4% Asian 3% Hispanic / Latino 2%
- Common ancestry
- Romanian 7% Slovak 3% Lithuanian 3%
- Foreign-born
- 6% · Canada, China, South Korea
- Languages at home
- 93% English-only · Other Indo-European 1% Chinese 1% Spanish 1%
Political lean MEDSL · Portage
- 2024 margin
- R (+15.5) · D 41.8% · R 57.3%
- 2008→2024 swing
- -24.5pp toward R · 2008: 9.0pp · 2024: -15.5pp
- All cycles
- 2024: R+15.5 2020: R+12.5 2016: R+10.2 2012: D+4.9 2008: D+9.0
Not yet ingested
- Civics
- —
Market trends
- HPI YoY
- ▼ -238.26%
- Current HPI
- 218.638
- Rent YoY
- —
- Metro
- Akron, OH
- State GDP YoY
- ▲ 1.98%
- F500 in state
- 48
Industry mix (Fortune 500 HQ in OH)
| Industry | F500 HQs | Revenue |
|---|---|---|
| Insurance | 3 | $145B |
|
||
| Industrial Machinery | 3 | $49B |
|
||
| Financial Services | 3 | $24B |
|
||
| Consumer Goods | 2 | $93B |
|
||
| Aerospace / Defense | 2 | $47B |
|
||
| Utilities | 2 | $33B |
|
||
Price history
1 event — show timeline
- 2026-06-08 Listed $65,000 MLSNOW
Cash-flow waterfall
monthlySold comps — $/sqft
last 12 mo · ≤1 miLoading sold comps…