 🏗️ New Construction
Pima Plan · San Antonio, TX
Flood risk No data
- FEMA flood zone
- —
- Chance of flooding over 30 yrs
- —
- Est. flood insurance / yr
- —
Fire risk No data
- Est. fire insurance / yr
- —
Heat risk No data
- Hot days now (above threshold)
- —
- Hot days in 30 yrs
- —
Wind risk No data
- Chance of severe wind over 30 yrs
- —
Air-quality risk No data
- Unhealthy air days now
- —
- Unhealthy air days in 30 yrs
- —
Risk factors via First Street. Map © Google.
Why this score? — see what drove the F grade
The composite is a weighted blend of 9 inputs, each scored 0–100. Each bar is that input's sub-score; the figure is the points it added to the 100-point composite (weight × sub-score).
- ARV discount +7.5/15.0
- Condition / age +5.0/5.0
- Livability +4.0/5.0
- Schools +3.8/10.0
- Cash flow +2.4/30.0
- Rent growth +1.7/5.0
- 1% rule +0.0/10.0
- DSCR +0.0/10.0
- Appreciation +0.0/10.0
$166,999
🖨 Deal sheet (PDF) 📄 Offer letter ✓ Due diligence
Listing remarks MLS
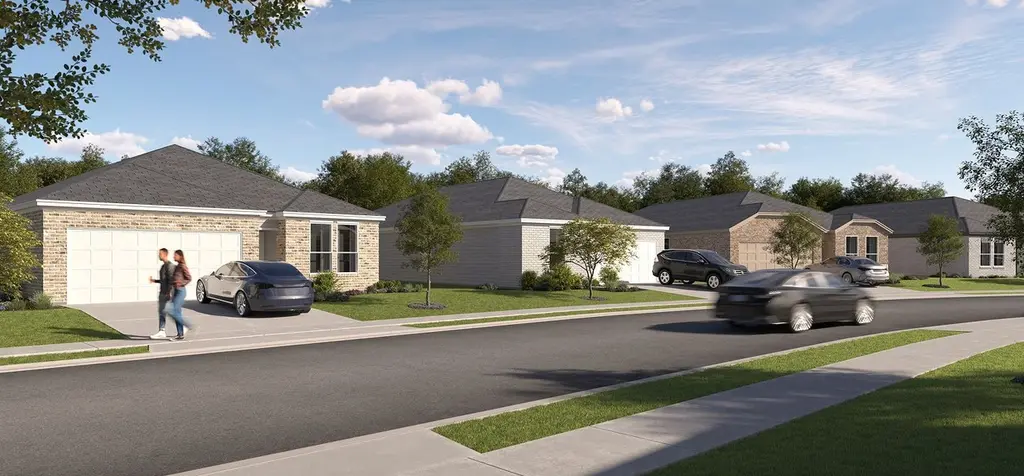
The Wellton Collection is a new series of single-family homes in the Grace Gardens masterplan in San Antonio, TX, offering affordable new home options with a variety of floorplan designs. Residents will enjoy proximity to Loop 410 for easy access to local shopping, dining and entertainment options. Outdoor recreation is a short drive away on Calaveras Lake, and the community is located near Brooks City Base, perfect for military families and personnel.
Key facts
- Outdoor recreation
- Calaveras lake
- Garage
Tags
Neighborhood map
What this means for you Summary
Snapshot
- This is a 3-bed/2.5-bath single-family listed at $167k. Condition is rated excellent.
Deal economics
- At list price, monthly cash flow is $-1k ($-16k/yr) — negative.
- The deal already cash-flows at list — no discount required.
- To meet the 1% rule (rent ≥ 1% of price), the offer needs to be $160k (4.1% below list).
- Recommended offer: $147k (12.0% below list) — sets the bar for market timing.
- Cap rate 2.1% vs local median 3.8% in San Antonio — below-typical yield; the buyer is paying a premium for something (appreciation thesis, condition, location) that the cap rate doesn't capture.
Location & tenants
- Location reads 80/100 on livability (#31 in TX, #1,616 nationally) — a professional / high-income tenant draw. Strengths: amenities A+, commute A+, cost of living A+; Watch: crime F.
- North East ISD (urban): math 38% / reading 49% proficiency, ranked #276 of 826 in TX (top 33%) — families likely to look elsewhere, expect single-tenant / working-renter base with shorter leases.
- Zoned schools: Oak Grove El (math 17% / reading 37%, grade F, #2,791 of 4,322 statewide, top 68%, 389 students, 88% FRL); Garner Middle (math 17% / reading 30%, grade F, #1,317 of 1,662 statewide, top 80%, 804 students, 83% FRL); Macarthur H S (math 31% / reading 51%, grade F, #774 of 1,632 statewide, top 49%, 2,055 students, 58% FRL) — zoned schools average 77% FRL vs 41% district-wide (35 pts higher); higher-poverty schools than district average — tighter screening recommended.
- Zoned-school proficiency averages 30% at this address vs 44% district-wide (-13 pts) — the specific schools serving this property underperform the North East ISD average; the district grade overstates school quality for this exact location.
- Market conditions: Rents falling (-3.4%/yr); 329 active listings in the ZIP; 40 comparable units currently listed for rent nearby; rentals leasing fast (median 10d on market — plan ~1-2 weeks tenant-placement turnaround); 8,308 units permitted in Bexar County in 2024 (2,506 in 5+ unit buildings).
- This rent runs 37% of the median local income ($52k/yr) — at the standard rent-burdened threshold; future hikes will face affordability resistance.
Forward outlook
- Local home prices are declining (-3.0%/yr); year-one equity from $3k of loan paydown is wiped out by about $11k of value loss. Plan a longer hold.
- Bexar County population projected at +50% by 2050 — long-run rental-demand tailwind backs the buy-and-hold thesis.
Negotiation context
- It's been on market 121 days — a 12% lower offer ($147k) is reasonable based on typical stale-listing flexibility.
Risks & watch-outs
- Watch-outs: property tax is 3.3% of price.
Questions for the listing agent
- What do current leases actually rent for vs. the listed asking? Can we see a recent rent roll and the last 12 months of T-12 income?
- It's been on market 121 days. Have you received any prior offers? Is the seller open to a 12% concession, seller financing, or rate buy-down credit?
- Property tax is high relative to price — has the assessment been appealed recently, and will the sale trigger a re-assessment?
- Why hasn't it sold? Are there any deal-killer items the seller is aware of (foundation, flood, title, zoning, code violations)?
- Is there a deadline driving the sale (1031 exchange, divorce, estate, relocation)? That informs how much negotiation room exists.
- Crime grade is F in this area — have there been break-ins, vandalism, or insurance claims at this property in the last 3 years? What carrier currently insures it and at what premium?
- The area grade is low — what's the realistic commute time and amenity access for the typical tenant pool here? Any planned neighborhood developments (good or bad) we should know about?
- What's the average days-on-market for RENTAL listings here right now (not sales)? A rising rental-DOM trend means longer vacancies and softer asking-rent achievability than the comps imply.
- What's the recent tenant-quality profile in this submarket — average credit score on applications, eviction rate, late-payment / NSF rate, and stable-employment percentage? A property-management company in the area should have these aggregated.
- How much new for-sale + rental construction is in the pipeline within 1–3 miles? Heavy new supply typically softens prices + rents 12–24 months out; constrained supply supports both.
Investment metrics
- 1% rule
- 0.43% ✗
- Cap rate
- 2.08%
- Cash-on-cash
- -15.05%
- DSCR
- 0.33
- GRM
- 19.4
CMA / ARV
- ARV (median comp)
- $371,976
- List price
- $166,999
- Delta
- -55.10%
- Verdict
- UNDERPRICED
- Comps
- 20 within 1.0 mi
Show comp detail 4 sales within ~0.75 mi
| Address | Dist | Beds/Ba | Sqft | Sold | Price | $/sf | Match |
|---|---|---|---|---|---|---|---|
| 2918 Chisholm Trl | 0.22mi | 3/2.0 | 1,282 (-6%) | 2mo | $299,000 | $233 | 76 |
| 271 Middlebury | 0.70mi | 3/1.0 | 1,332 (-2%) | 6mo | $170,000 | $128 | 53 |
| 8715 Oak Ledge | 0.58mi | 3/2.0 | 1,511 (+11%) | 10mo | $359,000 | $238 | 44 |
| 8618 Sagebrush Ln | 0.61mi | 3/2.0 | 1,556 (+14%) | 24mo | $325,000 | $209 | 26 |
Match score weights: distance 35% · size 25% · config 20% · recency 20%. Top-matched comps best support the ARV.
Projected returns pro-forma
-3.0% appreciation · 0.0% rent growth · sell at horizon
- IRR
- -48.3%
- Equity multiple
- -0.42×
- Total profit
- $-148,129
- Equity at exit
- $55,463
- IRR
- —
- Equity multiple
- -1.44×
- Total profit
- $-254,134
- Equity at exit
- $32,162
Cash invested: $104,153 (down + closing). Projections, not guarantees.
Landlord ↔ Tenant lean methodology
- Overall (STATE)
- 87 Strongly Landlord-Friendly
- State Texas
- 87 Strongly Landlord-Friendly · R+5
- County
- — inherits STATE
- City
- — inherits STATE
ZIP-level market 78223
- Home prices YoY
- -16.4%
- Rents YoY
- -3.4%
- Active inventory
- 329
- Price-to-rent
- 8.7×
Monthly cashflow live
- Estimated rent
- $1,601 high interval (Pro) →
- Mortgage (P&I)
- −$1,951
- Tax est. 1.5%
- −$465 /mo · $5,580/yr
- Insurance
- −$155
- HOA
- −$0
- Vacancy / Maint / Mgmt
- −$336
- Net cashflow
- $-1,306
Break-even live
Sensitivity live
| Price | -10% $-1,049 | -5% $-1,178 | +0% $-1,306 | +5% $-1,435 | +10% $-1,563 |
|---|---|---|---|---|---|
| Rent | -10% $-1,433 | -5% $-1,369 | +0% $-1,306 | +5% $-1,243 | +10% $-1,180 |
| Rate | -1.0pp $-1,119 | -0.5pp $-1,211 | base $-1,306 | +0.5pp $-1,402 | +1.0pp $-1,501 |
UW: 25.0% down · 7.5% · 30yr · 1.5% tax · 5.0% vac · 8.0% maint · 8.0% mgmt
Financing live
Cash to close
- Down payment
- $92,994
- Closing costs
- $11,159
- Reserves months
- —
- Total cash needed
- —
Loan-product check · same deal, 3 products live
Conventional
25% down · 7.5% · 30yr
- Down + closing
- —
- Monthly P&I
- —
- Monthly cashflow
- —
- DSCR
- —
- Eligible?
- —
Personal DTI + credit; lowest rate.
DSCR
20% down · 8.5% · 30yr
- Down + closing
- —
- Monthly P&I
- —
- Monthly cashflow
- —
- DSCR
- —
- Eligible?
- —
No personal income docs; deal must DSCR.
Hard money
10% down · 12.0% · 12mo
- Down + closing
- —
- Monthly P&I
- —
- Monthly cashflow
- —
- DSCR
- —
- Eligible?
- —
Short-term bridge; refi at stabilization.
Rent comps 40 comps
| Address | Beds | Baths | Sqft | Rent | $/sqft | DOM | Units | Dist |
|---|---|---|---|---|---|---|---|---|
| 1983 Oakwell Farms Pkwy Unit 710 San Antonio, TX | 2.0 | 2.0 | 1018 | $1,152 | $1.13 | 0d | 1 | 0.47mi |
| 1422 NE Loop 410 San Antonio, TX | 1.0–2.0 | 1.0–2.0 | 959 | $1,165 | $1.21 | 4d | 8 | 0.50mi |
| 8555 Laurens Ln San Antonio, TX | 1.0–2.0 | 1.0–2.0 | 892 | $1,599 | $1.79 | 5d | 28 | 0.50mi |
| 8555 Laurens Ln Unit 710 San Antonio, TX | 2.0 | 2.0 | 1073 | $1,373 | $1.28 | 13d | 1 | 0.53mi |
| 414 Laramie Dr San Antonio, TX | 3.0 | 2.0 | 1760 | $2,295 | $1.30 | 26d | 1 | 0.53mi |
| 515 Cave Ln San Antonio, TX | 3.0 | 2.0 | 1741 | $2,500 | $1.44 | 0d | 1 | 0.59mi |
| 8702 Village Dr #1306 San Antonio, TX | 3.0 | 2.0 | 1200 | $2,500 | $2.08 | 46d | 1 | 0.64mi |
| 3270 Nacogdoches Rd San Antonio, TX | 1.0–2.0 | 1.0–2.0 | 712 | $1,150 | $1.62 | 5d | 1 | 0.67mi |
| 33 Lynn Batts Ln San Antonio, TX | 1.0–3.0 | 1.0–2.0 | 1040 | $1,680 | $1.62 | 5d | 22 | 0.67mi |
| 2935 Nacogdoches Rd San Antonio, TX | 1.0–2.0 | 1.0–2.0 | 998 | $1,300 | $1.30 | 46d | 2 | 0.68mi |
| 407 Haverford Dr San Antonio, TX | 4.0 | 2.0 | 1412 | $1,600 | $1.13 | 5d | 1 | 0.74mi |
| 123 Westchester Dr San Antonio, TX | 2.0 | 2.0 | 1337 | $1,895 | $1.42 | 26d | 1 | 0.75mi |
| 2811 Woodbury St #201 San Antonio, TX | 2.0 | 1.5 | 982 | $1,295 | $1.32 | 10d | 1 | 0.76mi |
| 2811 Woodbury Dr #403 San Antonio, TX | 2.0 | 1.5 | 982 | $1,190 | $1.21 | 10d | 1 | 0.76mi |
| 2803 Woodbury St San Antonio, TX | 1.0–2.0 | 1.0–2.0 | 825 | $950 | $1.15 | 10d | 1 | 0.78mi |
| 2606 Country Square St San Antonio, TX | 3.0 | 2.5 | 1804 | $2,500 | $1.39 | 26d | 1 | 0.80mi |
| 231 Middlebury Dr San Antonio, TX | 3.0 | 2.0 | 1321 | $2,100 | $1.59 | 46d | 1 | 0.81mi |
| 3216 Urban Crest Dr San Antonio, TX | 2.0 | 1.0 | 930 | $1,650 | $1.77 | 20d | 1 | 0.82mi |
| 8623 Starcrest Dr Unit 710 San Antonio, TX | 2.0 | 2.0 | 1292 | $1,357 | $1.05 | 5d | 1 | 0.82mi |
| 8623 Starcrest Dr Unit X07 San Antonio, TX | 2.0 | 1.0 | 1082 | $1,225 | $1.13 | 17d | 1 | 0.82mi |
| 8623 Starcrest Dr Apt X1 San Antonio, TX | 2.0 | 2.0 | 1453 | $1,549 | $1.07 | 5d | 1 | 0.82mi |
| 8623 Starcrest Dr Apt Y8 San Antonio, TX | 2.0 | 2.0 | 1325 | $1,349 | $1.02 | 5d | 1 | 0.82mi |
| 8623 Starcrest Dr Unit Q01 San Antonio, TX | 2.0 | 2.0 | 1292 | $1,249 | $0.97 | 0d | 1 | 0.82mi |
| 8623 Starcrest Dr Unit P05 San Antonio, TX | 2.0 | 1.0 | 986 | $1,099 | $1.11 | 5d | 1 | 0.82mi |
| 8623 Starcrest Dr Unit X05 San Antonio, TX | 2.0 | 2.0 | 1873 | $1,699 | $0.91 | 0d | 1 | 0.82mi |
| 3831 Harry Wurzbach Rd #6 San Antonio, TX | 3.0 | 2.5 | 1506 | $2,000 | $1.33 | 16d | 1 | 0.84mi |
| 3831 Harry Wurzbach Rd #6 San Antonio, TX | 3.0 | 2.5 | 1506 | $2,000 | $1.33 | 0d | 1 | 0.84mi |
| 3819 Harry Wurzbach Rd Unit 3213 San Antonio, TX | 3.0 | 2.0 | 1352 | $1,949 | $1.44 | 0d | 1 | 0.90mi |
| 3819 Harry Wurzbach Rd Unit 2213 San Antonio, TX | 2.0 | 2.0 | 1008 | $1,589 | $1.58 | 0d | 1 | 0.90mi |
| 3223 Oakleaf Dr San Antonio, TX | 3.0 | 2.0 | 1542 | $1,850 | $1.20 | 26d | 1 | 0.90mi |
| 8800 Starcrest Dr Unit 710 San Antonio, TX | 2.0 | 2.0 | 959 | $815 | $0.85 | 46d | 1 | 0.94mi |
| 8800 Starcrest Dr San Antonio, TX | 1.0–4.0 | 1.0–2.5 | 1196 | $1,299 | $1.09 | 0d | 16 | 0.98mi |
| 211 Eastley Dr San Antonio, TX | 3.0 | 2.0 | 987 | $1,550 | $1.57 | 26d | 1 | 1.03mi |
| 3843 Barrington St San Antonio, TX | 1.0–2.0 | 1.0 | 869 | $1,300 | $1.50 | 46d | 2 | 1.13mi |
| 3843 Barrington St Unit 165Q San Antonio, TX | 2.0 | 2.0 | 888 | $995 | $1.12 | 46d | 1 | 1.13mi |
| 3843 Barrington St Unit 242K San Antonio, TX | 2.0 | 2.0 | 884 | $1,495 | $1.69 | 18d | 1 | 1.13mi |
| 10014 Broadway San Antonio, TX | 1.0–3.0 | 1.0–2.0 | 1062 | $1,540 | $1.45 | 26d | 15 | 1.17mi |
| 3518 Herron Ct San Antonio, TX | 3.0 | 2.0 | 1772 | $1,800 | $1.02 | 26d | 1 | 1.21mi |
| 151 Treasure Way San Antonio, TX | 2.0 | 2.0 | 1314 | $1,500 | $1.14 | 46d | 2 | 1.21mi |
| 3903 Barrington St Apt 710 San Antonio, TX | 2.0 | 2.0 | 1004 | $919 | $0.92 | 0d | 1 | 1.22mi |
Listing history 16 events
-
2026-06-21days on market $166,999 Active 121 DOM
-
2026-06-18days on market $166,999 Active 118 DOM
-
2026-06-17days on market $166,999 Active 117 DOM
-
2026-06-16days on market $166,999 Active 116 DOM
-
2026-06-13days on market $166,999 Active 113 DOM
-
2026-06-13days on market $166,999 Active 112 DOM
-
2026-06-09days on market $166,999 Active 109 DOM
-
2026-06-08days on market $166,999 Active 108 DOM
-
2026-06-07days on market $166,999 Active 107 DOM
-
2026-06-04days on market $166,999 Active 104 DOM
-
2026-06-03days on market $166,999 Active 103 DOM
-
2026-06-02pricedays on market $166,999 Active 102 DOM
-
2026-06-01days on market $167,999 Active 101 DOM
-
2026-05-31days on market $167,999 Active 100 DOM
-
2026-05-08price $167,999 456-char remark
Show marketing remark (456 chars)
The Wellton Collection is a new series of single-family homes in the Grace Gardens masterplan in San Antonio, TX, offering affordable new home options with a variety of floorplan designs. Residents will enjoy proximity to Loop 410 for easy access to local shopping, dining and entertainment options. Outdoor recreation is a short drive away on Calaveras Lake, and the community is located near Brooks City Base, perfect for military families and personnel.
-
2026-02-20$168,999 Active 456-char remark
Show marketing remark (456 chars)
The Wellton Collection is a new series of single-family homes in the Grace Gardens masterplan in San Antonio, TX, offering affordable new home options with a variety of floorplan designs. Residents will enjoy proximity to Loop 410 for easy access to local shopping, dining and entertainment options. Outdoor recreation is a short drive away on Calaveras Lake, and the community is located near Brooks City Base, perfect for military families and personnel.
ⓘ Source: listings_history table (triggers on properties + properties_extension) + one-shot
backfill from property_details.listing_events for pre-trigger history.
Nearby sold comps map
Loading sold comps map…
Walkable amenities ~0.75 mi
Loading nearby amenities…
Taxation est. · year 1
- Rental income
- $19,208
- − Mortgage interest
- −$20,836
- − Property taxes
- −$5,580
- − Insurance
- −$1,860
- − Repairs & maintenance
- −$1,537
- − Management
- −$1,537
- − Depreciation
- −$10,821
- Taxable loss
- −$22,962
- Est. tax savings @ 24.0%
- +$5,511
- After-tax cash flow
- $-10,162/yr
For passive investors: Depreciation is non-cash, so a rental often shows a tax loss while cash-flowing — sheltering income. Rental losses are passive: they offset passive income freely, and up to $25,000/yr can offset ordinary (W-2) income if you actively participate and your MAGI is under $100k (phasing out to $0 by $150k); unused losses carry forward. On sale, claimed depreciation is recaptured at up to 25%, and gains may owe capital-gains tax (a 1031 exchange can defer both). Figures are a year-1 estimate at your 24.0% rate — not tax advice; consult a CPA.
Condition & rehab AI · 1 photo
This single-family home in San Antonio, TX, is in excellent condition with no visible repairs or maintenance needed. It offers a new home experience with modern amenities and a prime location.
Schools (NCES district)
- District
- North East ISD
- NCES district ID
- 4832940
- Math proficiency
- 38% ▼ -14.00%
- Reading proficiency
- 49% ▼ -4.00%
- Median HH income
- $57,715
- Composite
- 38.1/100
- National rank
- #4276
- State rank
- #276 of 826 in TX
Livability — San Antonio
- Score
- 80/100
- State rank
- #31
- US rank
- #1616
Category grades
Schools grade is shown separately in the Schools card above.
Census & demographics
- Census place
- San Antonio, TX
- County
- Bexar County · 1,990,555 people
- City population
- 1,806,925
- Metro
- San Antonio-New Braunfels, TX
- Population (ZIP)
- 58,983
- Household income
- $52,088
- Rent vs Own
- Severe rent burden
- 2809.0
Population outlook (Bexar County) Hauer SSP2
- Today (2025)
- 2,336,851 people
- By 2030
- 2,560,728 · +9.6%
- By 2040
- 3,020,569 · +29.3%
- By 2050
- 3,493,522 · +49.5%
- By 2075
- 4,668,459 · +99.8%
- By 2100
- 5,533,242 · +136.8%
Race, ethnicity, and origin ACS 2023
- Neighborhood character
- Predominantly Hispanic (76%)
- Race & ethnicity
- Hispanic / Latino 76% Two or more races 28% White 16% Black 5% Asian 2% Native American 1%
- Hispanic origin (detail)
- Mexican 67%
- Common ancestry
- Lithuanian 2% Romanian 1% Slovak 1%
- Foreign-born
- 10% · Canada, Vietnam
- Languages at home
- 63% English-only · Spanish 36%
Political lean MEDSL · Bexar
- 2024 margin
- Lean D (+9.8) · D 54.3% · R 44.6% · Other 1.1%
- 2008→2024 swing
- +4.2pp toward D · 2008: 5.6pp · 2024: 9.8pp
- All cycles
- 2024: D+9.8 2020: D+18.2 2016: D+13.5 2012: D+4.6 2008: D+5.6
Not yet ingested
- Civics
- —
Market trends
- HPI YoY
- ▼ -52.06%
- Current HPI
- 265.2235
- Rent YoY
- ▼ -3.36%
- Metro
- San Antonio-New Braunfels, TX
- State GDP YoY
- ▲ 3.95%
- F500 in state
- 110
Industry mix (Fortune 500 HQ in TX)
| Industry | F500 HQs | Revenue |
|---|---|---|
| Energy | 16 | $1,198B |
|
||
| Technology | 5 | $198B |
|
||
| Engineering / Construction | 4 | $72B |
|
||
| Energy Services | 3 | $60B |
|
||
| Utilities | 3 | $41B |
|
||
| Healthcare | 2 | $330B |
|
||
Price history
-0.6% since first listed2 events — show timeline
- 2026-05-08 Price Changed $167,999 Zillow
- 2026-02-20 Listed $168,999 Zillow
Cash-flow waterfall
monthlySold comps — $/sqft
last 12 mo · ≤1 miLoading sold comps…