 🏷️ Likely Rental
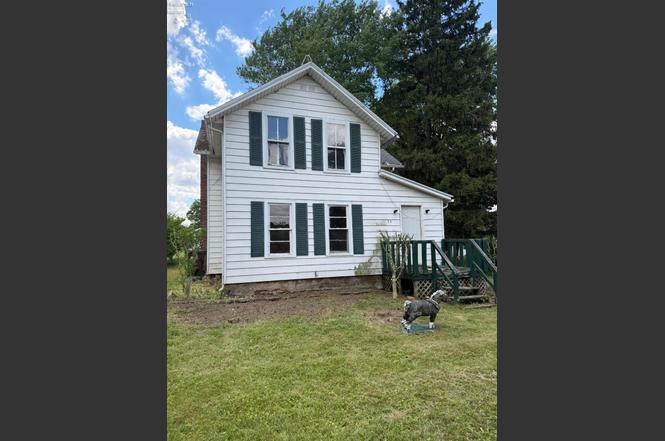
54 S Kniffin St · Greenwich, OH
Flood risk 1/10 · Minimal
- FEMA flood zone
- X (unshaded)
- Chance of flooding over 30 yrs
- 0.0%
- Est. flood insurance / yr
- $473 – $860
Fire risk 1/10 · Minimal
- Est. fire insurance / yr
- $713 – $1,323
Heat risk 3/10 · Minor
- Hot days now (above 98°F)
- 7 days/yr
- Hot days in 30 yrs
- 16 days/yr
Wind risk 1/10 · Minimal
- Chance of severe wind over 30 yrs
- —
Air-quality risk 2/10 · Minimal
- Unhealthy air days now
- 1 days/yr
- Unhealthy air days in 30 yrs
- 1 days/yr
Risk factors via First Street. Map © Google.
Why this score? — see what drove the C+ grade
The composite is a weighted blend of 9 inputs, each scored 0–100. Each bar is that input's sub-score; the figure is the points it added to the 100-point composite (weight × sub-score).
- Cash flow +25.4/30.0
- DSCR +8.4/10.0
- ARV discount +7.5/15.0
- 1% rule +6.4/10.0
- Schools +4.7/10.0
- Livability +3.4/5.0
- Rent growth +2.5/5.0
- Condition / age +2.5/5.0
- Appreciation +0.0/10.0
$115,000
🖨 Deal sheet 📄 Offer letter ✓ Due diligence
Listing remarks
Investment opportunity! This tenant-occupied home offers immediate income potential. Please allow a minimum of 24 hours' notice for all showings. Contact your agent today for more information or to schedule a viewing.
Key facts
- 0.94 acre lot
- 3 garage spots
- Built 1945
Property features AI
Exterior
- Parking: Detached 3-car garage
- Utilities: Public water; Septic tank sewer
- Home design: Single-family residence; Residential property
- Construction: Vinyl siding
- Exterior features: Asphalt roof; Lot dimensions approximately 82 x 498
Interior
- Bathrooms: 1 full bathroom
- Heating & cooling: Natural gas heating; Forced air heating
- Interior features: Full basement; 8 total rooms
Neighborhood map
What this means for you Summary
Snapshot
- This is a 4-bed/1.0-bath single-family listed at $115k.
Deal economics
- At list price, monthly cash flow is $265 ($3k/yr) — positive.
- The deal already cash-flows at list — no discount required.
- Meets the 1% rule at list price ($1k rent vs $115k).
Location & tenants
- Location reads 67/100 on livability (#615 in OH) — a middle-class / working-renter tenant base. Strengths: crime A+, cost of living A+, housing A+; Watch: employment D, amenities F, commute F.
- South Central Local (rural): math 53% / reading 56% proficiency, ranked #376 of 656 in OH (top 57%) — acceptable for families but not a draw, mixed tenant base, ~2y average lease.
- Market conditions: 12 active listings in the ZIP; 40 units permitted in Huron County in 2024 (0 in 5+ unit buildings).
Forward outlook
- Local home prices are declining (-3.0%/yr); year-one equity from $795 of loan paydown is wiped out by about $3k of value loss. Plan a longer hold.
- Huron County population projected at -22% by 2050 — secular population decline; favor cash flow + early exit over multi-decade hold.
Negotiation context
- Only 2 days on market — expect competitive offers; lowballing is unlikely to land.
- 3 sale attempts since 5y ago with the ask held roughly flat each time — persistent listings suggest the price (not the market) is what's stuck; bring a comps-based counter.
Risks & watch-outs
- Watch-outs: built in 1945 — expect roof / HVAC / electrical / plumbing capex.
Questions for the listing agent
- Built in 1945 — when were the roof, HVAC, electrical panel, plumbing, and water heater last replaced?
- Is there a deadline driving the sale (1031 exchange, divorce, estate, relocation)? That informs how much negotiation room exists.
- What's the average days-on-market for RENTAL listings here right now (not sales)? A rising rental-DOM trend means longer vacancies and softer asking-rent achievability than the comps imply.
- What's the recent tenant-quality profile in this submarket — average credit score on applications, eviction rate, late-payment / NSF rate, and stable-employment percentage? A property-management company in the area should have these aggregated.
- How much new for-sale + rental construction is in the pipeline within 1–3 miles? Heavy new supply typically softens prices + rents 12–24 months out; constrained supply supports both.
Investment metrics
- 1% rule
- 1.14% ✓
- Cap rate
- 9.06%
- Cash-on-cash
- 9.87%
- DSCR
- 1.44
- GRM
- 7.3
CMA / ARV
- ARV (on-the-fly)
- $292,734
- Comps found
- 6
Show comp detail 6 sales within ~0.75 mi
| Address | Dist | Beds/Ba | Sqft | Sold | Price | $/sf | Match |
|---|---|---|---|---|---|---|---|
| 16 Senior Dr | 0.19mi | 3/2.0 (-1) | 1,850 (+2%) | 1mo | $275,000 | $149 | 78 |
| 24 S Kniffin St | 0.18mi | 3/2.0 (-1) | 1,860 (+3%) | 2mo | $200,000 | $108 | 76 |
| 24 Senior Dr | 0.15mi | 3/2.0 (-1) | 1,868 (+3%) | 11mo | $350,000 | $187 | 69 |
| 2235 Us Highway 224 E | 0.46mi | 4/2.0 | 1,792 (-1%) | 12mo | $269,777 | $151 | 63 |
| 20 Senior Dr | 0.17mi | 3/3.0 (-1) | 1,976 (+9%) | 8mo | $400,000 | $202 | 57 |
| 9 Senior Dr | 0.22mi | 3/2.5 (-1) | 1,690 (-6%) | 19mo | $274,000 | $162 | 52 |
Match score weights: distance 35% · size 25% · config 20% · recency 20%. Top-matched comps best support the ARV.
Projected returns pro-forma
-3.0% appreciation · 3.0% rent growth · sell at horizon
- IRR
- -1.4%
- Equity multiple
- 0.95×
- Total profit
- $-1,756
- Equity at exit
- $17,147
- IRR
- 8.3%
- Equity multiple
- 1.63×
- Total profit
- $20,228
- Equity at exit
- $9,943
Cash invested: $32,200 (down + closing). Projections, not guarantees.
Landlord ↔ Tenant lean methodology
- Overall (STATE)
- 73 Landlord-Friendly
- State Ohio
- 73 Landlord-Friendly · R+6
- County
- — inherits STATE
- City
- — inherits STATE
ZIP-level market 44837
- Home prices YoY
- -5.6%
- Active inventory
- 12
- Price-to-rent
- 7.3×
Monthly cashflow live
- Estimated rent
- $1,317 medium interval (Pro) →
- Mortgage (P&I)
- −$603
- Tax from tax record
- −$124 /mo · $1,492/yr
- Insurance
- −$48
- HOA
- −$0
- Vacancy / Maint / Mgmt
- −$277
- Net cashflow
- $265
Break-even live
UW: 25.0% down · 7.5% · 30yr · 1.5% tax · 5.0% vac · 8.0% maint · 8.0% mgmt
Financing live
Cash to close
- Down payment
- $28,750
- Closing costs
- $3,450
- Reserves months
- —
- Total cash needed
- —
Loan-product check · same deal, 3 products live
Conventional
25% down · 7.5% · 30yr
- Down + closing
- —
- Monthly P&I
- —
- Monthly cashflow
- —
- DSCR
- —
- Eligible?
- —
Personal DTI + credit; lowest rate.
DSCR
20% down · 8.5% · 30yr
- Down + closing
- —
- Monthly P&I
- —
- Monthly cashflow
- —
- DSCR
- —
- Eligible?
- —
No personal income docs; deal must DSCR.
Hard money
10% down · 12.0% · 12mo
- Down + closing
- —
- Monthly P&I
- —
- Monthly cashflow
- —
- DSCR
- —
- Eligible?
- —
Short-term bridge; refi at stabilization.
Listing history 3 events
-
2026-06-19days on market $115,000 Active 2 DOM
-
2026-06-17remarks 217-char remark
-
2026-06-17$115,000 Active 1 DOM
ⓘ Source: listings_history table (triggers on properties + properties_extension) + one-shot
backfill from property_details.listing_events for pre-trigger history.
Tax reassessment forecast OH · Partial reset (capped growth)
- Current annual tax
- $1,492 · $124/mo
- Projected year-2 tax
- $1,643 · $137/mo
- Expected delta
- +$151/yr (+$13/mo · 10.1%)
ⓘ Screening estimate from a state-policy table — verify with the county assessor before closing.
Climate risk First Street
- Flood 1/10 Low FEMA zone X (unshaded) · 0% chance over 30 yrs
- Wildfire 1/10 Low
- Heat 3/10 Moderate 7 d/yr ≥98°F today · 16 d/yr by 30 yrs out
- Wind 1/10 Low
- Air quality 2/10 Low 1 unhealthy d/yr today · 1 by 30 yrs out
Nearby sold comps map
Loading sold comps map…
Walkable amenities ~0.75 mi
Loading nearby amenities…
Taxation est. · year 1
- Rental income
- $15,800
- − Mortgage interest
- −$6,442
- − Property taxes
- −$1,492
- − Insurance
- −$575
- − Repairs & maintenance
- −$1,264
- − Management
- −$1,264
- − Depreciation
- −$3,345
- Taxable income
- $1,418
- Est. tax owed @ 24.0%
- −$340
- After-tax cash flow
- $2,838/yr
For passive investors: Depreciation is non-cash, so a rental often shows a tax loss while cash-flowing — sheltering income. Rental losses are passive: they offset passive income freely, and up to $25,000/yr can offset ordinary (W-2) income if you actively participate and your MAGI is under $100k (phasing out to $0 by $150k); unused losses carry forward. On sale, claimed depreciation is recaptured at up to 25%, and gains may owe capital-gains tax (a 1031 exchange can defer both). Figures are a year-1 estimate at your 24.0% rate — not tax advice; consult a CPA.
Schools (NCES district)
- District
- South Central Local
- NCES district ID
- 3904773
- Math proficiency
- 53% ▼ -11.00%
- Reading proficiency
- 56% ▼ -3.00%
- Median HH income
- $50,657
- Composite
- 46.57/100
- National rank
- #2425
- State rank
- #376 of 656 in OH
Livability — Greenwich
- Score
- 67/100
- State rank
- #615
- US rank
- #10621
Category grades
Schools grade is shown separately in the Schools card above.
Census & demographics
- Census place
- Greenwich, OH
- County
- Huron · 56,496 people
- Population (ZIP)
- 4,514
- Household income
- $69,513
- Rent vs Own
- Severe rent burden
- 11.5
Population outlook (Huron County) Hauer SSP2
- Today (2025)
- 55,572 people
- By 2030
- 53,514 · -3.7%
- By 2040
- 48,770 · -12.2%
- By 2050
- 43,611 · -21.5%
- By 2075
- 32,349 · -41.8%
- By 2100
- 21,849 · -60.7%
Race, ethnicity, and origin ACS 2023
- Neighborhood character
- Predominantly White (94%)
- Race & ethnicity
- White 94% Two or more races 6%
- Common ancestry
- Hungarian 3% Polish 2% Serbian 2%
- Foreign-born
- 1% · Vietnam
- Languages at home
- 90% English-only · German/W. Germanic 10%
Political lean MEDSL · Huron
- 2024 margin
- Solid R (+44.0) · D 27.6% · R 71.6%
- 2008→2024 swing
- -40.9pp toward R · 2008: -3.1pp · 2024: -44.0pp
- All cycles
- 2024: R+44.0 2020: R+41.2 2016: R+36.4 2012: R+8.9 2008: R+3.1
Not yet ingested
- Civics
- —
Market trends
- HPI YoY
- ▼ -15.77%
- Current HPI
- 265.9942
- Rent YoY
- —
- Metro
- —
- State GDP YoY
- ▲ 1.98%
- F500 in state
- 48
Industry mix (Fortune 500 HQ in OH)
| Industry | F500 HQs | Revenue |
|---|---|---|
| Insurance | 3 | $145B |
|
||
| Industrial Machinery | 3 | $49B |
|
||
| Financial Services | 3 | $24B |
|
||
| Consumer Goods | 2 | $93B |
|
||
| Aerospace / Defense | 2 | $47B |
|
||
| Utilities | 2 | $33B |
|
||
Price history
+618.5% since first listed8 events — show timeline
- 2026-06-17 Listed $115,000 FAOR
- 2023-09-11 Price Changed $90,000 FAOR
- 2022-03-07 Listing Removed — MLSNOW
- 2022-03-07 Listing Removed — CBRMLS
- 2021-12-06 Sold (Public Records) $7,454,700 Public Records
- 2021-10-22 Listed $137,500 MLSNOW
- 2021-10-22 Listed $137,500 CBRMLS
- 1996-05-15 Sold (Public Records) $16,005 Public Records
Property tax history
+4.0%/yrLatest (2025): $1,492 · -29.8% YoY. Source: county tax records.
Cash-flow waterfall
monthlySold comps — $/sqft
last 12 mo · ≤1 miLoading sold comps…