 🏷️ Likely Rental
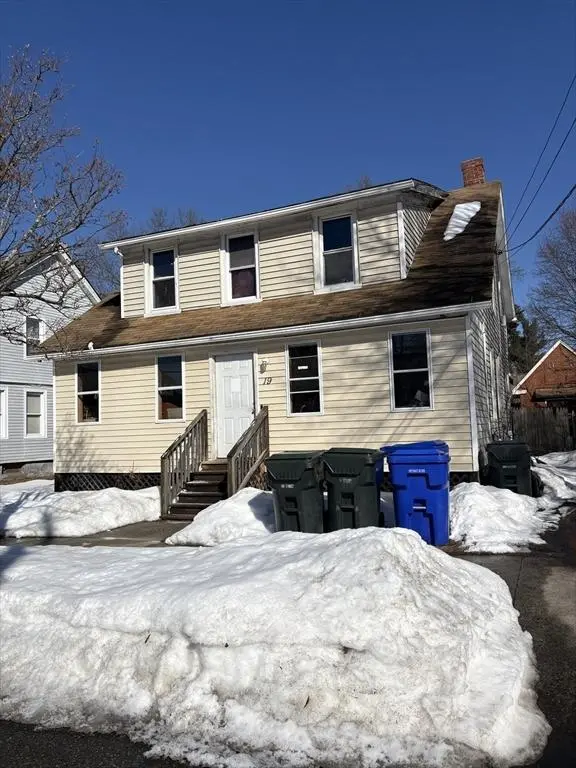
19 Wilton St · Springfield, MA
Flood risk No data
- FEMA flood zone
- —
- Chance of flooding over 30 yrs
- —
- Est. flood insurance / yr
- —
Fire risk No data
- Est. fire insurance / yr
- —
Heat risk No data
- Hot days now (above threshold)
- —
- Hot days in 30 yrs
- —
Wind risk No data
- Chance of severe wind over 30 yrs
- —
Air-quality risk No data
- Unhealthy air days now
- —
- Unhealthy air days in 30 yrs
- —
Risk factors via First Street. Map © Google.
Why this score? — see what drove the B- grade
The composite is a weighted blend of 9 inputs, each scored 0–100. Each bar is that input's sub-score; the figure is the points it added to the 100-point composite (weight × sub-score).
- Cash flow +26.2/30.0
- ARV discount +15.0/15.0
- DSCR +8.8/10.0
- 1% rule +6.7/10.0
- Livability +3.7/5.0
- Rent growth +2.5/5.0
- Condition / age +2.5/5.0
- Schools +1.6/10.0
- Appreciation +0.0/10.0
$219,900
🖨 Deal sheet (PDF) 📄 Offer letter ✓ Due diligence
Listing remarks MLS
Investor opportunity! This 4-bedroom, 1-bath Cape-style home offers great potential for renovation and value-add. Property requires a full rehab inside and is being sold as-is with a Tenant; Sight unseen with no access. Conveniently located near local amenities and commuter routes. Ideal for investors, contractors, or flippers looking for their next project. Bring your vision and restore this home to its full potential!
Key facts
- 6,551 sq ft lot
- 2 parking spots
- Built 1915
Neighborhood map
What this means for you Summary
Snapshot
- This is a 4-bed/1.0-bath single-family listed at $220k.
Deal economics
- At list price, monthly cash flow is $559 ($7k/yr) — positive.
- The deal already cash-flows at list — no discount required.
- Meets the 1% rule at list price ($3k rent vs $220k).
- Recommended offer: $200k (9.0% below list) — sets the bar for market timing.
- Cap rate 9.3% vs local median 5.0% in Springfield — top-decile yield for the area; either an underpriced asset or a hidden risk that comps aren't pricing in. Stress-test before assuming the spread holds.
Location & tenants
- Location reads 73/100 on livability (#97 in MA) — a middle-class / working-renter tenant base. Strengths: commute A+, health & safety A+, amenities A; Watch: crime F, employment D-.
- Springfield (urban): math 13% / reading 25% proficiency, ranked #296 of 302 in MA (top 98%) — low school quality limits family demand, transient renter base, plan for 1-2y turnover; 81% free/reduced lunch — lower-income household profile, screen leases tightly.
- Zoned schools: Alfred G. Zanetti Montessori Magnet School (math 33% / reading 60%, grade D-, #405 of 938 statewide, top 44%, 434 students, 0% FRL); Stem Middle Academy (math 14% / reading 23%, grade F, #263 of 305 statewide, top 86%, 297 students, 0% FRL); Springfield Central High (math 27% / reading 41%, grade F, #250 of 343 statewide, top 73%, 2,095 students, 0% FRL) — zoned schools average 0% FRL vs 81% district-wide (81 pts lower); this property's tenant base skews higher-income than the district average.
- Zoned-school proficiency averages 33% at this address vs 19% district-wide (+14 pts) — the actual schools serving this property are materially stronger than the Springfield average implies; a family-tenant draw the district grade alone would hide.
- Market conditions: 38 active listings in the ZIP; 3 comparable units currently listed for rent nearby; rentals lingering (median 46d on market — plan ~5-8 weeks vacancy on turnover, expect pricing pressure); 100% of comp listings sitting > 30 days — soft ceiling on asking rent; 453 units permitted in Hampden County in 2024 (116 in 5+ unit buildings).
- At $2,562/mo this rent would consume 64% of the median local household income ($48k/yr) (locally 1322% of renters already pay >50% of income on rent) — very limited rent-growth headroom before tenants either downsize or default.
Forward outlook
- Local home prices are declining (-3.0%/yr); year-one equity from $2k of loan paydown is wiped out by about $7k of value loss. Plan a longer hold.
- Hampden County population projected at +5% by 2050 — modest demand growth; plan on rents tracking national, not racing it.
- At projected returns (-3.0% appreciation + 3.0% rent growth), your $62k cash investment doubles in ~10 years — after that, you're playing with house money.
Negotiation context
- It's been on market 107 days — a 9% lower offer ($200k) is reasonable based on typical stale-listing flexibility.
- Current owner paid $34k; list at $220k implies a 556% gain — meaningful room to come down on a strong offer.
Risks & watch-outs
- Watch-outs: built in 1915 — expect roof / HVAC / electrical / plumbing capex.
Questions for the listing agent
- It's been on market 107 days. Have you received any prior offers? Is the seller open to a 9% concession, seller financing, or rate buy-down credit?
- Built in 1915 — when were the roof, HVAC, electrical panel, plumbing, and water heater last replaced?
- Why hasn't it sold? Are there any deal-killer items the seller is aware of (foundation, flood, title, zoning, code violations)?
- Is there a deadline driving the sale (1031 exchange, divorce, estate, relocation)? That informs how much negotiation room exists.
- Schools are D-rated, which usually means shorter tenancies and higher turnover. Who's the typical renter profile here, and what's been the actual vacancy rate?
- Crime grade is F in this area — have there been break-ins, vandalism, or insurance claims at this property in the last 3 years? What carrier currently insures it and at what premium?
- What's the average days-on-market for RENTAL listings here right now (not sales)? A rising rental-DOM trend means longer vacancies and softer asking-rent achievability than the comps imply.
- What's the recent tenant-quality profile in this submarket — average credit score on applications, eviction rate, late-payment / NSF rate, and stable-employment percentage? A property-management company in the area should have these aggregated.
- How much new for-sale + rental construction is in the pipeline within 1–3 miles? Heavy new supply typically softens prices + rents 12–24 months out; constrained supply supports both.
Investment metrics
- 1% rule
- 1.17% ✓
- Cap rate
- 9.34%
- Cash-on-cash
- 10.89%
- DSCR
- 1.48
- GRM
- 7.2
CMA / ARV
- ARV (median comp)
- $296,054
- List price
- $219,900
- Delta
- -25.72%
- Verdict
- UNDERPRICED
- Comps
- 20 within 1.0 mi
Show comp detail 12 sales within ~0.75 mi
| Address | Dist | Beds/Ba | Sqft | Sold | Price | $/sf | Match |
|---|---|---|---|---|---|---|---|
| 77 Coleman St | 0.28mi | 4/1.0 | 1,728 (+4%) | 4mo | $300,000 | $174 | 77 |
| 99 Massreco St | 0.28mi | 4/2.0 | 1,605 (-3%) | 5mo | $325,000 | $202 | 73 |
| 25 Pheland St | 0.13mi | 5/1.5 (+1) | 1,540 (-7%) | 4mo | $322,500 | $209 | 71 |
| 162 Gilbert Ave | 0.38mi | 4/2.0 | 1,688 (+2%) | 9mo | $450,000 | $267 | 68 |
| 239 Gresham St | 0.35mi | 4/2.0 | 1,784 (+7%) | 2mo | $435,000 | $244 | 66 |
| 82 Waldorf St | 0.50mi | 3/1.5 (-1) | 1,651 (-1%) | 6mo | $275,000 | $167 | 64 |
| 322 Gilbert Ave | 0.39mi | 4/2.0 | 1,796 (+8%) | 2mo | $441,000 | $246 | 63 |
| 18 Riverton Rd | 0.63mi | 3/1.5 (-1) | 1,660 (-0%) | 3mo | $375,000 | $226 | 61 |
| 285 Breckwood Blvd | 0.41mi | 4/2.0 | 1,440 (-13%) | 1mo | $350,000 | $243 | 54 |
| 16 Stuart St | 0.57mi | 3/1.0 (-1) | 1,542 (-7%) | 9mo | $319,900 | $207 | 49 |
| 7 Jennings St | 0.67mi | 3/2.0 (-1) | 1,600 (-4%) | 9mo | $430,000 | $269 | 46 |
| 114 Riverton Rd | 0.58mi | 3/2.5 (-1) | 1,526 (-8%) | 4mo | $390,000 | $256 | 45 |
Match score weights: distance 35% · size 25% · config 20% · recency 20%. Top-matched comps best support the ARV.
Projected returns pro-forma
-3.0% appreciation · 3.0% rent growth · sell at horizon
- IRR
- -0.0%
- Equity multiple
- 1.00×
- Total profit
- $-52
- Equity at exit
- $32,788
- IRR
- 9.6%
- Equity multiple
- 1.74×
- Total profit
- $45,787
- Equity at exit
- $19,013
Cash invested: $61,572 (down + closing). Projections, not guarantees.
Landlord ↔ Tenant lean methodology
- Overall (STATE)
- 20 Strongly Tenant-Friendly
- State Massachusetts
- 20 Strongly Tenant-Friendly · D+15
- County
- — inherits STATE
- City
- — inherits STATE
ZIP-level market 01109
- Home prices YoY
- -22.8%
- Active inventory
- 38
- Price-to-rent
- 7.2×
Monthly cashflow live
- Estimated rent
- $2,562 medium interval (Pro) →
- Mortgage (P&I)
- −$1,153
- Tax from tax record
- −$221 /mo · $2,651/yr
- Insurance
- −$92
- HOA
- −$0
- Vacancy / Maint / Mgmt
- −$538
- Net cashflow
- $559
Break-even live
Sensitivity live
| Price | -10% $683 | -5% $621 | +0% $559 | +5% $496 | +10% $434 |
|---|---|---|---|---|---|
| Rent | -10% $356 | -5% $457 | +0% $559 | +5% $660 | +10% $761 |
| Rate | -1.0pp $669 | -0.5pp $615 | base $559 | +0.5pp $502 | +1.0pp $444 |
UW: 25.0% down · 7.5% · 30yr · 1.5% tax · 5.0% vac · 8.0% maint · 8.0% mgmt
Financing live
Cash to close
- Down payment
- $54,975
- Closing costs
- $6,597
- Reserves months
- —
- Total cash needed
- —
Loan-product check · same deal, 3 products live
Conventional
25% down · 7.5% · 30yr
- Down + closing
- —
- Monthly P&I
- —
- Monthly cashflow
- —
- DSCR
- —
- Eligible?
- —
Personal DTI + credit; lowest rate.
DSCR
20% down · 8.5% · 30yr
- Down + closing
- —
- Monthly P&I
- —
- Monthly cashflow
- —
- DSCR
- —
- Eligible?
- —
No personal income docs; deal must DSCR.
Hard money
10% down · 12.0% · 12mo
- Down + closing
- —
- Monthly P&I
- —
- Monthly cashflow
- —
- DSCR
- —
- Eligible?
- —
Short-term bridge; refi at stabilization.
Rent comps 3 comps
| Address | Beds | Baths | Sqft | Rent | $/sqft | DOM | Units | Dist |
|---|---|---|---|---|---|---|---|---|
| 63 Granger St Springfield, MA | 4.0 | 2.0 | 1200 | $2,700 | $2.25 | 45d | 1 | 1.05mi |
| 137 Cobb St Springfield, MA | 4.0 | 2.0 | 1500 | $2,500 | $1.67 | 45d | 1 | 1.11mi |
| 37 Cortland St Unit 1 Springfield, MA | 3.0 | 1.0 | 1210 | $2,250 | $1.86 | 45d | 1 | 1.42mi |
Listing history 19 events
-
2026-06-22days on market $219,900 Active 107 DOM
-
2026-06-18days on market $219,900 Active 104 DOM
-
2026-06-17days on market $219,900 Active 103 DOM
-
2026-06-16days on market $219,900 Active 102 DOM
-
2026-06-15days on market $219,900 Active 101 DOM
-
2026-06-14days on market $219,900 Active 99 DOM
-
2026-06-13days on market $219,900 Active 98 DOM
-
2026-06-10days on market $219,900 Active 96 DOM
-
2026-06-09days on market $219,900 Active 95 DOM
-
2026-06-08days on market $219,900 Active 94 DOM
-
2026-06-07days on market $219,900 Active 93 DOM
-
2026-06-05days on market $219,900 Active 90 DOM
-
2026-06-03days on market $219,900 Active 89 DOM
-
2026-06-02days on market $219,900 Active 88 DOM
-
2026-06-01days on market $219,900 Active 87 DOM
-
2026-05-31days on market $219,900 Active 86 DOM
-
2026-05-30days on market $219,900 Active 85 DOM
-
2026-03-06$219,900 New 423-char remark
Show marketing remark (423 chars)
Investor opportunity! This 4-bedroom, 1-bath Cape-style home offers great potential for renovation and value-add. Property requires a full rehab inside and is being sold as-is with a Tenant; Sight unseen with no access. Conveniently located near local amenities and commuter routes. Ideal for investors, contractors, or flippers looking for their next project. Bring your vision and restore this home to its full potential!
-
1984-08-20soldstatus $33,500
ⓘ Source: listings_history table (triggers on properties + properties_extension) + one-shot
backfill from property_details.listing_events for pre-trigger history.
Tax reassessment forecast MA · Partial reset (capped growth)
- Current annual tax
- $2,651 · $221/mo
- Projected year-2 tax
- $2,678 · $223/mo
- Expected delta
- +$27/yr (+$2/mo · 1.0%)
ⓘ Screening estimate from a state-policy table — verify with the county assessor before closing.
Nearby sold comps map
Loading sold comps map…
Walkable amenities ~0.75 mi
Loading nearby amenities…
Taxation est. · year 1
- Rental income
- $30,749
- − Mortgage interest
- −$12,318
- − Property taxes
- −$2,651
- − Insurance
- −$1,100
- − Repairs & maintenance
- −$2,460
- − Management
- −$2,460
- − Depreciation
- −$6,397
- Taxable income
- $3,364
- Est. tax owed @ 24.0%
- −$807
- After-tax cash flow
- $5,896/yr
For passive investors: Depreciation is non-cash, so a rental often shows a tax loss while cash-flowing — sheltering income. Rental losses are passive: they offset passive income freely, and up to $25,000/yr can offset ordinary (W-2) income if you actively participate and your MAGI is under $100k (phasing out to $0 by $150k); unused losses carry forward. On sale, claimed depreciation is recaptured at up to 25%, and gains may owe capital-gains tax (a 1031 exchange can defer both). Figures are a year-1 estimate at your 24.0% rate — not tax advice; consult a CPA.
Schools (NCES district)
- District
- Springfield
- NCES district ID
- 2511130
- Math proficiency
- 13% ▼ -12.00%
- Reading proficiency
- 25% ▼ -5.00%
- Median HH income
- $34,938
- Composite
- 15.6/100
- National rank
- #9293
- State rank
- #296 of 302 in MA
Livability — Springfield
- Score
- 73/100
- State rank
- #97
- US rank
- #5195
Category grades
Schools grade is shown separately in the Schools card above.
Census & demographics
- Census place
- Springfield, MA
- County
- Hampden County · 230,965 people
- City population
- 61,006
- Metro
- Springfield, MA
- Population (ZIP)
- 31,124
- Household income
- $48,415
- Rent vs Own
- Severe rent burden
- 1322.0
Population outlook (Hampden County) Hauer SSP2
- Today (2025)
- 485,646 people
- By 2030
- 491,517 · +1.2%
- By 2040
- 500,539 · +3.1%
- By 2050
- 508,827 · +4.8%
- By 2075
- 539,167 · +11.0%
- By 2100
- 545,698 · +12.4%
Race, ethnicity, and origin ACS 2023
- Neighborhood character
- Diverse neighborhood (Simpson 0.67)
- Race & ethnicity
- Hispanic / Latino 45% Black 31% Two or more races 20% White 18% Asian 1% Native American 1%
- Hispanic origin (detail)
- Puerto Rican 39% Dominican 3%
- Common ancestry
- Lithuanian 2% Romanian 1%
- Foreign-born
- 9% · Canada, China
- Languages at home
- 65% English-only · Spanish 32% Other Asian/Pacific 1% Russian/Polish/Slavic 1%
Political lean MEDSL · Hampden
- 2024 margin
- Lean D (+8.9) · D 53.4% · R 44.5% · Other 2.1%
- 2008→2024 swing
- -16.4pp toward R · 2008: 25.3pp · 2024: 8.9pp
- All cycles
- 2024: D+8.9 2020: D+17.7 2016: D+16.0 2012: D+25.4 2008: D+25.3
Not yet ingested
- Civics
- —
Market trends
- HPI YoY
- ▼ -113.11%
- Current HPI
- 382.9038
- Rent YoY
- —
- Metro
- Springfield, MA
- State GDP YoY
- ▲ 2.28%
- F500 in state
- 38
Industry mix (Fortune 500 HQ in MA)
| Industry | F500 HQs | Revenue |
|---|---|---|
| Technology | 3 | $17B |
|
||
| Insurance | 2 | $84B |
|
||
| Retail | 2 | $76B |
|
||
| Life Sciences | 1 | $43B |
|
||
| Energy Technology | 1 | $31B |
|
||
| Aerospace / Defense | 1 | $18B |
|
||
Price history
+556.4% since first listed2 events — show timeline
- 2026-03-06 Listed $219,900 MLS PIN
- 1984-08-20 Sold (Public Records) $33,500 Public Records
Property tax history
+2.4%/yrLatest (2023): $2,651 · +0.3% YoY. Source: county tax records.
Cash-flow waterfall
monthlySold comps — $/sqft
last 12 mo · ≤1 miLoading sold comps…