3535 State Route 2837 · Wheatcroft, KY
Flood risk 1/10 · Minimal
- FEMA flood zone
- X (unshaded)
- Chance of flooding over 30 yrs
- 0.0%
- Est. flood insurance / yr
- $507 – $1,088
Fire risk 4/10 · Minor
- Est. fire insurance / yr
- $839 – $1,559
Heat risk 4/10 · Minor
- Hot days now (above 109°F)
- 7 days/yr
- Hot days in 30 yrs
- 19 days/yr
Wind risk 2/10 · Minimal
- Chance of severe wind over 30 yrs
- 4.0%
Air-quality risk 2/10 · Minimal
- Unhealthy air days now
- 0 days/yr
- Unhealthy air days in 30 yrs
- 1 days/yr
Risk factors via First Street. Map © Google.
Why this score? — see what drove the D+ grade
The composite is a weighted blend of 9 inputs, each scored 0–100. Each bar is that input's sub-score; the figure is the points it added to the 100-point composite (weight × sub-score).
- Cash flow +14.6/30.0
- Appreciation +10.0/10.0
- ARV discount +7.5/15.0
- DSCR +4.5/10.0
- Livability +2.9/5.0
- 1% rule +2.7/10.0
- Rent growth +2.5/5.0
- Schools +2.5/10.0
- Condition / age +2.5/5.0
$140,000
🖨 Deal sheet (PDF) 📄 Offer letter ✓ Due diligence
Listing remarks
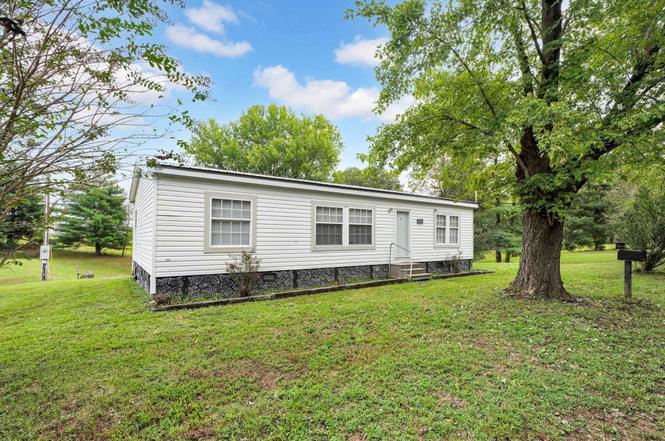
Welcome to this 3-bedroom, 2-bath home sitting on 2.21 acres of peaceful country setting. Inside, you’ll find an open-concept layout with a spacious living room and kitchen, perfect for gathering with family and friends. The large master suite provides a comfortable retreat at the end of the day. Step out back to a covered porch where you can relax and take in the view of your own stocked pond. This property offers both comfort and charm in a beautiful rural setting.
Key facts
- Covered porch
- Stocked pond
- Open-concept layout
Tags
Neighborhood map
What this means for you Summary
Snapshot
- This is a 3-bed/2.0-bath other listed at $140k.
Deal economics
- At list price, monthly cash flow is $34 ($406/yr) — positive.
- The deal already cash-flows at list — no discount required.
- To meet the 1% rule (rent ≥ 1% of price), the offer needs to be $108k (22.5% below list).
- Recommended offer: $108k (22.5% below list) — sets the bar for 1% rule.
Location & tenants
- Location reads 58/100 on livability (#436 in KY) — a working-class tenant base; expect higher turnover. Strengths: cost of living A+, housing A+; Watch: crime C-, employment D, amenities F.
- Webster County (rural): math 25% / reading 34% proficiency, ranked #114 of 165 in KY (top 69%) — low school quality limits family demand, transient renter base, plan for 1-2y turnover.
- Zoned schools: Clay Elementary School (math 37% / reading 42%, grade F, #208 of 676 statewide, top 34%, 194 students, 65% FRL); Webster County Middle School (math 22% / reading 36%, grade F, #156 of 217 statewide, top 74%, 315 students, 66% FRL); Webster County High School (math 22% / reading 27%, grade F, #179 of 254 statewide, top 78%, 676 students, 61% FRL).
- Market conditions: 19 active listings in the ZIP; 6 units permitted in Webster County in 2024 (0 in 5+ unit buildings).
Forward outlook
- In year one you build about $15k of equity ($968 loan paydown + $14k appreciation (10.0% local appreciation)).
- Webster County population projected at -14% by 2050 — secular population decline; favor cash flow + early exit over multi-decade hold.
- At projected returns (10.0% appreciation + 3.0% rent growth), your $39k cash investment doubles in ~3 years — after that, you're playing with house money.
- By year 3, paydown + projected appreciation supports a ~$38k cash-out refi (75% LTV) — recoverable capital for the next deal without selling this one.
Negotiation context
- Only 9 days on market — expect competitive offers; lowballing is unlikely to land.
- Current owner paid $20k; list at $140k implies a 618% gain — meaningful room to come down on a strong offer.
Questions for the listing agent
- Is there a deadline driving the sale (1031 exchange, divorce, estate, relocation)? That informs how much negotiation room exists.
- Schools are F-rated, which usually means shorter tenancies and higher turnover. Who's the typical renter profile here, and what's been the actual vacancy rate?
- The area grade is low — what's the realistic commute time and amenity access for the typical tenant pool here? Any planned neighborhood developments (good or bad) we should know about?
- What's the average days-on-market for RENTAL listings here right now (not sales)? A rising rental-DOM trend means longer vacancies and softer asking-rent achievability than the comps imply.
- What's the recent tenant-quality profile in this submarket — average credit score on applications, eviction rate, late-payment / NSF rate, and stable-employment percentage? A property-management company in the area should have these aggregated.
- How much new for-sale + rental construction is in the pipeline within 1–3 miles? Heavy new supply typically softens prices + rents 12–24 months out; constrained supply supports both.
Investment metrics
- 1% rule
- 0.77% ✗
- Cap rate
- 6.58%
- Cash-on-cash
- 1.04%
- DSCR
- 1.05
- GRM
- 10.8
CMA / ARV
No comps found within radius.
Projected returns pro-forma
10.0% appreciation · 3.0% rent growth · sell at horizon
- IRR
- 25.0%
- Equity multiple
- 3.00×
- Total profit
- $78,332
- Equity at exit
- $126,123
- IRR
- 22.0%
- Equity multiple
- 6.84×
- Total profit
- $228,836
- Equity at exit
- $271,989
Cash invested: $39,200 (down + closing). Projections, not guarantees.
Landlord ↔ Tenant lean methodology
- Overall (STATE)
- 83 Strongly Landlord-Friendly
- State Kentucky
- 83 Strongly Landlord-Friendly · R+16
- County
- — inherits STATE
- City
- — inherits STATE
ZIP-level market 42404
- Home prices YoY
- 5.2%
- Active inventory
- 19
- Price-to-rent
- 10.8×
Monthly cashflow live
- Estimated rent
- $1,085 medium interval (Pro) →
- Mortgage (P&I)
- −$734
- Tax from tax record
- −$31 /mo · $367/yr
- Insurance
- −$58
- HOA
- −$0
- Vacancy / Maint / Mgmt
- −$228
- Net cashflow
- $34
Break-even live
Sensitivity live
| Price | -10% $113 | -5% $73 | +0% $34 | +5% $-6 | +10% $-45 |
|---|---|---|---|---|---|
| Rent | -10% $-52 | -5% $-9 | +0% $34 | +5% $77 | +10% $120 |
| Rate | -1.0pp $104 | -0.5pp $69 | base $34 | +0.5pp $-2 | +1.0pp $-39 |
UW: 25.0% down · 7.5% · 30yr · 1.5% tax · 5.0% vac · 8.0% maint · 8.0% mgmt
Financing live
Cash to close
- Down payment
- $35,000
- Closing costs
- $4,200
- Reserves months
- —
- Total cash needed
- —
Loan-product check · same deal, 3 products live
Conventional
25% down · 7.5% · 30yr
- Down + closing
- —
- Monthly P&I
- —
- Monthly cashflow
- —
- DSCR
- —
- Eligible?
- —
Personal DTI + credit; lowest rate.
DSCR
20% down · 8.5% · 30yr
- Down + closing
- —
- Monthly P&I
- —
- Monthly cashflow
- —
- DSCR
- —
- Eligible?
- —
No personal income docs; deal must DSCR.
Hard money
10% down · 12.0% · 12mo
- Down + closing
- —
- Monthly P&I
- —
- Monthly cashflow
- —
- DSCR
- —
- Eligible?
- —
Short-term bridge; refi at stabilization.
Listing history 3 events
-
2025-10-10status Pending
-
2025-10-01$140,000 Active
-
1992-12-01soldstatus $19,500
ⓘ Source: listings_history table (triggers on properties + properties_extension) + one-shot
backfill from property_details.listing_events for pre-trigger history.
Tax reassessment forecast KY · Resets to sale price
- Current annual tax
- $367 · $31/mo
- Projected year-2 tax
- $1,204 · $100/mo
- Expected delta
- +$837/yr (+$70/mo · 228.2%)
ⓘ Screening estimate from a state-policy table — verify with the county assessor before closing.
Climate risk First Street
- Flood 1/10 Low FEMA zone X (unshaded) · 0% chance over 30 yrs
- Wildfire 4/10 Moderate
- Heat 4/10 Moderate 7 d/yr ≥109°F today · 19 d/yr by 30 yrs out
- Wind 2/10 Low 4% chance of damaging wind over 30 yrs
- Air quality 2/10 Low 0 unhealthy d/yr today · 1 by 30 yrs out
Nearby sold comps map
Loading sold comps map…
Walkable amenities ~0.75 mi
Loading nearby amenities…
Taxation est. · year 1
- Rental income
- $13,017
- − Mortgage interest
- −$7,842
- − Property taxes
- −$367
- − Insurance
- −$700
- − Repairs & maintenance
- −$1,041
- − Management
- −$1,041
- − Depreciation
- −$4,073
- Taxable loss
- −$2,048
- Est. tax savings @ 24.0%
- +$491
- After-tax cash flow
- $898/yr
For passive investors: Depreciation is non-cash, so a rental often shows a tax loss while cash-flowing — sheltering income. Rental losses are passive: they offset passive income freely, and up to $25,000/yr can offset ordinary (W-2) income if you actively participate and your MAGI is under $100k (phasing out to $0 by $150k); unused losses carry forward. On sale, claimed depreciation is recaptured at up to 25%, and gains may owe capital-gains tax (a 1031 exchange can defer both). Figures are a year-1 estimate at your 24.0% rate — not tax advice; consult a CPA.
Schools (NCES district)
- District
- Webster County
- NCES district ID
- 2105820
- Math proficiency
- 25% ▼ -17.00%
- Reading proficiency
- 34% ▼ -16.00%
- Median HH income
- $39,542
- Composite
- 24.76/100
- National rank
- #7600
- State rank
- #114 of 165 in KY
Livability — Wheatcroft
- Score
- 58/100
- State rank
- #436
- US rank
- #21517
Category grades
Schools grade is shown separately in the Schools card above.
Census & demographics
- Population (ZIP)
- 2,268
Population outlook (Webster County) Hauer SSP2
- Today (2025)
- 12,548 people
- By 2030
- 12,119 · -3.4%
- By 2040
- 11,345 · -9.6%
- By 2050
- 10,761 · -14.2%
- By 2075
- 10,166 · -19.0%
- By 2100
- 10,546 · -16.0%
Race, ethnicity, and origin ACS 2023
- Neighborhood character
- Predominantly White (94%)
- Race & ethnicity
- White 94% Hispanic / Latino 5% Pacific Islander 1%
- Common ancestry
- Italian 7% Lithuanian 1% Slovak 1%
- Foreign-born
- 1% · Canada
- Languages at home
- 96% English-only · Spanish 4%
Political lean MEDSL · Webster
- 2024 margin
- Solid R (+57.4) · D 20.8% · R 78.1% · Other 1.1%
- 2008→2024 swing
- -45.7pp toward R · 2008: -11.7pp · 2024: -57.4pp
- All cycles
- 2024: R+57.4 2020: R+51.6 2016: R+54.4 2012: R+33.7 2008: R+11.7
Not yet ingested
- Civics
- —
Market trends
- HPI YoY
- ▲ 11.08%
- Current HPI
- 223.0427
- Rent YoY
- —
- Metro
- —
- State GDP YoY
- ▲ 1.81%
- F500 in state
- 4
Industry mix (Fortune 500 HQ in KY)
| Industry | F500 HQs | Revenue |
|---|---|---|
| Healthcare | 1 | $118B |
|
||
| Food / Beverage | 1 | $7B |
|
||
Price history
+617.9% since first listed3 events — show timeline
- 2025-10-10 Pending — HABOR
- 2025-10-01 Listed $140,000 HABOR
- 1992-12-01 Sold (Public Records) $19,500 Public Records
Property tax history
-2.4%/yrLatest (2025): $367 · +242.4% YoY. Source: county tax records.
Cash-flow waterfall
monthlySold comps — $/sqft
last 12 mo · ≤1 miLoading sold comps…