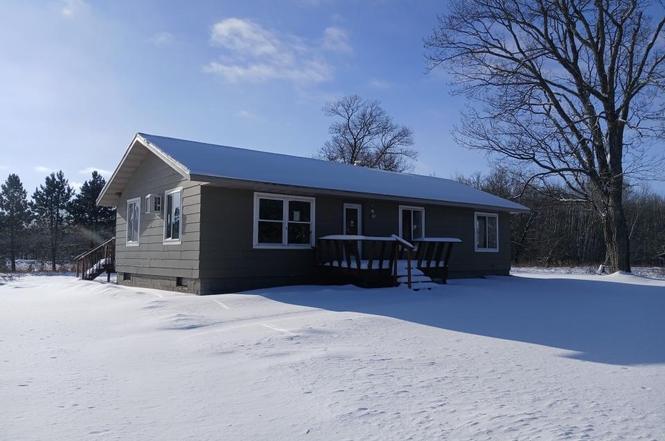
23201 Grouse St · Palisade, MN
Flood risk 1/10 · Minimal
- FEMA flood zone
- —
- Chance of flooding over 30 yrs
- 0.0%
- Est. flood insurance / yr
- —
Fire risk 3/10 · Minor
- Est. fire insurance / yr
- $888 – $1,650
Heat risk 1/10 · Minimal
- Hot days now (above 94°F)
- 7 days/yr
- Hot days in 30 yrs
- 12 days/yr
Wind risk 1/10 · Minimal
- Chance of severe wind over 30 yrs
- —
Air-quality risk 1/10 · Minimal
- Unhealthy air days now
- 0 days/yr
- Unhealthy air days in 30 yrs
- 0 days/yr
Risk factors via First Street. Map © Google.
Why this score? — see what drove the C- grade
The composite is a weighted blend of 9 inputs, each scored 0–100. Each bar is that input's sub-score; the figure is the points it added to the 100-point composite (weight × sub-score).
- Cash flow +14.7/30.0
- Appreciation +10.0/10.0
- ARV discount +7.5/15.0
- DSCR +4.5/10.0
- Livability +3.2/5.0
- Schools +3.1/10.0
- 1% rule +3.0/10.0
- Rent growth +2.5/5.0
- Condition / age +2.5/5.0
$135,500
🖨 Deal sheet 📄 Offer letter ✓ Due diligence
Listing remarks
Great location close to everything McGregor has to offer. Open floor plan with 3 bedrooms on the main level. Over 2.5 acres with room for a garden and a finished garage for all your tools.
Key facts
- Open floor plan
- Room for a garden
- Finished garage
Tags
Property features AI
Finance
- Financial info: Annual taxes reported: $710 (2025)
Exterior
- Parking: Detached or attached 2-car garage (24 x 20, 7' door height)
- Utilities: Private water; Private sewer; Propane fuel
- Home design: Residential property; One level
- Construction: Block foundation; Foundation dimensions approximately 48 x 24; Building area total includes finished above- and below-grade space
- Exterior features: Lot about 2.6 acres; Lot dimensions approximately 360 x 315
Interior
- Bedrooms: 3 bedrooms
- Bathrooms: 1 full bathroom; 1 quarter bathroom
- Heating & cooling: Forced air heating; No central air
- Interior features: Full basement with block construction
Neighborhood map
What this means for you Summary
Snapshot
- This is a 3-bed/2.0-bath other listed at $136k.
Deal economics
- At list price, monthly cash flow is $34 ($414/yr) — positive.
- The deal already cash-flows at list — no discount required.
- To meet the 1% rule (rent ≥ 1% of price), the offer needs to be $109k (19.5% below list).
- Recommended offer: $109k (19.5% below list) — sets the bar for 1% rule.
Location & tenants
- Location reads 64/100 on livability (#591 in MN) — a middle-class / working-renter tenant base. Strengths: cost of living A+, health & safety A+; Watch: schools D+, crime D, amenities F.
- Mcgregor Public School District (rural): math 31% / reading 44% proficiency, ranked #243 of 301 in MN (top 81%) — families likely to look elsewhere, expect single-tenant / working-renter base with shorter leases; 60% free/reduced lunch — lower-income household profile, screen leases tightly.
- Market conditions: 87 active listings in the ZIP; 134 units permitted in Aitkin County in 2024 (0 in 5+ unit buildings).
Forward outlook
- In year one you build about $14k of equity ($937 loan paydown + $14k appreciation (10.0% local appreciation)).
- Aitkin County population projected at -25% by 2050 — secular population decline; favor cash flow + early exit over multi-decade hold.
- At projected returns (10.0% appreciation + 3.0% rent growth), your $38k cash investment doubles in ~3 years — after that, you're playing with house money.
- By year 3, paydown + projected appreciation supports a ~$37k cash-out refi (75% LTV) — recoverable capital for the next deal without selling this one.
Negotiation context
- It's been on market 104 days — a 9% lower offer ($123k) is reasonable based on typical stale-listing flexibility.
- 5 sale attempts since 16y ago; this cycle's ask has dropped $68k (34%) from the opening price — seller is motivated, your offer sets the floor, not the list.
Questions for the listing agent
- It's been on market 104 days. Have you received any prior offers? Is the seller open to a 20% concession, seller financing, or rate buy-down credit?
- Built in 1974 — when were the roof, HVAC, electrical panel, plumbing, and water heater last replaced?
- Why hasn't it sold? Are there any deal-killer items the seller is aware of (foundation, flood, title, zoning, code violations)?
- Is there a deadline driving the sale (1031 exchange, divorce, estate, relocation)? That informs how much negotiation room exists.
- Schools are D-rated, which usually means shorter tenancies and higher turnover. Who's the typical renter profile here, and what's been the actual vacancy rate?
- Crime grade is D in this area — have there been break-ins, vandalism, or insurance claims at this property in the last 3 years? What carrier currently insures it and at what premium?
- What's the average days-on-market for RENTAL listings here right now (not sales)? A rising rental-DOM trend means longer vacancies and softer asking-rent achievability than the comps imply.
- What's the recent tenant-quality profile in this submarket — average credit score on applications, eviction rate, late-payment / NSF rate, and stable-employment percentage? A property-management company in the area should have these aggregated.
- How much new for-sale + rental construction is in the pipeline within 1–3 miles? Heavy new supply typically softens prices + rents 12–24 months out; constrained supply supports both.
Investment metrics
- 1% rule
- 0.80% ✗
- Cap rate
- 6.60%
- Cash-on-cash
- 1.09%
- DSCR
- 1.05
- GRM
- 10.4
CMA / ARV
No comps found within radius.
Projected returns pro-forma
10.0% appreciation · 3.0% rent growth · sell at horizon
- IRR
- 25.0%
- Equity multiple
- 3.00×
- Total profit
- $75,942
- Equity at exit
- $122,069
- IRR
- 22.1%
- Equity multiple
- 6.85×
- Total profit
- $221,810
- Equity at exit
- $263,247
Cash invested: $37,940 (down + closing). Projections, not guarantees.
Landlord ↔ Tenant lean methodology
- Overall (STATE)
- 46 Balanced
- State Minnesota
- 46 Balanced · D+2
- County
- — inherits STATE
- City
- — inherits STATE
ZIP-level market 55760
- Home prices YoY
- 7.3%
- Active inventory
- 87
- Price-to-rent
- 10.4×
Monthly cashflow live
- Estimated rent
- $1,091 medium interval (Pro) →
- Mortgage (P&I)
- −$711
- Tax from tax record
- −$60 /mo · $720/yr
- Insurance
- −$56
- HOA
- −$0
- Vacancy / Maint / Mgmt
- −$229
- Net cashflow
- $34
Break-even live
UW: 25.0% down · 7.5% · 30yr · 1.5% tax · 5.0% vac · 8.0% maint · 8.0% mgmt
Financing live
Cash to close
- Down payment
- $33,875
- Closing costs
- $4,065
- Reserves months
- —
- Total cash needed
- —
Loan-product check · same deal, 3 products live
Conventional
25% down · 7.5% · 30yr
- Down + closing
- —
- Monthly P&I
- —
- Monthly cashflow
- —
- DSCR
- —
- Eligible?
- —
Personal DTI + credit; lowest rate.
DSCR
20% down · 8.5% · 30yr
- Down + closing
- —
- Monthly P&I
- —
- Monthly cashflow
- —
- DSCR
- —
- Eligible?
- —
No personal income docs; deal must DSCR.
Hard money
10% down · 12.0% · 12mo
- Down + closing
- —
- Monthly P&I
- —
- Monthly cashflow
- —
- DSCR
- —
- Eligible?
- —
Short-term bridge; refi at stabilization.
Listing history 25 events
-
2026-06-12statusdays on market $135,500 Pending 104 DOM
-
2026-06-09days on market $135,500 Contingent - Inspection 101 DOM
-
2026-06-08days on market $135,500 Contingent - Inspection 100 DOM
-
2026-06-07days on market $135,500 Contingent - Inspection 99 DOM
-
2026-06-05days on market $135,500 Contingent - Inspection 97 DOM
-
2026-06-04days on market $135,500 Contingent - Inspection 95 DOM
-
2026-06-02days on market $135,500 Contingent - Inspection 94 DOM
-
2026-06-01days on market $135,500 Contingent - Inspection 93 DOM
-
2026-05-31days on market $135,500 Contingent - Inspection 92 DOM
-
2026-05-31days on market $135,500 Contingent - Inspection 91 DOM
-
2026-04-30historical Contingent - Third Party Approval
-
2026-04-24price $135,500
-
2026-04-14price $163,200
-
2026-02-27$204,000 Active
-
2024-08-21historical
-
2024-05-01$148,000 Active
-
2020-03-22historical
-
2020-02-04$164,900 Active
-
2019-12-16historical
-
2019-12-07$164,900 Active
-
2017-03-24soldstatus $145,000
-
2011-02-17soldstatus $50,000
-
2011-02-07soldstatus $50,000
-
2011-01-20historical
-
2010-05-03$115,900
ⓘ Source: listings_history table (triggers on properties + properties_extension) + one-shot
backfill from property_details.listing_events for pre-trigger history.
Tax reassessment forecast MN · Partial reset (capped growth)
- Current annual tax
- $720 · $60/mo
- Projected year-2 tax
- $1,119 · $93/mo
- Expected delta
- +$399/yr (+$33/mo · 55.4%)
ⓘ Screening estimate from a state-policy table — verify with the county assessor before closing.
Climate risk First Street
- Flood 1/10 Low 0% chance over 30 yrs
- Wildfire 3/10 Moderate
- Heat 1/10 Low 7 d/yr ≥94°F today · 12 d/yr by 30 yrs out
- Wind 1/10 Low
- Air quality 1/10 Low 0 unhealthy d/yr today · 0 by 30 yrs out
Nearby sold comps map
Loading sold comps map…
Walkable amenities ~0.75 mi
Loading nearby amenities…
Taxation est. · year 1
- Rental income
- $13,086
- − Mortgage interest
- −$7,590
- − Property taxes
- −$720
- − Insurance
- −$678
- − Repairs & maintenance
- −$1,047
- − Management
- −$1,047
- − Depreciation
- −$3,942
- Taxable loss
- −$1,937
- Est. tax savings @ 24.0%
- +$465
- After-tax cash flow
- $879/yr
For passive investors: Depreciation is non-cash, so a rental often shows a tax loss while cash-flowing — sheltering income. Rental losses are passive: they offset passive income freely, and up to $25,000/yr can offset ordinary (W-2) income if you actively participate and your MAGI is under $100k (phasing out to $0 by $150k); unused losses carry forward. On sale, claimed depreciation is recaptured at up to 25%, and gains may owe capital-gains tax (a 1031 exchange can defer both). Figures are a year-1 estimate at your 24.0% rate — not tax advice; consult a CPA.
Schools (NCES district)
- District
- Mcgregor Public School District
- NCES district ID
- 2719170
- Math proficiency
- 31% ▼ -2.00%
- Reading proficiency
- 44% ▼ -5.00%
- Median HH income
- $39,225
- Composite
- 31.35/100
- National rank
- #5996
- State rank
- #243 of 301 in MN
Livability — Palisade
- Score
- 64/100
- State rank
- #591
- US rank
- #14117
Category grades
Schools grade is shown separately in the Schools card above.
Census & demographics
- Population (ZIP)
- 2,831
Population outlook (Aitkin County) Hauer SSP2
- Today (2025)
- 14,340 people
- By 2030
- 13,514 · -5.8%
- By 2040
- 11,928 · -16.8%
- By 2050
- 10,804 · -24.7%
- By 2075
- 9,555 · -33.4%
- By 2100
- 8,380 · -41.6%
Race, ethnicity, and origin ACS 2023
- Neighborhood character
- Predominantly White (90%)
- Race & ethnicity
- White 90% Native American 5% Two or more races 3% Hispanic / Latino 1% Black 1%
- Common ancestry
- Portuguese 15% Lithuanian 6% Scottish 2%
- Foreign-born
- 1%
- Languages at home
- 96% English-only · French/Haitian/Cajun 1%
Political lean MEDSL · Aitkin
- 2024 margin
- Solid R (+30.9) · D 33.8% · R 64.7% · Other 1.5%
- 2008→2024 swing
- -30.9pp toward R · 2008: 0.1pp · 2024: -30.9pp
- All cycles
- 2024: R+30.9 2020: R+26.4 2016: R+25.9 2012: R+1.3 2008: D+0.1
Not yet ingested
- Civics
- —
Market trends
- HPI YoY
- ▲ 15.76%
- Current HPI
- 231.677
- Rent YoY
- —
- Metro
- —
- State GDP YoY
- ▲ 2.41%
- F500 in state
- 34
Industry mix (Fortune 500 HQ in MN)
| Industry | F500 HQs | Revenue |
|---|---|---|
| Healthcare | 2 | $407B |
|
||
| Retail | 2 | $150B |
|
||
| Consumer Goods | 2 | $32B |
|
||
| Industrial Machinery | 2 | $6B |
|
||
| Agriculture | 1 | $40B |
|
||
| Healthcare / Medical Devices | 1 | $32B |
|
||
Price history
+16.9% since first listed15 events — show timeline
- 2026-04-30 Contingent — NORTHSTARMLS as Distributed by MLS Grid
- 2026-04-24 Price Changed $135,500 NORTHSTARMLS as Distributed by MLS Grid
- 2026-04-14 Price Changed $163,200 NORTHSTARMLS as Distributed by MLS Grid
- 2026-02-27 Listed $204,000 NORTHSTARMLS as Distributed by MLS Grid
- 2024-08-21 Listing Removed — NORTHSTARMLS as Distributed by MLS Grid
- 2024-05-01 Listed $148,000 NORTHSTARMLS as Distributed by MLS Grid
- 2020-03-22 Listing Removed — NORTHSTARMLS as Distributed by MLS Grid
- 2020-02-04 Listed $164,900 NORTHSTARMLS as Distributed by MLS Grid
- 2019-12-16 Listing Removed — NORTHSTARMLS as Distributed by MLS Grid
- 2019-12-07 Listed $164,900 NORTHSTARMLS as Distributed by MLS Grid
- 2017-03-24 Sold (Public Records) $145,000 Public Records
- 2011-02-17 Sold (Public Records) $50,000 Public Records
- 2011-02-07 Sold (MLS) $50,000 NORTHSTARMLS as Distributed by MLS Grid
- 2011-01-20 Listing Removed — NORTHSTARMLS as Distributed by MLS Grid
- 2010-05-03 Listed $115,900 NORTHSTARMLS as Distributed by MLS Grid
Property tax history
-2.3%/yrLatest (2026): $720 · +1.4% YoY. Source: county tax records.
Cash-flow waterfall
monthlySold comps — $/sqft
last 12 mo · ≤1 miLoading sold comps…