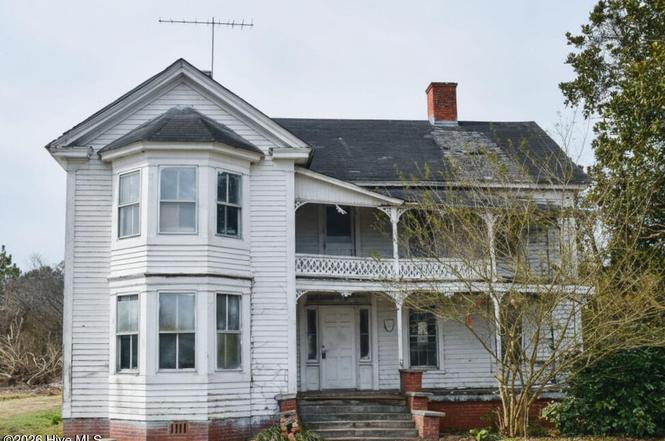
519 Church St · Fairfield, NC
Flood risk 8/10 · Major
- FEMA flood zone
- AE
- Chance of flooding over 30 yrs
- 0.99%
- Est. flood insurance / yr
- $1,737 – $8,500
Fire risk 1/10 · Minimal
- Est. fire insurance / yr
- $906 – $1,684
Heat risk 8/10 · Major
- Hot days now (above 106°F)
- 7 days/yr
- Hot days in 30 yrs
- 18 days/yr
Wind risk 9/10 · Severe
- Chance of severe wind over 30 yrs
- 99.0%
Air-quality risk 2/10 · Minimal
- Unhealthy air days now
- 1 days/yr
- Unhealthy air days in 30 yrs
- 1 days/yr
Risk factors via First Street. Map © Google.
Why this score? — see what drove the B+ grade
The composite is a weighted blend of 9 inputs, each scored 0–100. Each bar is that input's sub-score; the figure is the points it added to the 100-point composite (weight × sub-score).
- Cash flow +30.0/30.0
- 1% rule +10.0/10.0
- DSCR +10.0/10.0
- ARV discount +7.5/15.0
- Appreciation +7.2/10.0
- Schools +3.5/10.0
- Livability +2.6/5.0
- Rent growth +2.5/5.0
- Condition / age +2.5/5.0
$89,900
🖨 Deal sheet 📄 Offer letter ✓ Due diligence
Listing remarks
Step into history at 519 Church St, where timeless charm meets modern living. This 1869 gem, located in the heart of Fairfield's Historic District, invites you to experience a piece of the past with its Greek Revival and vernacular influences. The ornate sawnwork on the two-story front porch sets the stage for the unique character found within. Inside, spacious rooms unfold with the elegance of a bygone era, offering a perfect canvas for your personal touch. Imagine evenings by the large interior chimney, a central feature that adds warmth and a sense of nostalgia. This home is more than just a residence; it's a part of a storied neighborhood recognized on the National Register of Historic
Key facts
- Greek revival
- Historic district
- 2.74 acre lot
Tags
Property features AI
Exterior
- Parking: Unpaved parking
- Utilities: Public water; Water connected; Sewer: other
- Home design: Single-family residence; Two-story; Entry level: 1
- Construction: Wood siding and frame construction; Foundation: brick/mortar and pillar/post/pier; Built with traditional frame materials
- Exterior features: Shingle roof; Shed(s); Level lot; See remarks about frontage and lot details; Road frontage on city street and state road; Has view
Interior
- Flooring: Wood flooring
- Bathrooms: 2 full bathrooms
- Heating & cooling: No heating; No cooling
- Interior features: High ceilings; Crawl space basement
- Laundry & utility: Electric water heater
Neighborhood map
What this means for you Summary
Snapshot
- This is a 4-bed/2.0-bath single-family listed at $90k.
Deal economics
- At list price, monthly cash flow is $22 ($265/yr) — positive.
- The deal already cash-flows at list — no discount required.
- Meets the 1% rule at list price ($1k rent vs $90k).
- Recommended offer: $82k (9.0% below list) — sets the bar for market timing.
Location & tenants
- Location reads 52/100 on livability (#692 in NC) — a working-class tenant base; expect higher turnover. Strengths: cost of living A+; Watch: health & safety C-, employment D, schools F.
- Hyde County Schools (rural): math 36% / reading 47% proficiency, ranked #107 of 178 in NC (top 60%) — families likely to look elsewhere, expect single-tenant / working-renter base with shorter leases.
- Market conditions: 3 active listings in the ZIP; 23 units permitted in Hyde County in 2024 (10 in 5+ unit buildings).
Forward outlook
- In year one you build about $5k of equity ($622 loan paydown + $4k appreciation (4.4% local appreciation)).
- Hyde County population projected at -23% by 2050 — secular population decline; favor cash flow + early exit over multi-decade hold.
- At projected returns (4.4% appreciation + 3.0% rent growth), your $25k cash investment doubles in ~5 years — after that, you're playing with house money.
- By year 8, paydown + projected appreciation supports a ~$35k cash-out refi (75% LTV) — recoverable capital for the next deal without selling this one.
Negotiation context
- It's been on market 106 days — a 9% lower offer ($82k) is reasonable based on typical stale-listing flexibility.
Risks & watch-outs
- Watch-outs: flood insurance adds $427/mo; built in 1869 — expect roof / HVAC / electrical / plumbing capex.
- Climate carrying-cost: in FEMA flood zone AE (mandatory federal flood insurance); severe wind risk, 99% chance of damaging wind over 30y; extreme-heat days projected 7→18/yr by 2055 (HVAC capex compounding) — expect insurance premiums to compound above CPI over the hold.
Questions for the listing agent
- It's been on market 106 days. Have you received any prior offers? Is the seller open to a 9% concession, seller financing, or rate buy-down credit?
- Built in 1869 — when were the roof, HVAC, electrical panel, plumbing, and water heater last replaced?
- What's the actual annual flood-insurance premium (NFIP or private), and is the property in a SFHA with mandatory coverage?
- Why hasn't it sold? Are there any deal-killer items the seller is aware of (foundation, flood, title, zoning, code violations)?
- Is there a deadline driving the sale (1031 exchange, divorce, estate, relocation)? That informs how much negotiation room exists.
- Schools are F-rated, which usually means shorter tenancies and higher turnover. Who's the typical renter profile here, and what's been the actual vacancy rate?
- Crime grade is F in this area — have there been break-ins, vandalism, or insurance claims at this property in the last 3 years? What carrier currently insures it and at what premium?
- What's the average days-on-market for RENTAL listings here right now (not sales)? A rising rental-DOM trend means longer vacancies and softer asking-rent achievability than the comps imply.
- What's the recent tenant-quality profile in this submarket — average credit score on applications, eviction rate, late-payment / NSF rate, and stable-employment percentage? A property-management company in the area should have these aggregated.
- How much new for-sale + rental construction is in the pipeline within 1–3 miles? Heavy new supply typically softens prices + rents 12–24 months out; constrained supply supports both.
Investment metrics
- 1% rule
- 1.54% ✓
- Cap rate
- 12.28%
- Cash-on-cash
- 21.39%
- DSCR
- 1.95
- GRM
- 5.4
CMA / ARV
No comps found within radius.
Projected returns pro-forma
4.44% appreciation · 3.0% rent growth · sell at horizon
- IRR
- 12.5%
- Equity multiple
- 1.78×
- Total profit
- $19,585
- Equity at exit
- $47,925
- IRR
- 13.9%
- Equity multiple
- 3.38×
- Total profit
- $60,005
- Equity at exit
- $80,317
Cash invested: $25,172 (down + closing). Projections, not guarantees.
Landlord ↔ Tenant lean methodology
- Overall (STATE)
- 85 Strongly Landlord-Friendly
- State North Carolina
- 85 Strongly Landlord-Friendly · R+3
- County
- — inherits STATE
- City
- — inherits STATE
ZIP-level market 27826
- Home prices YoY
- 2.6%
- Active inventory
- 3
- Price-to-rent
- 5.4×
Monthly cashflow live
- Estimated rent
- $1,382 medium interval (Pro) →
- Mortgage (P&I)
- −$471
- Tax from tax record
- −$134 /mo · $1,609/yr
- Insurance
- −$37
- Flood insurance flood zone
- −$427 /mo · $5,118/yr
- HOA
- −$0
- Vacancy / Maint / Mgmt
- −$290
- Net cashflow
- $22
Break-even live
UW: 25.0% down · 7.5% · 30yr · 1.5% tax · 5.0% vac · 8.0% maint · 8.0% mgmt
Financing live
Cash to close
- Down payment
- $22,475
- Closing costs
- $2,697
- Reserves months
- —
- Total cash needed
- —
Loan-product check · same deal, 3 products live
Conventional
25% down · 7.5% · 30yr
- Down + closing
- —
- Monthly P&I
- —
- Monthly cashflow
- —
- DSCR
- —
- Eligible?
- —
Personal DTI + credit; lowest rate.
DSCR
20% down · 8.5% · 30yr
- Down + closing
- —
- Monthly P&I
- —
- Monthly cashflow
- —
- DSCR
- —
- Eligible?
- —
No personal income docs; deal must DSCR.
Hard money
10% down · 12.0% · 12mo
- Down + closing
- —
- Monthly P&I
- —
- Monthly cashflow
- —
- DSCR
- —
- Eligible?
- —
Short-term bridge; refi at stabilization.
Listing history 12 events
-
2026-06-12statusdays on market $89,900 Pending 106 DOM
-
2026-06-09days on market $89,900 Active 103 DOM
-
2026-06-08days on market $89,900 Active 102 DOM
-
2026-06-07days on market $89,900 Active 101 DOM
-
2026-06-07days on market $89,900 Active 100 DOM
-
2026-06-04days on market $89,900 Active 97 DOM
-
2026-06-02days on market $89,900 Active 96 DOM
-
2026-06-01days on market $89,900 Active 95 DOM
-
2026-05-31days on market $89,900 Active 94 DOM
-
2026-05-19price $89,900
-
2026-04-17price $99,900
-
2026-02-26$114,900 Active
ⓘ Source: listings_history table (triggers on properties + properties_extension) + one-shot
backfill from property_details.listing_events for pre-trigger history.
Tax reassessment forecast NC · Resets to sale price
- Current annual tax
- $1,609 · $134/mo
- Projected year-2 tax
- $1,609 · $134/mo
- Expected delta
- $0/yr ($0/mo · 0.0%)
ⓘ Screening estimate from a state-policy table — verify with the county assessor before closing.
Climate risk First Street
- Flood 8/10 Severe FEMA zone AE · 99% chance over 30 yrs
- Wildfire 1/10 Low
- Heat 8/10 Severe 7 d/yr ≥106°F today · 18 d/yr by 30 yrs out
- Wind 9/10 Extreme 99% chance of damaging wind over 30 yrs
- Air quality 2/10 Low 1 unhealthy d/yr today · 1 by 30 yrs out
Nearby sold comps map
Loading sold comps map…
Walkable amenities ~0.75 mi
Loading nearby amenities…
Taxation est. · year 1
- Rental income
- $16,582
- − Mortgage interest
- −$5,036
- − Property taxes
- −$1,609
- − Insurance
- −$5,568
- − Repairs & maintenance
- −$1,327
- − Management
- −$1,327
- − Depreciation
- −$2,615
- Taxable loss
- −$900
- Est. tax savings @ 24.0%
- +$216
- After-tax cash flow
- $481/yr
For passive investors: Depreciation is non-cash, so a rental often shows a tax loss while cash-flowing — sheltering income. Rental losses are passive: they offset passive income freely, and up to $25,000/yr can offset ordinary (W-2) income if you actively participate and your MAGI is under $100k (phasing out to $0 by $150k); unused losses carry forward. On sale, claimed depreciation is recaptured at up to 25%, and gains may owe capital-gains tax (a 1031 exchange can defer both). Figures are a year-1 estimate at your 24.0% rate — not tax advice; consult a CPA.
Schools (NCES district)
- District
- Hyde County Schools
- NCES district ID
- 3702280
- Math proficiency
- 36% ▲ 1.00%
- Reading proficiency
- 47% ▲ 4.00%
- Median HH income
- $41,288
- Composite
- 34.86/100
- National rank
- #5089
- State rank
- #107 of 178 in NC
Livability — Fairfield
- Score
- 52/100
- State rank
- #692
- US rank
- #24950
Category grades
Schools grade is shown separately in the Schools card above.
Census & demographics
- Census place
- Fairfield, NC
- Population (ZIP)
- 1,039
Population outlook (Hyde County) Hauer SSP2
- Today (2025)
- 5,182 people
- By 2030
- 4,962 · -4.2%
- By 2040
- 4,409 · -14.9%
- By 2050
- 3,987 · -23.1%
- By 2075
- 3,401 · -34.4%
- By 2100
- 2,717 · -47.6%
Race, ethnicity, and origin ACS 2023
- Neighborhood character
- Diverse neighborhood (Simpson 0.56)
- Race & ethnicity
- White 51% Black 42% Two or more races 4% Hispanic / Latino 3%
- Common ancestry
- Iranian 1%
- Foreign-born
- 1% · Canada
- Languages at home
- 95% English-only · Spanish 5%
Political lean MEDSL · Hyde
- 2024 margin
- Strong R (+22.1) · D 38.5% · R 60.6%
- 2008→2024 swing
- -23.3pp toward R · 2008: 1.2pp · 2024: -22.1pp
- All cycles
- 2024: R+22.1 2020: R+14.9 2016: R+14.0 2012: R+1.1 2008: D+1.2
Not yet ingested
- Civics
- —
Market trends
- HPI YoY
- ▲ 4.44%
- Current HPI
- 176.728
- Rent YoY
- —
- Metro
- —
- State GDP YoY
- ▲ 3.28%
- F500 in state
- 26
Industry mix (Fortune 500 HQ in NC)
| Industry | F500 HQs | Revenue |
|---|---|---|
| Financial Services | 2 | $213B |
|
||
| Retail | 2 | $95B |
|
||
| Industrial Conglomerate | 1 | $38B |
|
||
| Metals / Steel | 1 | $35B |
|
||
| Utilities | 1 | $30B |
|
||
| Industrial Machinery | 1 | $19B |
|
||
Price history
-21.8% since first listed3 events — show timeline
- 2026-05-19 Price Changed $89,900 Hive MLS
- 2026-04-17 Price Changed $99,900 Hive MLS
- 2026-02-26 Listed $114,900 Hive MLS
Property tax history
+16.0%/yrLatest (2025): $1,609 · +0.0% YoY. Source: county tax records.
Cash-flow waterfall
monthlySold comps — $/sqft
last 12 mo · ≤1 miLoading sold comps…