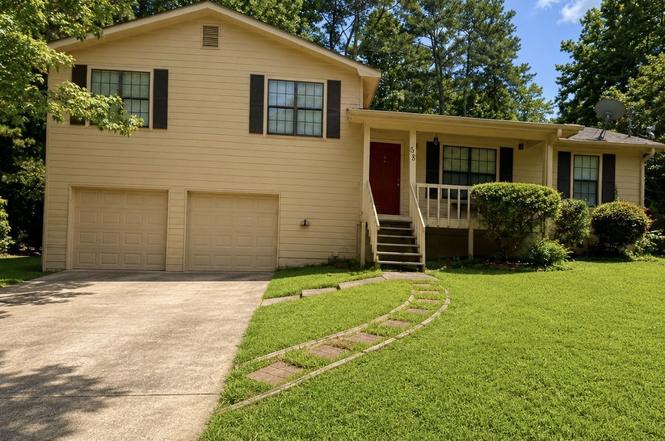
58 Alps Ct · Fairburn, GA
Flood risk 1/10 · Minimal
- FEMA flood zone
- X (unshaded)
- Chance of flooding over 30 yrs
- 0.0%
- Est. flood insurance / yr
- $473 – $860
Fire risk 3/10 · Minor
- Est. fire insurance / yr
- $963 – $1,789
Heat risk 5/10 · Moderate
- Hot days now (above 104°F)
- 7 days/yr
- Hot days in 30 yrs
- 19 days/yr
Wind risk 5/10 · Moderate
- Chance of severe wind over 30 yrs
- 25.0%
Air-quality risk 3/10 · Minor
- Unhealthy air days now
- 3 days/yr
- Unhealthy air days in 30 yrs
- 4 days/yr
Risk factors via First Street. Map © Google.
Why this score? — see what drove the D- grade
The composite is a weighted blend of 9 inputs, each scored 0–100. Each bar is that input's sub-score; the figure is the points it added to the 100-point composite (weight × sub-score).
- Cash flow +12.9/30.0
- ARV discount +5.0/15.0
- Schools +4.5/10.0
- DSCR +3.8/10.0
- Livability +3.2/5.0
- Rent growth +3.1/5.0
- 1% rule +2.9/10.0
- Condition / age +2.5/5.0
- Appreciation +0.0/10.0
$240,000
🖨 Deal sheet 📄 Offer letter ✓ Due diligence
Listing remarks MLS
Welcome home to this beautiful 3-bedroom, 2-bath split-level home situated on a desirable corner lot with a spacious front and back yard. Designed for comfortable living and entertaining, this home features a bright and inviting floor plan with generous living spaces throughout. The main level offers a welcoming living room and a separate dining room, perfect for hosting family dinners and special gatherings. The well-appointed kitchen provides ample cabinet and counter space, making meal preparation a breeze. Step outside to enjoy the large deck overlooking the backyard-an ideal space for relaxing, grilling, or entertaining guests. The expansive yard offers plenty of room for outdoor activities, gardening, or future enhancements. Additional features include a spacious 2-car garage, ample parking, and excellent curb appeal. Conveniently located near shopping, dining, schools, and major highways, this home offers the perfect combination of space, comfort, and convenience. Don't miss your opportunity to own this wonderful property-schedule your private showing today!
Key facts
- Spacious front yard
- Separate dining room
- Spacious back yard
Tags
Property features AI
Exterior
- Parking: Garage parking (2 spaces); Total of 2 parking spaces
- Utilities: Public water; Public sewer; Electric service available (including 220V in laundry); Cable available; Water and sewer connections available
- Home design: Multi-level / split floor plan; Resale condition
- Construction: HardiPlank-type siding; Slab foundation; Other roof type; Built with conventional construction materials
- Exterior features: Balcony; Private yard; Private entrance; Exterior lighting; Deck; Front porch; Rear porch; Back yard and chain-link fencing; Detached shed(s)
Interior
- Kitchen: Country-style eat-in kitchen; Solid surface and other surface counters; Refrigerator included
- Bedrooms: Three upper-level bedrooms; Bedrooms with unspecified 'Other' features
- Flooring: Carpet; Hardwood; Stone; Tile
- Bathrooms: Two full bathrooms; Master bath with shower-only and additional features
- Heating & cooling: Forced air heating; Central air conditioning
- Interior features: One fireplace with stone surround in the family room; Window treatments; Partial basement; Other interior features
- Laundry & utility: Laundry located in the garage; 220-volt outlet in laundry
Neighborhood map
What this means for you Summary
Snapshot
- This is a 3-bed/2.0-bath single-family listed at $240k.
Deal economics
- At list price, monthly cash flow is $-20 ($-235/yr) — negative.
- To cash-flow at today's rent, offer at most $237k (1.4% below list).
- To meet the 1% rule (rent ≥ 1% of price), the offer needs to be $189k (21.3% below list).
- Recommended offer: $189k (21.3% below list) — sets the bar for 1% rule.
- Cap rate 6.2% vs local median 4.0% in Fairburn — top-decile yield for the area; either an underpriced asset or a hidden risk that comps aren't pricing in. Stress-test before assuming the spread holds.
Location & tenants
- Location reads 63/100 on livability (#291 in GA) — a middle-class / working-renter tenant base. Strengths: crime A+, cost of living A+, housing A+; Watch: employment C-, amenities F, commute F.
- Fulton County (suburban): math 49% / reading 53% proficiency, ranked #12 of 174 in GA (top 7%) — acceptable for families but not a draw, mixed tenant base, ~2y average lease.
- Zoned schools: Renaissance Es (math 22% / reading 32%, grade F, #689 of 1,228 statewide, top 58%, 601 students, 100% FRL); Creekside High School (math 30% / reading 24%, grade F, #160 of 424 statewide, top 38%, 1,768 students, 100% FRL) — zoned schools average 100% FRL vs 41% district-wide (59 pts higher); higher-poverty schools than district average — tighter screening recommended.
- Zoned-school proficiency averages 27% at this address vs 51% district-wide (-24 pts) — the specific schools serving this property underperform the Fulton County average; the district grade overstates school quality for this exact location.
- Market conditions: Rents rising (+2.5%/yr); 531 active listings in the ZIP; 24 comparable units currently listed for rent nearby; rentals at typical pace (median 20d on market — plan ~3-4 weeks tenant-placement turnaround); solid renter incomes; 11,565 units permitted in Fulton County in 2024 (8,159 in 5+ unit buildings).
Forward outlook
- Local home prices are declining (-3.0%/yr); year-one equity from $2k of loan paydown is wiped out by about $7k of value loss. Plan a longer hold.
- Fulton County population projected at +38% by 2050 — long-run rental-demand tailwind backs the buy-and-hold thesis.
Negotiation context
- Only 1 days on market — expect competitive offers; lowballing is unlikely to land.
- Current owner paid $38k; list at $240k implies a 532% gain — meaningful room to come down on a strong offer.
Risks & watch-outs
- Climate carrying-cost: moderate wind risk, 25% chance of damaging wind over 30y; extreme-heat days projected 7→19/yr by 2055 (HVAC capex compounding) — expect insurance premiums to compound above CPI over the hold.
Questions for the listing agent
- What do current leases actually rent for vs. the listed asking? Can we see a recent rent roll and the last 12 months of T-12 income?
- Is there a deadline driving the sale (1031 exchange, divorce, estate, relocation)? That informs how much negotiation room exists.
- Schools are F-rated, which usually means shorter tenancies and higher turnover. Who's the typical renter profile here, and what's been the actual vacancy rate?
- The area grade is low — what's the realistic commute time and amenity access for the typical tenant pool here? Any planned neighborhood developments (good or bad) we should know about?
- What's the average days-on-market for RENTAL listings here right now (not sales)? A rising rental-DOM trend means longer vacancies and softer asking-rent achievability than the comps imply.
- What's the recent tenant-quality profile in this submarket — average credit score on applications, eviction rate, late-payment / NSF rate, and stable-employment percentage? A property-management company in the area should have these aggregated.
- How much new for-sale + rental construction is in the pipeline within 1–3 miles? Heavy new supply typically softens prices + rents 12–24 months out; constrained supply supports both.
Investment metrics
- 1% rule
- 0.79% ✗
- Cap rate
- 6.19%
- Cash-on-cash
- -0.35%
- DSCR
- 0.98
- GRM
- 10.6
CMA / ARV
- ARV (on-the-fly)
- $227,370
- Comps found
- 5
Show comp detail 5 sales within ~0.75 mi
| Address | Dist | Beds/Ba | Sqft | Sold | Price | $/sf | Match |
|---|---|---|---|---|---|---|---|
| 304 Orme St | 0.30mi | 3/2.0 | 1,440 (+1%) | 9mo | $225,000 | $156 | 77 |
| 85 Edelweiss Dr | 0.09mi | 4/2.5 (+1) | 1,528 (+7%) | 5mo | $258,000 | $169 | 74 |
| 85 Valleybrook Dr | 0.48mi | 3/2.0 | 1,536 (+7%) | 6mo | $243,500 | $159 | 60 |
| 296 Orme St | 0.31mi | 2/1.0 (-1) | 1,240 (-13%) | 7mo | $185,000 | $149 | 49 |
| 96 Greene St NE | 0.71mi | 3/1.5 | 1,222 (-14%) | 1mo | $219,000 | $179 | 39 |
Match score weights: distance 35% · size 25% · config 20% · recency 20%. Top-matched comps best support the ARV.
Projected returns pro-forma
-3.0% appreciation · 2.53% rent growth · sell at horizon
- IRR
- -17.4%
- Equity multiple
- 0.39×
- Total profit
- $-41,090
- Equity at exit
- $35,785
- IRR
- -10.3%
- Equity multiple
- 0.39×
- Total profit
- $-41,253
- Equity at exit
- $20,751
Cash invested: $67,200 (down + closing). Projections, not guarantees.
Landlord ↔ Tenant lean methodology
- Overall (STATE)
- 90 Strongly Landlord-Friendly
- State Georgia
- 90 Strongly Landlord-Friendly · R+3
- County
- — inherits STATE
- City
- — inherits STATE
ZIP-level market 30213
- Home prices YoY
- -17.7%
- Rents YoY
- 2.5%
- Active inventory
- 531
- Price-to-rent
- 10.6×
Monthly cashflow live
- Estimated rent
- $1,890 high interval (Pro) →
- Mortgage (P&I)
- −$1,259
- Tax from tax record
- −$154 /mo · $1,845/yr
- Insurance
- −$100
- HOA
- −$0
- Vacancy / Maint / Mgmt
- −$397
- Net cashflow
- $-20
Break-even live
UW: 25.0% down · 7.5% · 30yr · 1.5% tax · 5.0% vac · 8.0% maint · 8.0% mgmt
Financing live
Cash to close
- Down payment
- $60,000
- Closing costs
- $7,200
- Reserves months
- —
- Total cash needed
- —
Loan-product check · same deal, 3 products live
Conventional
25% down · 7.5% · 30yr
- Down + closing
- —
- Monthly P&I
- —
- Monthly cashflow
- —
- DSCR
- —
- Eligible?
- —
Personal DTI + credit; lowest rate.
DSCR
20% down · 8.5% · 30yr
- Down + closing
- —
- Monthly P&I
- —
- Monthly cashflow
- —
- DSCR
- —
- Eligible?
- —
No personal income docs; deal must DSCR.
Hard money
10% down · 12.0% · 12mo
- Down + closing
- —
- Monthly P&I
- —
- Monthly cashflow
- —
- DSCR
- —
- Eligible?
- —
Short-term bridge; refi at stabilization.
Rent comps 24 comps
| Address | Beds | Baths | Sqft | Rent | $/sqft | DOM | Units | Dist |
|---|---|---|---|---|---|---|---|---|
| 700 Parkway Rd Union City, GA | 3.0 | 2.5 | 1770 | $1,795 | $1.01 | 19d | 1 | 0.48mi |
| 1065 Maple Valley Ct Union City, GA | 3.0 | 2.5 | 1456 | $1,600 | $1.10 | 43d | 1 | 0.52mi |
| 116 Spring Ct Unit 1 Fairburn, GA | 2.0 | 1.0 | 944 | $1,095 | $1.16 | 43d | 1 | 0.59mi |
| 460 Parkway Rd Unit 460 Union City, GA | 3.0 | 2.5 | 1678 | $1,750 | $1.04 | 24d | 1 | 0.60mi |
| 227 Bay St SE Unit 227 Fairburn, GA | 2.0 | 1.0 | 1034 | $1,250 | $1.21 | 1d | 1 | 0.66mi |
| 227 Bay St SE Unit 227 Fairburn, GA | 2.0 | 1.0 | 1034 | $1,250 | $1.21 | 22d | 1 | 0.66mi |
| 340 Parkway Rd #340 Union City, GA | 3.0 | 2.5 | 1456 | $1,750 | $1.20 | 3d | 1 | 0.69mi |
| 50 Clay St Fairburn, GA | 2.0 | 1.5 | 1138 | $1,473 | $1.29 | 1d | 11 | 0.71mi |
| 5300 Highway 138 Union City, GA | 1.0–2.0 | 1.0–2.0 | 990 | $1,350 | $1.36 | 16d | 19 | 0.72mi |
| 7599 Avalon Blvd Fairburn, GA | 3.0 | 2.5 | 1648 | $2,039 | $1.24 | 2d | 1 | 0.94mi |
| 5472 Festival Ave Fairburn, GA | 3.0 | 2.5 | 1640 | $2,100 | $1.28 | 12d | 1 | 0.95mi |
| 5472 Festival Ave Fairburn, GA | 3.0 | 2.5 | 1640 | $2,100 | $1.28 | 5d | 1 | 0.95mi |
| 152 Rivertown Rd Fairburn, GA | 3.0 | 2.0 | 1550 | $3,500 | $2.26 | 22d | 1 | 1.13mi |
| 6045 Capitol Knl Fairburn, GA | 3.0 | 2.5 | 1366 | $1,600 | $1.17 | 43d | 1 | 1.18mi |
| 5058 Jonesboro Rd Union City, GA | 2.0 | 1.0–1.5 | 997 | $1,395 | $1.40 | 20d | 1 | 1.18mi |
| 5058 Jonesboro Rd Unit E37 Union City, GA | 2.0 | 1.5 | 997 | $1,395 | $1.40 | 4d | 1 | 1.18mi |
| 200 Dodd St Fairburn, GA | 3.0 | 2.0 | 1300 | $1,685 | $1.30 | 43d | 1 | 1.20mi |
| 5617 Oakley Industrial Blvd Fairburn, GA | 1.0–3.0 | 1.0–2.5 | 1558 | $4,431 | $2.84 | 1d | 52 | 1.22mi |
| 6540 Capitol Knl Fairburn, GA | 3.0 | 3.5 | 1458 | $1,920 | $1.32 | 5d | 1 | 1.23mi |
| 5500 Oakley Industrial Blvd Fairburn, GA | 1.0–3.0 | 1.0–2.0 | 1057 | $1,835 | $1.74 | 1d | 17 | 1.28mi |
| 7000 Goodson Rd #69 Union City, GA | 3.0 | 2.0 | 960 | $1,400 | $1.46 | 43d | 1 | 1.28mi |
| 5474 Oakley Industrial Blvd Fairburn, GA | 1.0–3.0 | 1.0–2.0 | 1001 | $1,893 | $1.89 | 1d | 13 | 1.39mi |
| 365 Elder St Fairburn, GA | 3.0 | 2.5 | 1084 | $1,625 | $1.50 | 24d | 1 | 1.41mi |
| 111 Jaclyn Way Fairburn, GA | 4.0 | 2.5 | 1681 | $2,245 | $1.34 | 43d | 1 | 1.47mi |
Listing history 3 events
-
2026-06-17status $240,000 Active 1 DOM
-
2026-06-16remarks 693-char remark
-
2026-06-16$240,000 Coming Soon 1 DOM
ⓘ Source: listings_history table (triggers on properties + properties_extension) + one-shot
backfill from property_details.listing_events for pre-trigger history.
Tax reassessment forecast GA · Resets to sale price
- Current annual tax
- $1,845 · $154/mo
- Projected year-2 tax
- $2,208 · $184/mo
- Expected delta
- +$363/yr (+$30/mo · 19.7%)
ⓘ Screening estimate from a state-policy table — verify with the county assessor before closing.
Climate risk First Street
- Flood 1/10 Low FEMA zone X (unshaded) · 0% chance over 30 yrs
- Wildfire 3/10 Moderate
- Heat 5/10 Major 7 d/yr ≥104°F today · 19 d/yr by 30 yrs out
- Wind 5/10 Major 25% chance of damaging wind over 30 yrs
- Air quality 3/10 Moderate 3 unhealthy d/yr today · 4 by 30 yrs out
Nearby sold comps map
Loading sold comps map…
Walkable amenities ~0.75 mi
Loading nearby amenities…
Taxation est. · year 1
- Rental income
- $22,674
- − Mortgage interest
- −$13,444
- − Property taxes
- −$1,845
- − Insurance
- −$1,200
- − Repairs & maintenance
- −$1,814
- − Management
- −$1,814
- − Depreciation
- −$6,982
- Taxable loss
- −$4,424
- Est. tax savings @ 24.0%
- +$1,062
- After-tax cash flow
- $826/yr
For passive investors: Depreciation is non-cash, so a rental often shows a tax loss while cash-flowing — sheltering income. Rental losses are passive: they offset passive income freely, and up to $25,000/yr can offset ordinary (W-2) income if you actively participate and your MAGI is under $100k (phasing out to $0 by $150k); unused losses carry forward. On sale, claimed depreciation is recaptured at up to 25%, and gains may owe capital-gains tax (a 1031 exchange can defer both). Figures are a year-1 estimate at your 24.0% rate — not tax advice; consult a CPA.
Schools (NCES district)
- District
- Fulton County
- NCES district ID
- 1302280
- Math proficiency
- 49% ▼ -2.00%
- Reading proficiency
- 53% ▬ 0.00%
- Median HH income
- $68,035
- Composite
- 45.33/100
- National rank
- #2640
- State rank
- #12 of 174 in GA
Livability — Fairburn
- Score
- 63/100
- State rank
- #291
- US rank
- #15939
Category grades
Schools grade is shown separately in the Schools card above.
Census & demographics
- Census place
- Fairburn, GA
- County
- Fulton County · 1,094,430 people
- City population
- 50,621
- Metro
- Atlanta-Sandy Springs-Alpharetta, GA
- Population (ZIP)
- 50,621
- Household income
- $94,125
- Rent vs Own
- Severe rent burden
- 1025.0
Population outlook (Fulton County) Hauer SSP2
- Today (2025)
- 1,203,707 people
- By 2030
- 1,299,706 · +8.0%
- By 2040
- 1,488,256 · +23.6%
- By 2050
- 1,664,580 · +38.3%
- By 2075
- 2,036,072 · +69.2%
- By 2100
- 2,222,402 · +84.6%
Race, ethnicity, and origin ACS 2023
- Neighborhood character
- Predominantly Black (86%)
- Race & ethnicity
- Black 86% White 8% Hispanic / Latino 4% Two or more races 3%
- Common ancestry
- Hispanic 1% Arab 1% Lithuanian 0%
- Foreign-born
- 7% · Canada
- Languages at home
- 91% English-only · Spanish 4% French/Haitian/Cajun 2% Arabic 1%
Political lean MEDSL · Fulton
- 2024 margin
- Solid D (+44.9) · D 71.9% · R 27.0% · Other 1.1%
- 2008→2024 swing
- +9.8pp toward D · 2008: 35.0pp · 2024: 44.9pp
- All cycles
- 2024: D+44.9 2020: D+46.4 2016: D+42.1 2012: D+29.6 2008: D+35.0
Not yet ingested
- Civics
- —
Market trends
- HPI YoY
- ▼ -50.66%
- Current HPI
- 235.9372
- Rent YoY
- ▲ 2.53%
- Metro
- Atlanta-Sandy Springs-Alpharetta, GA
- State GDP YoY
- ▲ 2.66%
- F500 in state
- 28
Industry mix (Fortune 500 HQ in GA)
| Industry | F500 HQs | Revenue |
|---|---|---|
| Paper / Packaging | 2 | $29B |
|
||
| Retail | 1 | $160B |
|
||
| Transportation / Logistics | 1 | $91B |
|
||
| Airlines | 1 | $62B |
|
||
| Consumer Goods | 1 | $47B |
|
||
| Utilities | 1 | $25B |
|
||
Price history
+92.0% since first listed11 events — show timeline
- 2026-06-15 Coming Soon $240,000 GAMLS
- 2026-06-15 Coming Soon $240,000 FMLS
- 2011-01-14 Listing Removed — FMLS
- 2010-12-30 Listed $39,999 FMLS
- 2010-12-22 Sold (MLS) $38,000 FMLS
- 2010-07-04 Price Changed $49,900 GAMLS
- 2010-06-18 Price Changed $55,000 GAMLS
- 2010-05-28 Price Changed $75,000 GAMLS
- 2010-05-16 Price Changed $99,000 GAMLS
- 2010-05-04 Price Changed $115,000 GAMLS
- 2010-03-12 Price Changed $125,000 GAMLS
Property tax history
+4.2%/yrLatest (2025): $1,845 · +45.6% YoY. Source: county tax records.
Cash-flow waterfall
monthlySold comps — $/sqft
last 12 mo · ≤1 miLoading sold comps…