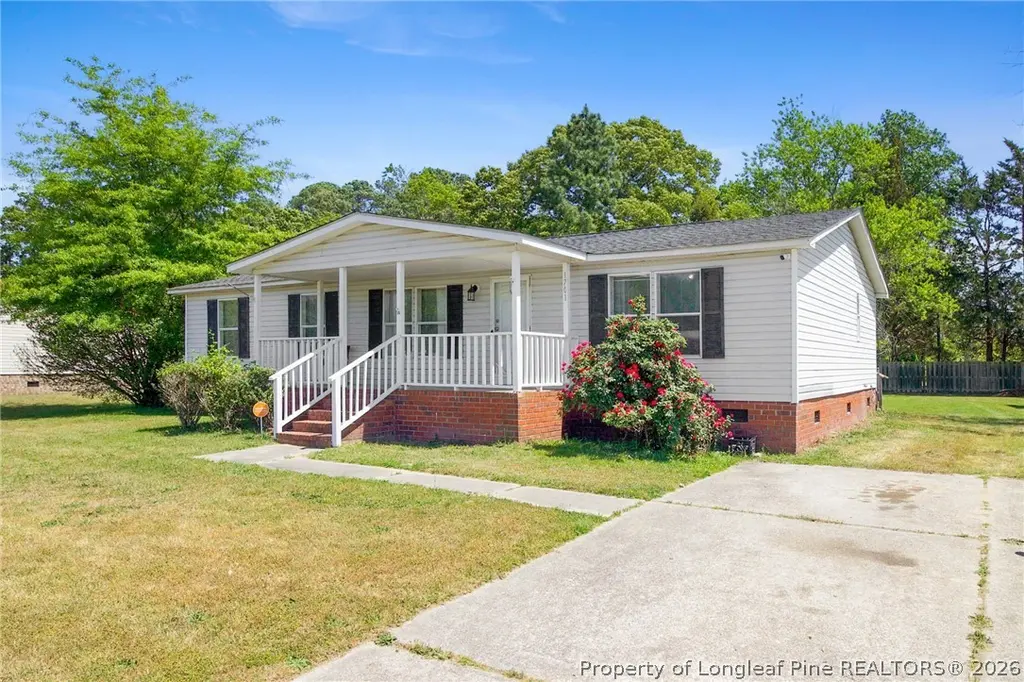
1701 O'bannon Dr · Fayetteville, NC
Flood risk 4/10 · Minor
- FEMA flood zone
- X (unshaded)
- Chance of flooding over 30 yrs
- 0.22%
- Est. flood insurance / yr
- $507 – $1,088
Fire risk 6/10 · Moderate
- Est. fire insurance / yr
- $906 – $1,684
Heat risk 7/10 · Major
- Hot days now (above 106°F)
- 7 days/yr
- Hot days in 30 yrs
- 16 days/yr
Wind risk 7/10 · Major
- Chance of severe wind over 30 yrs
- 78.0%
Air-quality risk 1/10 · Minimal
- Unhealthy air days now
- 0 days/yr
- Unhealthy air days in 30 yrs
- 0 days/yr
Risk factors via First Street. Map © Google.
Why this score? — see what drove the C- grade
The composite is a weighted blend of 9 inputs, each scored 0–100. Each bar is that input's sub-score; the figure is the points it added to the 100-point composite (weight × sub-score).
- Cash flow +23.5/30.0
- DSCR +7.5/10.0
- 1% rule +4.9/10.0
- ARV discount +4.6/15.0
- Livability +3.8/5.0
- Schools +3.2/10.0
- Rent growth +3.0/5.0
- Condition / age +2.5/5.0
- Appreciation +0.0/10.0
$184,900
🖨 Deal sheet 📄 Offer letter ✓ Due diligence
Listing remarks MLS
This 3 bedroom, 2 bathroom home is ideal for a first-time buyer or investor looking to expand their rental portfolio. This property has a front porch and rear deck. Large back yard includes a metal storage shed. Very close to Fort Bragg, shopping and schools.
Key facts
- Covered front porch
- Spacious back yard
- New floor in kitchen
Tags
Property features AI
Finance
- Other: GPS-friendly directions; Subdivision: MCDOUGALD DOWNS
Exterior
- Utilities: Public water; Holding tank or septic tank sewer
- Home design: Manufactured home; Residential property
- Construction: Aluminum siding; Vinyl siding; Unknown construction material
- Exterior features: Deck; Porch; Front porch; Cleared lot
Interior
- Kitchen: Refrigerator; Built-in electric range; Dishwasher; Microwave
- Flooring: Vinyl flooring; Carpet flooring
- Bathrooms: 2 full bathrooms
- Heating & cooling: Heat pump heating; Ceiling fan cooling
- Interior features: Ceiling fans; Eat-in kitchen; High ceilings; Open floorplan; Fireplace in dining room; Crawl space basement
- Laundry & utility: In-unit laundry
Neighborhood map
What this means for you Summary
Snapshot
- This is a 3-bed/2.0-bath manufactured listed at $185k.
Deal economics
- At list price, monthly cash flow is $344 ($4k/yr) — positive.
- The deal already cash-flows at list — no discount required.
- To meet the 1% rule (rent ≥ 1% of price), the offer needs to be $182k (1.4% below list).
- Recommended offer: $174k (6.0% below list) — sets the bar for market timing.
- Cap rate 8.5% vs local median 4.9% in Fayetteville — top-decile yield for the area; either an underpriced asset or a hidden risk that comps aren't pricing in. Stress-test before assuming the spread holds.
Location & tenants
- Location reads 75/100 on livability (#45 in NC, #4,031 nationally) — a middle-class / working-renter tenant base. Strengths: commute A+, cost of living A+, housing A+; Watch: crime F, employment D-.
- Hoke County Schools (suburban): math 35% / reading 40% proficiency, ranked #123 of 178 in NC (top 69%) — families likely to look elsewhere, expect single-tenant / working-renter base with shorter leases.
- Zoned schools: Hoke County High (math 42% / reading 44%, grade F, #372 of 535 statewide, top 69%, 2,060 students, 100% FRL) — zoned schools average 100% FRL vs 57% district-wide (43 pts higher); higher-poverty schools than district average — tighter screening recommended.
- Market conditions: Rents rising (+1.9%/yr); 566 active listings in the ZIP; 8 comparable units currently listed for rent nearby; rentals leasing fast (median 14d on market — plan ~1-2 weeks tenant-placement turnaround); 685 units permitted in Hoke County in 2024 (0 in 5+ unit buildings).
- This rent runs 33% of the median local income ($66k/yr) — at the standard rent-burdened threshold; future hikes will face affordability resistance.
Forward outlook
- Local home prices are declining (-3.0%/yr); year-one equity from $1k of loan paydown is wiped out by about $6k of value loss. Plan a longer hold.
- Hoke County population projected at +36% by 2050 — long-run rental-demand tailwind backs the buy-and-hold thesis.
Negotiation context
- It's been on market 63 days — a 6% lower offer ($174k) is reasonable based on typical stale-listing flexibility.
- 6 sale attempts since 11y ago with the ask held roughly flat each time — persistent listings suggest the price (not the market) is what's stuck; bring a comps-based counter.
- Current owner paid $140k; 32% above their basis — modest negotiation headroom, anchor on the comps not their cost.
Risks & watch-outs
- Climate carrying-cost: major wind risk, 78% chance of damaging wind over 30y; major wildfire risk; extreme-heat days projected 7→16/yr by 2055 (HVAC capex compounding) — expect insurance premiums to compound above CPI over the hold.
Questions for the listing agent
- It's been on market 63 days. Have you received any prior offers? Is the seller open to a 6% concession, seller financing, or rate buy-down credit?
- Why hasn't it sold? Are there any deal-killer items the seller is aware of (foundation, flood, title, zoning, code violations)?
- Is there a deadline driving the sale (1031 exchange, divorce, estate, relocation)? That informs how much negotiation room exists.
- Crime grade is F in this area — have there been break-ins, vandalism, or insurance claims at this property in the last 3 years? What carrier currently insures it and at what premium?
- What's the average days-on-market for RENTAL listings here right now (not sales)? A rising rental-DOM trend means longer vacancies and softer asking-rent achievability than the comps imply.
- What's the recent tenant-quality profile in this submarket — average credit score on applications, eviction rate, late-payment / NSF rate, and stable-employment percentage? A property-management company in the area should have these aggregated.
- How much new for-sale + rental construction is in the pipeline within 1–3 miles? Heavy new supply typically softens prices + rents 12–24 months out; constrained supply supports both.
Investment metrics
- 1% rule
- 0.99% ✗
- Cap rate
- 8.53%
- Cash-on-cash
- 7.97%
- DSCR
- 1.35
- GRM
- 8.5
CMA / ARV
- ARV (on-the-fly)
- $173,664
- Comps found
- 12
Show comp detail 12 sales within ~0.75 mi
| Address | Dist | Beds/Ba | Sqft | Sold | Price | $/sf | Match |
|---|---|---|---|---|---|---|---|
| 2002 Mcguire Dr | 0.06mi | 3/2.0 | 1,296 (0%) | 7mo | $190,000 | $147 | 91 |
| 2410 Ohara Dr | 0.37mi | 3/2.0 | 1,290 (-0%) | 2mo | $192,000 | $149 | 81 |
| 2207 Keen Ct | 0.22mi | 3/2.0 | 1,326 (+2%) | 8mo | $165,000 | $124 | 79 |
| 700 Mackay Ct | 0.38mi | 3/2.0 | 1,227 (-5%) | 4mo | $170,000 | $139 | 70 |
| 709 Mackay Ct | 0.33mi | 3/2.0 | 1,210 (-7%) | 6mo | $173,000 | $143 | 68 |
| 403 Mcdougald Dr | 0.53mi | 3/2.0 | 1,209 (-7%) | 9mo | $162,000 | $134 | 57 |
| 1314 Clan Campbell Dr | 0.29mi | 3/2.0 | 1,106 (-15%) | 9mo | $145,000 | $131 | 54 |
| 419 Mcdougald Dr | 0.61mi | 3/2.0 | 1,120 (-14%) | 2mo | $65,000 | $58 | 47 |
| 2910 Donegal Dr | 0.66mi | 3/2.0 | 1,439 (+11%) | 8mo | $180,000 | $125 | 45 |
| 2639 O'glesby Dr | 0.69mi | 3/2.0 | 1,120 (-14%) | 6mo | $120,000 | $107 | 40 |
| 529 Dunrobin Dr | 0.68mi | 3/2.0 | 1,118 (-14%) | 9mo | $142,000 | $127 | 38 |
| 1013 Dunvegan Dr | 0.74mi | 3/2.0 | 1,120 (-14%) | 8mo | $168,000 | $150 | 36 |
Match score weights: distance 35% · size 25% · config 20% · recency 20%. Top-matched comps best support the ARV.
Projected returns pro-forma
-3.0% appreciation · 1.92% rent growth · sell at horizon
- IRR
- -5.3%
- Equity multiple
- 0.80×
- Total profit
- $-10,100
- Equity at exit
- $27,569
- IRR
- 3.1%
- Equity multiple
- 1.22×
- Total profit
- $11,203
- Equity at exit
- $15,987
Cash invested: $51,772 (down + closing). Projections, not guarantees.
Landlord ↔ Tenant lean methodology
- Overall (STATE)
- 85 Strongly Landlord-Friendly
- State North Carolina
- 85 Strongly Landlord-Friendly · R+3
- County
- — inherits STATE
- City
- — inherits STATE
ZIP-level market 28376
- Home prices YoY
- -24.0%
- Rents YoY
- 1.9%
- Active inventory
- 566
- Price-to-rent
- 8.5×
Monthly cashflow live
- Estimated rent
- $1,822 high interval (Pro) →
- Mortgage (P&I)
- −$970
- Tax from tax record
- −$49 /mo · $588/yr
- Insurance
- −$77
- HOA
- −$0
- Vacancy / Maint / Mgmt
- −$383
- Net cashflow
- $344
Break-even live
UW: 25.0% down · 7.5% · 30yr · 1.5% tax · 5.0% vac · 8.0% maint · 8.0% mgmt
Financing live
Cash to close
- Down payment
- $46,225
- Closing costs
- $5,547
- Reserves months
- —
- Total cash needed
- —
Loan-product check · same deal, 3 products live
Conventional
25% down · 7.5% · 30yr
- Down + closing
- —
- Monthly P&I
- —
- Monthly cashflow
- —
- DSCR
- —
- Eligible?
- —
Personal DTI + credit; lowest rate.
DSCR
20% down · 8.5% · 30yr
- Down + closing
- —
- Monthly P&I
- —
- Monthly cashflow
- —
- DSCR
- —
- Eligible?
- —
No personal income docs; deal must DSCR.
Hard money
10% down · 12.0% · 12mo
- Down + closing
- —
- Monthly P&I
- —
- Monthly cashflow
- —
- DSCR
- —
- Eligible?
- —
Short-term bridge; refi at stabilization.
Rent comps 8 comps
| Address | Beds | Baths | Sqft | Rent | $/sqft | DOM | Units | Dist |
|---|---|---|---|---|---|---|---|---|
| 1502 Clan Campbell Dr Raeford, NC | 3.0 | 2.0 | 1296 | $1,395 | $1.08 | 13d | 1 | 0.36mi |
| 1002 South Pointe Dr Raeford, NC | 1.0–3.0 | 1.0–2.0 | 1074 | $1,920 | $1.79 | 13d | 24 | 0.56mi |
| 1552 Clan Campbell Dr Raeford, NC | 3.0 | 2.0 | 1241 | $1,695 | $1.37 | 13d | 1 | 0.69mi |
| 109 Timberidge Dr Raeford, NC | 3.0 | 2.0 | 1384 | $1,765 | $1.28 | 13d | 1 | 0.71mi |
| 140 Verdmont Dr Raeford, NC | 3.0 | 2.5 | 1856 | $2,200 | $1.19 | 23d | 1 | 0.81mi |
| 334 Woodberry Cir Raeford, NC | 3.0 | 2.0 | 1598 | $1,650 | $1.03 | 13d | 1 | 1.06mi |
| 9000 Stone Gate Dr Raeford, NC | 1.0–3.0 | 1.0–2.0 | 1029 | $1,757 | $1.71 | 13d | 12 | 1.17mi |
| 105 Joseph Dr Raeford, NC | 3.0 | 2.0 | 1152 | $1,275 | $1.11 | 23d | 1 | 1.34mi |
Listing history 31 events
-
2026-06-18days on market $184,900 Active 63 DOM
-
2026-06-17days on market $184,900 Active 62 DOM
-
2026-06-16days on market $184,900 Active 61 DOM
-
2026-06-15days on market $184,900 Active 60 DOM
-
2026-06-14days on market $184,900 Active 58 DOM
-
2026-06-13days on market $184,900 Active 57 DOM
-
2026-06-10days on market $184,900 Active 55 DOM
-
2026-06-09days on market $184,900 Active 54 DOM
-
2026-06-08days on market $184,900 Active 53 DOM
-
2026-06-07days on market $184,900 Active 52 DOM
-
2026-06-05days on market $184,900 Active 49 DOM
-
2026-06-03days on market $184,900 Active 48 DOM
-
2026-06-02days on market $184,900 Active 47 DOM
-
2026-06-01days on market $184,900 Active 46 DOM
-
2026-05-31days on market $184,900 Active 45 DOM
-
2026-05-30days on market $184,900 Active 44 DOM
-
2026-04-16$184,900 Active
-
2025-03-10soldstatus $140,000
-
2025-03-07soldstatus $140,000 Closed 259-char remark
Show marketing remark (259 chars)
This 3 bedroom, 2 bathroom home is ideal for a first-time buyer or investor looking to expand their rental portfolio. This property has a front porch and rear deck. Large back yard includes a metal storage shed. Very close to Fort Bragg, shopping and schools.
-
2025-02-18status Pending 259-char remark
Show marketing remark (259 chars)
This 3 bedroom, 2 bathroom home is ideal for a first-time buyer or investor looking to expand their rental portfolio. This property has a front porch and rear deck. Large back yard includes a metal storage shed. Very close to Fort Bragg, shopping and schools.
-
2025-02-14$139,900 Active 259-char remark
Show marketing remark (259 chars)
This 3 bedroom, 2 bathroom home is ideal for a first-time buyer or investor looking to expand their rental portfolio. This property has a front porch and rear deck. Large back yard includes a metal storage shed. Very close to Fort Bragg, shopping and schools.
-
2025-01-14historical $1,240
-
2024-12-28$1,240
-
2024-08-22status Pending
-
2024-08-22historical
-
2024-08-06$119,900 Active
-
2019-04-12soldstatus $115,000
-
2019-04-10soldstatus $38,333
-
2018-11-29$47,300
-
2015-07-27soldstatus $24,300
-
2015-06-22$23,900
ⓘ Source: listings_history table (triggers on properties + properties_extension) + one-shot
backfill from property_details.listing_events for pre-trigger history.
Tax reassessment forecast NC · Resets to sale price
- Current annual tax
- $588 · $49/mo
- Projected year-2 tax
- $1,516 · $126/mo
- Expected delta
- +$928/yr (+$77/mo · 157.7%)
ⓘ Screening estimate from a state-policy table — verify with the county assessor before closing.
Climate risk First Street
- Flood 4/10 Moderate FEMA zone X (unshaded) · 22% chance over 30 yrs
- Wildfire 6/10 Major
- Heat 7/10 Severe 7 d/yr ≥106°F today · 16 d/yr by 30 yrs out
- Wind 7/10 Severe 78% chance of damaging wind over 30 yrs
- Air quality 1/10 Low 0 unhealthy d/yr today · 0 by 30 yrs out
Nearby sold comps map
Loading sold comps map…
Walkable amenities ~0.75 mi
Loading nearby amenities…
Taxation est. · year 1
- Rental income
- $21,868
- − Mortgage interest
- −$10,357
- − Property taxes
- −$588
- − Insurance
- −$924
- − Repairs & maintenance
- −$1,749
- − Management
- −$1,749
- − Depreciation
- −$5,379
- Taxable income
- $1,120
- Est. tax owed @ 24.0%
- −$269
- After-tax cash flow
- $3,858/yr
For passive investors: Depreciation is non-cash, so a rental often shows a tax loss while cash-flowing — sheltering income. Rental losses are passive: they offset passive income freely, and up to $25,000/yr can offset ordinary (W-2) income if you actively participate and your MAGI is under $100k (phasing out to $0 by $150k); unused losses carry forward. On sale, claimed depreciation is recaptured at up to 25%, and gains may owe capital-gains tax (a 1031 exchange can defer both). Figures are a year-1 estimate at your 24.0% rate — not tax advice; consult a CPA.
Schools (NCES district)
- District
- Hoke County Schools
- NCES district ID
- 3702250
- Math proficiency
- 35% ▼ -1.00%
- Reading proficiency
- 40% ▲ 1.00%
- Median HH income
- $43,896
- Composite
- 31.82/100
- National rank
- #5880
- State rank
- #123 of 178 in NC
Livability — Fayetteville
- Score
- 75/100
- State rank
- #45
- US rank
- #4031
Category grades
Schools grade is shown separately in the Schools card above.
Census & demographics
- County
- Hoke County · 44,880 people
- Metro
- Fayetteville, NC
- Population (ZIP)
- 44,880
- Household income
- $66,471
- Rent vs Own
- Severe rent burden
- 897.0
Population outlook (Hoke County) Hauer SSP2
- Today (2025)
- 63,354 people
- By 2030
- 68,361 · +7.9%
- By 2040
- 78,074 · +23.2%
- By 2050
- 86,384 · +36.4%
- By 2075
- 99,517 · +57.1%
- By 2100
- 98,939 · +56.2%
Race, ethnicity, and origin ACS 2023
- Neighborhood character
- Highly diverse neighborhood (Simpson 0.71)
- Race & ethnicity
- White 38% Black 35% Hispanic / Latino 15% Two or more races 9% Native American 3% Asian 1%
- Hispanic origin (detail)
- Mexican 7% Puerto Rican 4%
- Common ancestry
- Slovak 2% Romanian 1% Italian 1%
- Foreign-born
- 6% · Canada, Vietnam
- Languages at home
- 89% English-only · Spanish 8% French/Haitian/Cajun 1%
Political lean MEDSL · Hoke
- 2024 margin
- Lean D (+5.9) · D 52.4% · R 46.4% · Other 1.2%
- 2008→2024 swing
- -12.8pp toward R · 2008: 18.8pp · 2024: 5.9pp
- All cycles
- 2024: D+5.9 2020: D+10.9 2016: D+10.8 2012: D+19.0 2008: D+18.8
Not yet ingested
- Civics
- —
Market trends
- HPI YoY
- ▼ -53.30%
- Current HPI
- 169.1801
- Rent YoY
- ▲ 1.92%
- Metro
- Fayetteville, NC
- State GDP YoY
- ▲ 3.28%
- F500 in state
- 26
Industry mix (Fortune 500 HQ in NC)
| Industry | F500 HQs | Revenue |
|---|---|---|
| Financial Services | 2 | $213B |
|
||
| Retail | 2 | $95B |
|
||
| Industrial Conglomerate | 1 | $38B |
|
||
| Metals / Steel | 1 | $35B |
|
||
| Utilities | 1 | $30B |
|
||
| Industrial Machinery | 1 | $19B |
|
||
Price history
+673.6% since first listed15 events — show timeline
- 2026-04-16 Listed $184,900 LPRMLS
- 2025-03-10 Sold (Public Records) $140,000 Public Records
- 2025-03-07 Sold (MLS) $140,000 LPRMLS
- 2025-02-18 Pending — LPRMLS
- 2025-02-14 Listed $139,900 LPRMLS
- 2025-01-14 Rental Removed $1,240 TMLS
- 2024-12-28 Listed for Rent $1,240 TMLS
- 2024-08-22 Pending — TMLS
- 2024-08-22 Listing Removed — TMLS
- 2024-08-06 Listed $119,900 TMLS
- 2019-04-12 Sold (Public Records) $115,000 Public Records
- 2019-04-10 Sold (MLS) $38,333 LPRMLS
- 2018-11-29 Listed $47,300 LPRMLS
- 2015-07-27 Sold (MLS) $24,300 LPRMLS
- 2015-06-22 Listed $23,900 LPRMLS
Property tax history
+1.7%/yrLatest (2025): $588 · +0.0% YoY. Source: county tax records.
Cash-flow waterfall
monthlySold comps — $/sqft
last 12 mo · ≤1 miLoading sold comps…