1698 W Park Wood Ln #171 · Tucson, AZ
Flood risk 1/10 · Minimal
- FEMA flood zone
- X (unshaded)
- Chance of flooding over 30 yrs
- 0.0%
- Est. flood insurance / yr
- $507 – $1,088
Fire risk 6/10 · Moderate
- Est. fire insurance / yr
- $610 – $1,132
Heat risk 8/10 · Major
- Hot days now (above 106°F)
- 7 days/yr
- Hot days in 30 yrs
- 20 days/yr
Wind risk 1/10 · Minimal
- Chance of severe wind over 30 yrs
- —
Air-quality risk 1/10 · Minimal
- Unhealthy air days now
- 0 days/yr
- Unhealthy air days in 30 yrs
- 0 days/yr
Risk factors via First Street. Map © Google.
Why this score? — see what drove the D grade
The composite is a weighted blend of 9 inputs, each scored 0–100. Each bar is that input's sub-score; the figure is the points it added to the 100-point composite (weight × sub-score).
- ARV discount +11.8/15.0
- Cash flow +9.7/30.0
- 1% rule +5.0/10.0
- Condition / age +3.8/5.0
- Livability +3.7/5.0
- DSCR +2.7/10.0
- Rent growth +2.4/5.0
- Schools +1.6/10.0
- Appreciation +0.0/10.0
$125,000
🖨 Deal sheet 📄 Offer letter ✓ Due diligence
Listing remarks MLS
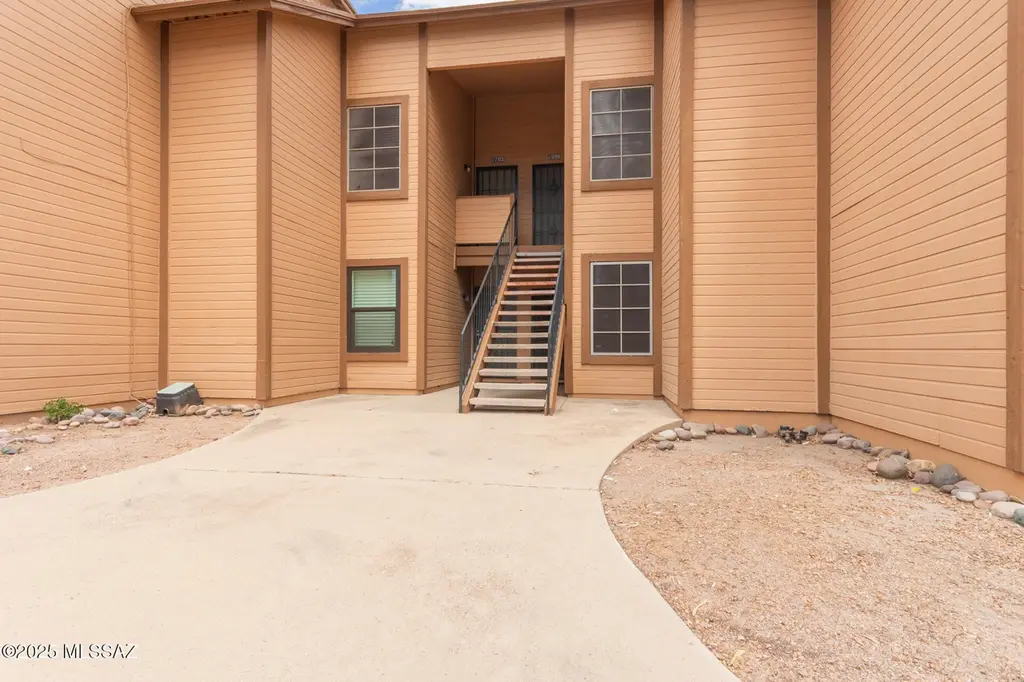
MOTIVATED SELLER!Experience the charm of this upper-level, 2-bedroom unit in Village at Midvale Park! Inside, the inviting living room filled with lots of natural light features vaulted ceilings, fresh paint throughout, wood-look flooring, a wood-burning fireplace, and sliding glass doors leading to the balcony. The eat-in kitchen provides built-in appliances and a two-tier breakfast bar ideal for quick meals. The large primary bedroom offers privacy and tranquility, complete with a private bathroom with a glass step-in shower. Don't miss the stacked washer and dryer. Unwind on the cozy balcony, the perfect spot to enjoy quiet evenings with your favorite drink. After a busy day, take a refreshing dip in the Community pool. This turn-key property is waiting just for you! Hurry! Owner/Agent
Key facts
- Sliding glass doors
- Natural light
- Private bathroom
Tags
Neighborhood map
What this means for you Summary
Snapshot
- This is a 2-bed/2.0-bath condo listed at $125k. Condition is rated good.
Deal economics
- At list price, monthly cash flow is $-82 ($-986/yr) — negative.
- To cash-flow at today's rent, offer at most $113k (9.5% below list).
- To meet the 1% rule (rent ≥ 1% of price), the offer needs to be $124k (0.5% below list).
- Recommended offer: $110k (12.0% below list) — sets the bar for market timing.
- Cap rate 5.5% vs local median 3.7% in Tucson — top-decile yield for the area; either an underpriced asset or a hidden risk that comps aren't pricing in. Stress-test before assuming the spread holds.
Location & tenants
- Location reads 74/100 on livability (#17 in AZ, #4,502 nationally) — a middle-class / working-renter tenant base. Strengths: commute A+, cost of living A+, housing A+; Watch: health & safety C-, schools D+, crime F.
- Tucson Unified District (4403) (urban): math 14% / reading 23% proficiency, ranked #190 of 249 in AZ (top 76%) — low school quality limits family demand, transient renter base, plan for 1-2y turnover.
- Market conditions: Rents soft (-0.2%/yr); 148 active listings in the ZIP; 24 comparable units currently listed for rent nearby; rentals at typical pace (median 20d on market — plan ~3-4 weeks tenant-placement turnaround); 5,268 units permitted in Pima County in 2024 (996 in 5+ unit buildings).
Forward outlook
- Local home prices are declining (-3.0%/yr); year-one equity from $864 of loan paydown is wiped out by about $4k of value loss. Plan a longer hold.
- Pima County population projected at +8% by 2050 — modest demand growth; plan on rents tracking national, not racing it.
Negotiation context
- It's been on market 146 days — a 12% lower offer ($110k) is reasonable based on typical stale-listing flexibility.
- 4 sale attempts since 28y ago with the ask held roughly flat each time — persistent listings suggest the price (not the market) is what's stuck; bring a comps-based counter.
- Current owner paid $50k; list at $125k implies a 151% gain — meaningful room to come down on a strong offer.
Risks & watch-outs
- Climate carrying-cost: major wildfire risk; extreme-heat days projected 7→20/yr by 2055 (HVAC capex compounding) — expect insurance premiums to compound above CPI over the hold.
Questions for the listing agent
- What do current leases actually rent for vs. the listed asking? Can we see a recent rent roll and the last 12 months of T-12 income?
- It's been on market 146 days. Have you received any prior offers? Is the seller open to a 12% concession, seller financing, or rate buy-down credit?
- What does the HOA fee cover, when was the last increase, and are there any pending special assessments or reserve-fund shortfalls?
- Any open or pending special assessments — roof, HVAC, plumbing, elevator, façade? What's the per-unit balance and payoff schedule, and is the seller paying it off at close or rolling it to the buyer?
- Why hasn't it sold? Are there any deal-killer items the seller is aware of (foundation, flood, title, zoning, code violations)?
- Is there a deadline driving the sale (1031 exchange, divorce, estate, relocation)? That informs how much negotiation room exists.
- Schools are D-rated, which usually means shorter tenancies and higher turnover. Who's the typical renter profile here, and what's been the actual vacancy rate?
- Crime grade is F in this area — have there been break-ins, vandalism, or insurance claims at this property in the last 3 years? What carrier currently insures it and at what premium?
- The area grade is low — what's the realistic commute time and amenity access for the typical tenant pool here? Any planned neighborhood developments (good or bad) we should know about?
- What's the average days-on-market for RENTAL listings here right now (not sales)? A rising rental-DOM trend means longer vacancies and softer asking-rent achievability than the comps imply.
- What's the recent tenant-quality profile in this submarket — average credit score on applications, eviction rate, late-payment / NSF rate, and stable-employment percentage? A property-management company in the area should have these aggregated.
- How much new apartment / multifamily construction is in the pipeline within 1–3 miles? Heavy new supply (>2% of stock underway) typically softens rents 12–24 months out; light construction supports rent growth.
Investment metrics
- 1% rule
- 1.00% ✗
- Cap rate
- 5.50%
- Cash-on-cash
- -2.82%
- DSCR
- 0.87
- GRM
- 8.4
CMA / ARV
- ARV (median comp)
- $138,103
- List price
- $125,000
- Delta
- -9.49%
- Verdict
- FAIR
- Comps
- 20 within 1.0 mi
Projected returns pro-forma
-3.0% appreciation · 0.0% rent growth · sell at horizon
- IRR
- -25.2%
- Equity multiple
- 0.17×
- Total profit
- $-28,993
- Equity at exit
- $18,638
- IRR
- -39.3%
- Equity multiple
- -0.30×
- Total profit
- $-45,496
- Equity at exit
- $10,808
Cash invested: $35,000 (down + closing). Projections, not guarantees.
Landlord ↔ Tenant lean methodology
- Overall (STATE)
- 87 Strongly Landlord-Friendly
- State Arizona
- 87 Strongly Landlord-Friendly · R+3
- County
- — inherits STATE
- City
- — inherits STATE
ZIP-level market 85746
- Home prices YoY
- -15.2%
- Rents YoY
- -0.2%
- Active inventory
- 148
- Price-to-rent
- 8.4×
Monthly cashflow live
- Estimated rent
- $1,244 high interval (Pro) →
- Mortgage (P&I)
- −$656
- Tax est. 1.5%
- −$156 /mo · $1,875/yr
- Insurance
- −$52
- HOA
- −$201
- Vacancy / Maint / Mgmt
- −$261
- Net cashflow
- $-82
Break-even live
UW: 25.0% down · 7.5% · 30yr · 1.5% tax · 5.0% vac · 8.0% maint · 8.0% mgmt
Financing live
Cash to close
- Down payment
- $31,250
- Closing costs
- $3,750
- Reserves months
- —
- Total cash needed
- —
Loan-product check · same deal, 3 products live
Conventional
25% down · 7.5% · 30yr
- Down + closing
- —
- Monthly P&I
- —
- Monthly cashflow
- —
- DSCR
- —
- Eligible?
- —
Personal DTI + credit; lowest rate.
DSCR
20% down · 8.5% · 30yr
- Down + closing
- —
- Monthly P&I
- —
- Monthly cashflow
- —
- DSCR
- —
- Eligible?
- —
No personal income docs; deal must DSCR.
Hard money
10% down · 12.0% · 12mo
- Down + closing
- —
- Monthly P&I
- —
- Monthly cashflow
- —
- DSCR
- —
- Eligible?
- —
Short-term bridge; refi at stabilization.
Rent comps 24 comps
| Address | Beds | Baths | Sqft | Rent | $/sqft | DOM | Units | Dist |
|---|---|---|---|---|---|---|---|---|
| 1698 W Wood Bridge Ct Tucson, AZ | 1.0 | 1.0 | 770 | $1,025 | $1.33 | 44d | 1 | 0.04mi |
| 1710 W Wood Bridge Ct Tucson, AZ | 2.0 | 2.0 | 1015 | $1,000 | $0.99 | 3d | 1 | 0.04mi |
| 1668 W Park Wood Ln Tucson, AZ | 2.0 | 2.0 | 1019 | $995 | $0.98 | 24d | 1 | 0.04mi |
| 1686 W Wood Bridge Ct Tucson, AZ | 3.0 | 2.0 | 1309 | $1,400 | $1.07 | 44d | 1 | 0.05mi |
| 5664 S Wood Crest Dr Tucson, AZ | 2.0 | 2.0 | 1019 | $1,150 | $1.13 | 3d | 1 | 0.06mi |
| 5664 S Wood Crest Dr Tucson, AZ | 2.0 | 2.0 | 1019 | $1,200 | $1.18 | 44d | 1 | 0.06mi |
| 5600 S Midvale Park Rd Tucson, AZ | 1.0–3.0 | 1.0–2.0 | 787 | $1,012 | $1.29 | 2d | 12 | 0.15mi |
| 1616 W Wood Crest Ct Tucson, AZ | 2.0 | 2.0 | 1304 | $1,650 | $1.27 | 3d | 1 | 0.15mi |
| 5505 S Mission Rd Tucson, AZ | 1.0–4.0 | 1.0–2.0 | 949 | $1,167 | $1.23 | 2d | 29 | 0.45mi |
| 1594 W Swisher Pl Tucson, AZ | 3.0 | 2.0 | 1158 | $1,695 | $1.46 | 44d | 1 | 0.50mi |
| 6060 S Moorheart Pl Tucson, AZ | 3.0 | 2.0 | 1142 | $1,600 | $1.40 | 44d | 1 | 0.55mi |
| 6082 S Birchwood Dr Tucson, AZ | 3.0 | 2.0 | 1390 | $1,745 | $1.26 | 3d | 1 | 0.61mi |
| 1950 W Burgundy Way Tucson, AZ | 3.0 | 2.0 | 1380 | $1,800 | $1.30 | 44d | 1 | 0.62mi |
| 1950 W Burgundy Way Tucson, AZ | 3.0 | 2.0 | 1380 | $1,750 | $1.27 | 20d | 1 | 0.62mi |
| 2040 W Nebraska St Tucson, AZ | 1.0 | 1.0 | 700 | $995 | $1.42 | 44d | 1 | 0.71mi |
| 1483 W Flannery Pl Tucson, AZ | 3.0 | 2.0 | 1381 | $1,695 | $1.23 | 12d | 1 | 0.81mi |
| 6250 S Commerce Ct Tucson, AZ | 1.0–2.0 | 1.0–2.0 | 726 | $1,413 | $1.94 | 2d | 9 | 0.85mi |
| 2021 W Menzel Dr Tucson, AZ | 3.0 | 2.0 | 1196 | $1,599 | $1.34 | 3d | 1 | 0.95mi |
| 1970 W Valencia Rd Tucson, AZ | 1.0–2.0 | 1.0–2.0 | 689 | $1,421 | $2.06 | 2d | 1 | 0.98mi |
| 909 W Milton St Tucson, AZ | 3.0 | 2.0 | 1296 | $1,695 | $1.31 | 44d | 1 | 1.05mi |
| 842 W Calle Ramona Tucson, AZ | 2.0 | 1.0 | 828 | $1,200 | $1.45 | 3d | 1 | 1.12mi |
| 5740 S Hildreth Ave Tucson, AZ | 3.0 | 2.0 | 1472 | $1,770 | $1.20 | 20d | 1 | 1.33mi |
| 6630 S Avenida Mirella Bonita Tucson, AZ | 3.0 | 2.0 | 1265 | $1,900 | $1.50 | 44d | 1 | 1.37mi |
| 1983 W Calle Cielo de Oro Tucson, AZ | 3.0 | 2.0 | 1024 | $1,695 | $1.66 | 17d | 1 | 1.39mi |
HOA detail condo
- Monthly dues
- $201 · $2,412/yr
- Likely covers
- pool
- Assessments
- None detected in remarks — confirm with the listing agent.
Listing history 26 events
-
2026-06-18days on market $125,000 Active 146 DOM
-
2026-06-17days on market $125,000 Active 145 DOM
-
2026-06-16days on market $125,000 Active 144 DOM
-
2026-06-15days on market $125,000 Active 143 DOM
-
2026-06-13days on market $125,000 Active 141 DOM
-
2026-06-10days on market $125,000 Active 138 DOM
-
2026-06-09days on market $125,000 Active 137 DOM
-
2026-06-08days on market $125,000 Active 136 DOM
-
2026-06-07days on market $125,000 Active 135 DOM
-
2026-06-05days on market $125,000 Active 132 DOM
-
2026-06-03days on market $125,000 Active 131 DOM
-
2026-06-02days on market $125,000 Active 130 DOM
-
2026-06-02price $125,000 Active 129 DOM
-
2026-06-01days on market $130,000 Active 129 DOM
-
2026-05-31days on market $130,000 Active 128 DOM
-
2026-01-23$130,000 Active 799-char remark
Show marketing remark (799 chars)
MOTIVATED SELLER!Experience the charm of this upper-level, 2-bedroom unit in Village at Midvale Park! Inside, the inviting living room filled with lots of natural light features vaulted ceilings, fresh paint throughout, wood-look flooring, a wood-burning fireplace, and sliding glass doors leading to the balcony. The eat-in kitchen provides built-in appliances and a two-tier breakfast bar ideal for quick meals. The large primary bedroom offers privacy and tranquility, complete with a private bathroom with a glass step-in shower. Don't miss the stacked washer and dryer. Unwind on the cozy balcony, the perfect spot to enjoy quiet evenings with your favorite drink. After a busy day, take a refreshing dip in the Community pool. This turn-key property is waiting just for you! Hurry! Owner/Agent
-
2026-01-22historical
-
2025-12-16price $135,000
-
2025-12-16status Active
-
2025-12-14price $138,000
-
2025-12-14historical Active Contingent
-
2025-11-21price $135,000
-
2025-09-26price $140,000
-
2025-08-20$150,000 Active
-
1998-05-06soldstatus $49,900
-
1998-03-24$49,900
ⓘ Source: listings_history table (triggers on properties + properties_extension) + one-shot
backfill from property_details.listing_events for pre-trigger history.
Climate risk First Street
- Flood 1/10 Low FEMA zone X (unshaded) · 0% chance over 30 yrs
- Wildfire 6/10 Major
- Heat 8/10 Severe 7 d/yr ≥106°F today · 20 d/yr by 30 yrs out
- Wind 1/10 Low
- Air quality 1/10 Low 0 unhealthy d/yr today · 0 by 30 yrs out
Nearby sold comps map
Loading sold comps map…
Walkable amenities ~0.75 mi
Loading nearby amenities…
Taxation est. · year 1
- Rental income
- $14,927
- − Mortgage interest
- −$7,002
- − Property taxes
- −$1,875
- − Insurance
- −$625
- − Repairs & maintenance
- −$1,194
- − Management
- −$1,194
- − HOA
- −$2,412
- − Depreciation
- −$3,636
- Taxable loss
- −$3,012
- Est. tax savings @ 24.0%
- +$723
- After-tax cash flow
- $-263/yr
For passive investors: Depreciation is non-cash, so a rental often shows a tax loss while cash-flowing — sheltering income. Rental losses are passive: they offset passive income freely, and up to $25,000/yr can offset ordinary (W-2) income if you actively participate and your MAGI is under $100k (phasing out to $0 by $150k); unused losses carry forward. On sale, claimed depreciation is recaptured at up to 25%, and gains may owe capital-gains tax (a 1031 exchange can defer both). Figures are a year-1 estimate at your 24.0% rate — not tax advice; consult a CPA.
Condition & rehab AI · 12 photos
This upper-level condo is in good condition with fresh paint and minimal maintenance needed. It offers a good starting point for cosmetic updates to enhance its value.
Value-add opportunities
- Both Painting exterior and interior walls — Fresh paint enhances curb appeal and interior aesthetics
- Both Landscaping and curb appeal improvements — Enhances curb appeal and can attract more buyers
- Both New flooring in kitchen and bathrooms — Modern flooring can increase both resale and rental value
Renovation cost estimate screening
Value-add ROI direction
- Both Painting exterior and interior walls — Fresh paint enhances curb appeal and interior aesthetics ↑
- Both Landscaping and curb appeal improvements — Enhances curb appeal and can attract more buyers ↑
- Both New flooring in kitchen and bathrooms — Modern flooring can increase both resale and rental value ↑
ⓘ Cost ranges are severity-bucket heuristics (US national rule-of-thumb). Get contractor quotes + a written scope before underwriting a rehab budget.
Schools (NCES district)
- District
- Tucson Unified District (4403)
- NCES district ID
- 0408800
- Math proficiency
- 14% ▼ -17.00%
- Reading proficiency
- 23% ▼ -11.00%
- Median HH income
- $40,962
- Composite
- 15.78/100
- National rank
- #9270
- State rank
- #190 of 249 in AZ
Livability — Tucson
- Score
- 74/100
- State rank
- #17
- US rank
- #4502
Category grades
Schools grade is shown separately in the Schools card above.
Census & demographics
- Census place
- Tucson, AZ
- County
- Pima County · 1,012,107 people
- City population
- 839,336
- Metro
- Tucson, AZ
- Population (ZIP)
- 42,835
- Household income
- $68,903
- Rent vs Own
- Severe rent burden
- 1050.0
Population outlook (Pima County) Hauer SSP2
- Today (2025)
- 1,066,056 people
- By 2030
- 1,086,684 · +1.9%
- By 2040
- 1,117,160 · +4.8%
- By 2050
- 1,149,778 · +7.9%
- By 2075
- 1,271,480 · +19.3%
- By 2100
- 1,321,160 · +23.9%
Race, ethnicity, and origin ACS 2023
- Neighborhood character
- Predominantly Hispanic (72%)
- Race & ethnicity
- Hispanic / Latino 72% White 20% Two or more races 16% Native American 6% Black 2% Asian 1%
- Hispanic origin (detail)
- Mexican 68% Puerto Rican 1%
- Common ancestry
- Serbian 1% Lithuanian 1% Slovak 1%
- Foreign-born
- 16% · Canada
- Languages at home
- 52% English-only · Spanish 46%
Political lean MEDSL · Pima
- 2024 margin
- D (+15.2) · D 57.0% · R 41.8% · Other 1.2%
- 2008→2024 swing
- +9.1pp toward D · 2008: 6.1pp · 2024: 15.2pp
- All cycles
- 2024: D+15.2 2020: D+18.7 2016: D+13.5 2012: D+5.8 2008: D+6.1
Not yet ingested
- Civics
- —
Market trends
- HPI YoY
- ▼ -56.03%
- Current HPI
- 312.2096
- Rent YoY
- ▼ -0.25%
- Metro
- Tucson, AZ
- State GDP YoY
- ▲ 4.54%
- F500 in state
- 20
Industry mix (Fortune 500 HQ in AZ)
| Industry | F500 HQs | Revenue |
|---|---|---|
| Technology | 2 | $13B |
|
||
| Mining / Metals | 1 | $23B |
|
||
| Environmental Services | 1 | $16B |
|
||
| Metals / Steel | 1 | $14B |
|
||
| Technology Distribution | 1 | $9B |
|
||
| Homebuilding | 1 | $8B |
|
||
Price history
+160.5% since first listed11 events — show timeline
- 2026-01-23 Listed $130,000 MLSSAZ
- 2026-01-22 Listing Removed — MLSSAZ
- 2025-12-16 Price Changed $135,000 MLSSAZ
- 2025-12-16 Relisted — MLSSAZ
- 2025-12-14 Price Changed $138,000 MLSSAZ
- 2025-12-14 Contingent — MLSSAZ
- 2025-11-21 Price Changed $135,000 MLSSAZ
- 2025-09-26 Price Changed $140,000 MLSSAZ
- 2025-08-20 Listed $150,000 MLSSAZ
- 1998-05-06 Sold (MLS) $49,900 MLSSAZ
- 1998-03-24 Listed $49,900 MLSSAZ
Cash-flow waterfall
monthlySold comps — $/sqft
last 12 mo · ≤1 miLoading sold comps…