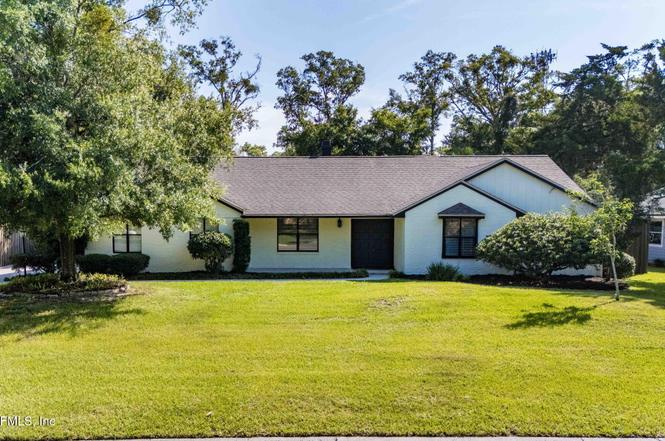
2822 Circle Ridge Dr · Lakeside, FL
Flood risk 1/10 · Minimal
- FEMA flood zone
- X (unshaded)
- Chance of flooding over 30 yrs
- 0.0%
- Est. flood insurance / yr
- $507 – $1,088
Fire risk 3/10 · Minor
- Est. fire insurance / yr
- $947 – $1,759
Heat risk 9/10 · Severe
- Hot days now (above 107°F)
- 7 days/yr
- Hot days in 30 yrs
- 20 days/yr
Wind risk 10/10 · Severe
- Chance of severe wind over 30 yrs
- 99.0%
Air-quality risk 3/10 · Minor
- Unhealthy air days now
- 3 days/yr
- Unhealthy air days in 30 yrs
- 3 days/yr
Risk factors via First Street. Map © Google.
Why this score? — see what drove the D+ grade
The composite is a weighted blend of 9 inputs, each scored 0–100. Each bar is that input's sub-score; the figure is the points it added to the 100-point composite (weight × sub-score).
- ARV discount +15.0/15.0
- Cash flow +13.2/30.0
- Schools +5.1/10.0
- DSCR +4.0/10.0
- Rent growth +3.4/5.0
- Livability +3.4/5.0
- 1% rule +2.9/10.0
- Condition / age +2.5/5.0
- Appreciation +0.0/10.0
$335,000
🖨 Deal sheet (PDF) 📄 Offer letter ✓ Due diligence
Listing remarks MLS
Ranch style, All brick,screen pation, in ground pool, detached game room,building, fireplace, skylight. Selling as, where is. Seller will not pay for a survey.
Key facts
- 0.36 acre lot
- 2 garage spots
- Pool
Property features AI
Finance
- HOA & community: Voluntary association with a $50 fee; association reports no amenities
Exterior
- Parking: 2-car garage; On-street parking; Additional/other parking
- Security: Smoke detectors
- Utilities: Public sewer; Water connected; Electricity connected; Cable connected; Sewer connected
- Home design: Single family residence; One level
- Construction: Brick construction; Shingle roof
- Exterior features: In-ground salt water private pool; Outdoor shower; Screened porch/patio; Wood privacy fencing in backyard; Shed(s)
Interior
- Kitchen: Dishwasher; Disposal; Electric cooktop; Electric oven; Microwave; Refrigerator; Electric water heater
- Bedrooms: 4 bedrooms
- Flooring: Carpet; Tile; Vinyl
- Bathrooms: 2 full bathrooms; 1 half bathroom
- Heating & cooling: Central heating; Central air conditioning
- Interior features: Breakfast bar; Eat-in kitchen; Entrance foyer; Primary bathroom with shower (no tub); Walk-in closet(s); Wood-burning fireplace
- Laundry & utility: Washer hookup; Electric dryer hookup; In-unit laundry
Neighborhood map
What this means for you Summary
Snapshot
- This is a 4-bed/2.5-bath single-family listed at $335k.
Deal economics
- At list price, monthly cash flow is $-8 ($-90/yr) — negative.
- To cash-flow at today's rent, offer at most $334k (0.4% below list).
- To meet the 1% rule (rent ≥ 1% of price), the offer needs to be $266k (20.7% below list).
- Recommended offer: $266k (20.7% below list) — sets the bar for 1% rule.
- Cap rate 6.3% vs local median 4.7% in Lakeside — top-decile yield for the area; either an underpriced asset or a hidden risk that comps aren't pricing in. Stress-test before assuming the spread holds.
Location & tenants
- Location reads 68/100 on livability (#505 in FL) — a middle-class / working-renter tenant base. Strengths: cost of living A+, housing A+, crime B; Watch: amenities F, commute F, health & safety F.
- Clay (suburban): math 58% / reading 59% proficiency, ranked #14 of 73 in FL (top 19%) — acceptable for families but not a draw, mixed tenant base, ~2y average lease.
- Zoned schools: Ridgeview Elementary School (math 59% / reading 64%, grade B, #634 of 2,144 statewide, top 30%, 588 students, 100% FRL); Orange Park Junior High School (math 38% / reading 45%, grade F, #348 of 571 statewide, top 62%, 744 students, 100% FRL); Ridgeview High School (math 41% / reading 53%, grade D-, #207 of 667 statewide, top 32%, 1,828 students, 46% FRL) — zoned schools average 82% FRL vs 35% district-wide (47 pts higher); higher-poverty schools than district average — tighter screening recommended.
- Market conditions: Rents rising (+3.7%/yr); 209 active listings in the ZIP; 2 comparable units currently listed for rent nearby; solid renter incomes; 1,876 units permitted in Clay County in 2024 (14 in 5+ unit buildings).
- This rent runs 33% of the median local income ($97k/yr) — at the standard rent-burdened threshold; future hikes will face affordability resistance.
Forward outlook
- Local home prices are declining (-3.0%/yr); year-one equity from $2k of loan paydown is wiped out by about $10k of value loss. Plan a longer hold.
- Clay County population projected at +19% by 2050 — long-run rental-demand tailwind backs the buy-and-hold thesis.
Negotiation context
- It's been on market 339 days — a 12% lower offer ($295k) is reasonable based on typical stale-listing flexibility.
- 10 sale attempts since 21y ago; this cycle's ask has dropped $140k (29%) from the opening price — seller is motivated, your offer sets the floor, not the list.
- Current owner paid $230k; 46% above their basis — modest negotiation headroom, anchor on the comps not their cost.
Risks & watch-outs
- Climate carrying-cost: severe wind risk, 99% chance of damaging wind over 30y; extreme-heat days projected 7→20/yr by 2055 (HVAC capex compounding) — expect insurance premiums to compound above CPI over the hold.
Questions for the listing agent
- What do current leases actually rent for vs. the listed asking? Can we see a recent rent roll and the last 12 months of T-12 income?
- It's been on market 339 days. Have you received any prior offers? Is the seller open to a 21% concession, seller financing, or rate buy-down credit?
- Why hasn't it sold? Are there any deal-killer items the seller is aware of (foundation, flood, title, zoning, code violations)?
- Is there a deadline driving the sale (1031 exchange, divorce, estate, relocation)? That informs how much negotiation room exists.
- Schools are B-rated — typically a magnet for longer-tenancy family renters. What's the average tenant stay here, and is there a school-zone premium baked into asking?
- The area grade is low — what's the realistic commute time and amenity access for the typical tenant pool here? Any planned neighborhood developments (good or bad) we should know about?
- What's the average days-on-market for RENTAL listings here right now (not sales)? A rising rental-DOM trend means longer vacancies and softer asking-rent achievability than the comps imply.
- What's the recent tenant-quality profile in this submarket — average credit score on applications, eviction rate, late-payment / NSF rate, and stable-employment percentage? A property-management company in the area should have these aggregated.
- How much new for-sale + rental construction is in the pipeline within 1–3 miles? Heavy new supply typically softens prices + rents 12–24 months out; constrained supply supports both.
Investment metrics
- 1% rule
- 0.79% ✗
- Cap rate
- 6.27%
- Cash-on-cash
- -0.10%
- DSCR
- 1.00
- GRM
- 10.5
CMA / ARV
- ARV (on-the-fly)
- $459,525
- Comps found
- 11
Show comp detail 11 sales within ~0.75 mi
| Address | Dist | Beds/Ba | Sqft | Sold | Price | $/sf | Match |
|---|---|---|---|---|---|---|---|
| 2911 Circle Ridge Dr | 0.08mi | 4/3.0 | 2,568 (-8%) | 8mo | $425,000 | $165 | 75 |
| 2816 Circle Ridge Dr | 0.04mi | 4/2.5 | 2,454 (-12%) | 23mo | $385,000 | $157 | 59 |
| 2305 Locustwood Ct | 0.43mi | 5/2.5 (+1) | 2,635 (-5%) | 9mo | $427,000 | $162 | 58 |
| 2849 Circle Ridge Dr | 0.24mi | 4/3.0 | 3,003 (+8%) | 20mo | $460,000 | $153 | 58 |
| 2453 Charwood Ct | 0.50mi | 5/3.5 (+1) | 2,648 (-5%) | 3mo | $475,000 | $179 | 57 |
| 2852 Circle Ridge Dr | 0.26mi | 5/3.0 (+1) | 2,434 (-13%) | 8mo | $460,000 | $189 | 53 |
| 2368 Stonebridge Dr | 0.36mi | 4/2.0 | 2,498 (-10%) | 16mo | $470,000 | $188 | 51 |
| 2896 Circle Ridge Dr | 0.19mi | 4/2.5 | 2,424 (-13%) | 23mo | $420,000 | $173 | 50 |
| 3187 Bliss Rd | 0.65mi | 4/2.0 | 2,700 (-3%) | 15mo | $550,000 | $204 | 50 |
| 1064 Amber Ct | 0.52mi | 5/4.0 (+1) | 2,992 (+7%) | 16mo | $386,000 | $129 | 39 |
| 804 Oliver Ellsworth St | 0.49mi | 3/2.0 (-1) | 2,386 (-14%) | 14mo | $390,000 | $163 | 34 |
Match score weights: distance 35% · size 25% · config 20% · recency 20%. Top-matched comps best support the ARV.
Projected returns pro-forma
-3.0% appreciation · 3.73% rent growth · sell at horizon
- IRR
- -15.8%
- Equity multiple
- 0.44×
- Total profit
- $-52,887
- Equity at exit
- $49,950
- IRR
- -6.3%
- Equity multiple
- 0.59×
- Total profit
- $-38,843
- Equity at exit
- $28,965
Cash invested: $93,800 (down + closing). Projections, not guarantees.
Landlord ↔ Tenant lean methodology
- Overall (STATE)
- 87 Strongly Landlord-Friendly
- State Florida
- 87 Strongly Landlord-Friendly · R+3
- County
- — inherits STATE
- City
- — inherits STATE
ZIP-level market 32065
- Home prices YoY
- -25.6%
- Rents YoY
- 3.7%
- Active inventory
- 209
- Price-to-rent
- 10.5×
Monthly cashflow live
- Estimated rent
- $2,657 medium interval (Pro) →
- Mortgage (P&I)
- −$1,757
- Tax from tax record
- −$210 /mo · $2,522/yr
- Insurance
- −$140
- HOA
- −$0
- Vacancy / Maint / Mgmt
- −$558
- Net cashflow
- $-8
Break-even live
Sensitivity live
| Price | -10% $182 | -5% $87 | +0% $-8 | +5% $-102 | +10% $-197 |
|---|---|---|---|---|---|
| Rent | -10% $-217 | -5% $-112 | +0% $-8 | +5% $97 | +10% $202 |
| Rate | -1.0pp $161 | -0.5pp $78 | base $-8 | +0.5pp $-94 | +1.0pp $-183 |
UW: 25.0% down · 7.5% · 30yr · 1.5% tax · 5.0% vac · 8.0% maint · 8.0% mgmt
Financing live
Cash to close
- Down payment
- $83,750
- Closing costs
- $10,050
- Reserves months
- —
- Total cash needed
- —
Loan-product check · same deal, 3 products live
Conventional
25% down · 7.5% · 30yr
- Down + closing
- —
- Monthly P&I
- —
- Monthly cashflow
- —
- DSCR
- —
- Eligible?
- —
Personal DTI + credit; lowest rate.
DSCR
20% down · 8.5% · 30yr
- Down + closing
- —
- Monthly P&I
- —
- Monthly cashflow
- —
- DSCR
- —
- Eligible?
- —
No personal income docs; deal must DSCR.
Hard money
10% down · 12.0% · 12mo
- Down + closing
- —
- Monthly P&I
- —
- Monthly cashflow
- —
- DSCR
- —
- Eligible?
- —
Short-term bridge; refi at stabilization.
Rent comps 2 comps
| Address | Beds | Baths | Sqft | Rent | $/sqft | DOM | Units | Dist |
|---|---|---|---|---|---|---|---|---|
| 3150 Highland Grove Dr Orange Park, FL | 4.0 | 3.0 | 1987 | $2,300 | $1.16 | 12d | 1 | 0.56mi |
| 1959 Sussex Dr N Orange Park, FL | 4.0 | 2.0 | 2022 | $2,475 | $1.22 | 16d | 1 | 1.48mi |
Listing history 50 events
-
2026-06-21days on market $335,000 Active 339 DOM
-
2026-06-18days on market $335,000 Active 336 DOM
-
2026-06-17days on market $335,000 Active 335 DOM
-
2026-06-16days on market $335,000 Active 334 DOM
-
2026-06-15days on market $335,000 Active 333 DOM
-
2026-06-13days on market $335,000 Active 331 DOM
-
2026-06-13days on market $335,000 Active 330 DOM
-
2026-06-09days on market $335,000 Active 327 DOM
-
2026-06-08days on market $335,000 Active 326 DOM
-
2026-06-07days on market $335,000 Active 325 DOM
-
2026-06-03days on market $335,000 Active 321 DOM
-
2026-06-02days on market $335,000 Active 320 DOM
-
2026-06-01days on market $335,000 Active 319 DOM
-
2026-05-31days on market $335,000 Active 318 DOM
-
2026-05-19price $335,000
-
2026-05-07price $345,000
-
2026-04-20status Active
-
2026-04-20price $352,000
-
2026-04-06historical Active Under Contract
-
2026-03-18price $362,000
-
2026-03-11price $372,000
-
2026-02-22status Active
-
2026-02-07historical Active Under Contract
-
2026-02-02status Active
-
2026-01-25historical Active Under Contract
-
2026-01-16price $382,000
-
2026-01-08status Active
-
2026-01-08price $389,000
-
2025-12-27historical
-
2025-12-23status Active
-
2025-12-11historical Active Under Contract
-
2025-11-25price $399,000
-
2025-11-15price $409,000
-
2025-10-26price $415,000
-
2025-09-25price $430,000
-
2025-08-25price $440,000
-
2025-08-08price $460,000
-
2025-08-02price $470,000
-
2025-07-05$475,000 Active
-
2007-09-07historical 159-char remark
Show marketing remark (159 chars)
Ranch style, All brick,screen pation, in ground pool, detached game room,building, fireplace, skylight. Selling as, where is. Seller will not pay for a survey.
-
2007-08-31soldstatus $230,000 159-char remark
Show marketing remark (159 chars)
Ranch style, All brick,screen pation, in ground pool, detached game room,building, fireplace, skylight. Selling as, where is. Seller will not pay for a survey.
-
2007-02-06$259,900 159-char remark
Show marketing remark (159 chars)
Ranch style, All brick,screen pation, in ground pool, detached game room,building, fireplace, skylight. Selling as, where is. Seller will not pay for a survey.
-
2006-09-12historical 313-char remark
Show marketing remark (313 chars)
Priced below appraisal. All brk, beautiful inground pool 19x36, game rm, eat-in kit., breakfast bar, lrg grt.rm.,w/stone fireplace, skylights. Loft in 1 bdrm., gamerm attached by breezeway. SqFt. includes game rm. Freshly painted interior, lrg screened porch overlooking pool. All areas tiled except bdrms, baths.
-
2006-06-14$289,900 313-char remark
Show marketing remark (313 chars)
Priced below appraisal. All brk, beautiful inground pool 19x36, game rm, eat-in kit., breakfast bar, lrg grt.rm.,w/stone fireplace, skylights. Loft in 1 bdrm., gamerm attached by breezeway. SqFt. includes game rm. Freshly painted interior, lrg screened porch overlooking pool. All areas tiled except bdrms, baths.
-
2006-06-11historical
-
2006-01-13$295,000
-
2005-09-30soldstatus $279,900
-
2005-09-13historical
-
2005-09-12soldstatus $279,900
-
2005-08-04$279,900
ⓘ Source: listings_history table (triggers on properties + properties_extension) + one-shot
backfill from property_details.listing_events for pre-trigger history.
Tax reassessment forecast FL · Resets to sale price
- Current annual tax
- $2,522 · $210/mo
- Projected year-2 tax
- $2,780 · $232/mo
- Expected delta
- +$258/yr (+$22/mo · 10.2%)
ⓘ Screening estimate from a state-policy table — verify with the county assessor before closing.
Climate risk First Street
- Flood 1/10 Low FEMA zone X (unshaded) · 0% chance over 30 yrs
- Wildfire 3/10 Moderate
- Heat 9/10 Extreme 7 d/yr ≥107°F today · 20 d/yr by 30 yrs out
- Wind 10/10 Extreme 99% chance of damaging wind over 30 yrs
- Air quality 3/10 Moderate 3 unhealthy d/yr today · 3 by 30 yrs out
Nearby sold comps map
Loading sold comps map…
Walkable amenities ~0.75 mi
Loading nearby amenities…
Taxation est. · year 1
- Rental income
- $31,883
- − Mortgage interest
- −$18,765
- − Property taxes
- −$2,522
- − Insurance
- −$1,675
- − Repairs & maintenance
- −$2,551
- − Management
- −$2,551
- − Depreciation
- −$9,745
- Taxable loss
- −$5,926
- Est. tax savings @ 24.0%
- +$1,422
- After-tax cash flow
- $1,332/yr
For passive investors: Depreciation is non-cash, so a rental often shows a tax loss while cash-flowing — sheltering income. Rental losses are passive: they offset passive income freely, and up to $25,000/yr can offset ordinary (W-2) income if you actively participate and your MAGI is under $100k (phasing out to $0 by $150k); unused losses carry forward. On sale, claimed depreciation is recaptured at up to 25%, and gains may owe capital-gains tax (a 1031 exchange can defer both). Figures are a year-1 estimate at your 24.0% rate — not tax advice; consult a CPA.
Schools (NCES district)
- District
- Clay
- NCES district ID
- 1200300
- Math proficiency
- 58% ▼ -8.00%
- Reading proficiency
- 59% ▼ -3.00%
- Median HH income
- $59,379
- Composite
- 50.73/100
- National rank
- #1815
- State rank
- #14 of 73 in FL
Livability — Lakeside
- Score
- 68/100
- State rank
- #505
- US rank
- #9341
Category grades
Schools grade is shown separately in the Schools card above.
Census & demographics
- Census place
- Lakeside, FL
- County
- Clay County · 208,450 people
- Metro
- Jacksonville, FL
- Population (ZIP)
- 41,578
- Household income
- $97,455
- Rent vs Own
- Severe rent burden
- 1129.0
Population outlook (Clay County) Hauer SSP2
- Today (2025)
- 230,495 people
- By 2030
- 242,427 · +5.2%
- By 2040
- 262,244 · +13.8%
- By 2050
- 275,148 · +19.4%
- By 2075
- 295,397 · +28.2%
- By 2100
- 287,592 · +24.8%
Race, ethnicity, and origin ACS 2023
- Neighborhood character
- Diverse neighborhood (Simpson 0.67)
- Race & ethnicity
- White 51% Black 20% Hispanic / Latino 15% Two or more races 15% Asian 6%
- Hispanic origin (detail)
- Mexican 3% Puerto Rican 5% Cuban 3%
- Common ancestry
- Lithuanian 4% Romanian 2% Portuguese 2%
- Foreign-born
- 8% · Canada, China
- Languages at home
- 88% English-only · Spanish 7% Tagalog/Filipino 3% Other Asian/Pacific 1%
Political lean MEDSL · Clay
- 2024 margin
- Solid R (+39.3) · D 29.9% · R 69.2%
- 2008→2024 swing
- +3.6pp toward D · 2008: -42.8pp · 2024: -39.3pp
- All cycles
- 2024: R+39.3 2020: R+37.1 2016: R+44.3 2012: R+45.8 2008: R+42.8
Not yet ingested
- Civics
- —
Market trends
- HPI YoY
- ▼ -95.13%
- Current HPI
- 276.5987
- Rent YoY
- ▲ 3.73%
- Metro
- Jacksonville, FL
- State GDP YoY
- ▲ 3.28%
- F500 in state
- 36
Industry mix (Fortune 500 HQ in FL)
| Industry | F500 HQs | Revenue |
|---|---|---|
| Industrial Technology | 2 | $29B |
|
||
| Insurance | 2 | $17B |
|
||
| Retail | 1 | $60B |
|
||
| Technology Distribution | 1 | $58B |
|
||
| Homebuilding | 1 | $35B |
|
||
| Technology Manufacturing | 1 | $35B |
|
||
Price history
+162.7% since first listed38 events — show timeline
- 2026-05-19 Price Changed $335,000 realMLS
- 2026-05-07 Price Changed $345,000 realMLS
- 2026-04-20 Relisted — realMLS
- 2026-04-20 Price Changed $352,000 realMLS
- 2026-04-06 Contingent — realMLS
- 2026-03-18 Price Changed $362,000 realMLS
- 2026-03-11 Price Changed $372,000 realMLS
- 2026-02-22 Relisted — realMLS
- 2026-02-07 Contingent — realMLS
- 2026-02-02 Relisted — realMLS
- 2026-01-25 Contingent — realMLS
- 2026-01-16 Price Changed $382,000 realMLS
- 2026-01-08 Relisted — realMLS
- 2026-01-08 Price Changed $389,000 realMLS
- 2025-12-27 Listing Removed — realMLS
- 2025-12-23 Relisted — realMLS
- 2025-12-11 Contingent — realMLS
- 2025-11-25 Price Changed $399,000 realMLS
- 2025-11-15 Price Changed $409,000 realMLS
- 2025-10-26 Price Changed $415,000 realMLS
- 2025-09-25 Price Changed $430,000 realMLS
- 2025-08-25 Price Changed $440,000 realMLS
- 2025-08-08 Price Changed $460,000 realMLS
- 2025-08-02 Price Changed $470,000 realMLS
- 2025-07-05 Listed $475,000 realMLS
- 2007-09-07 Listing Removed — realMLS
- 2007-08-31 Sold (MLS) $230,000 realMLS
- 2007-02-06 Listed $259,900 realMLS
- 2006-09-12 Listing Removed — realMLS
- 2006-06-14 Listed $289,900 realMLS
- 2006-06-11 Listing Removed — realMLS
- 2006-01-13 Listed $295,000 realMLS
- 2005-09-30 Sold (Public Records) $279,900 Public Records
- 2005-09-13 Listing Removed — realMLS
- 2005-09-12 Sold (MLS) $279,900 realMLS
- 2005-08-04 Listed $279,900 realMLS
- 2001-07-24 Sold (Public Records) $160,000 Public Records
- 1994-05-12 Sold (Public Records) $127,500 Public Records
Property tax history
+2.6%/yrLatest (2025): $2,522 · +4.3% YoY. Source: county tax records.
Cash-flow waterfall
monthlySold comps — $/sqft
last 12 mo · ≤1 miLoading sold comps…