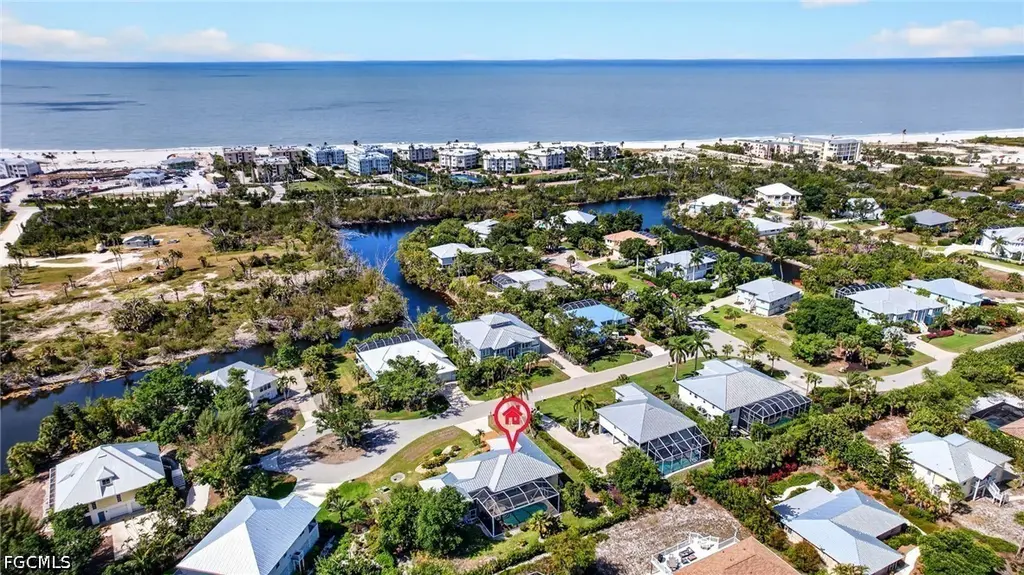
3359 Barra Cir · Sanibel, FL
Flood risk 9/10 · Severe
- FEMA flood zone
- AE
- Chance of flooding over 30 yrs
- 0.99%
- Est. flood insurance / yr
- $1,737 – $8,500
Fire risk 2/10 · Minimal
- Est. fire insurance / yr
- $947 – $1,759
Heat risk 10/10 · Severe
- Hot days now (above 112°F)
- 7 days/yr
- Hot days in 30 yrs
- 25 days/yr
Wind risk 10/10 · Severe
- Chance of severe wind over 30 yrs
- 99.0%
Air-quality risk 2/10 · Minimal
- Unhealthy air days now
- 1 days/yr
- Unhealthy air days in 30 yrs
- 1 days/yr
Risk factors via First Street. Map © Google.
Why this score? — see what drove the B- grade
The composite is a weighted blend of 9 inputs, each scored 0–100. Each bar is that input's sub-score; the figure is the points it added to the 100-point composite (weight × sub-score).
- Cash flow +30.0/30.0
- 1% rule +10.0/10.0
- DSCR +10.0/10.0
- ARV discount +7.5/15.0
- Schools +4.1/10.0
- Livability +3.4/5.0
- Rent growth +2.5/5.0
- Condition / age +2.5/5.0
- Appreciation +0.0/10.0
$1,075,000
🖨 Deal sheet (PDF) 📄 Offer letter ✓ Due diligence
Listing remarks MLS
Charming and welcoming traditional Island home on Sanibel’s quiet West end. This partially raised Michigan home has been totally remodeled and features three spacious bedrooms including a master suite addition, three baths, soaring ceilings in the Gathering room and dining room. The fireplace offers ambiance and romance for cool tropical evenings; a large lanai carries the openness of the home outside to the heated swimming pool. The kitchen is a chef’s delight and the eat-in feature allows this to be the heart of the home. Model-like condition and decorator appointed the home has been loved by the Sellers. The spacious lanai looks over the screen enclosed pool and the grounds offering privacy and quietude. A short walk to the deeded beach access, 3359 Barra Circle shows like a model.
Key facts
- Quality appliances
- Private pool
- Outdoor living areas
Tags
Property features AI
Finance
- Other: Private heated in-ground pool with electric heat, pool equipment and screen enclosure; Lot is rectangular on a cul-de-sac with automatic sprinklers and paved road access; Lot exposures: North; Lot dimensions approx. 118 x 126 x 116 x 90
- Financial info: Pets allowed
- HOA & community: Homeowners association with $100 annual fee; Association covers legal/accounting, recreation facilities, reserve fund, and road maintenance; Community offers beach rights and beach access; Non-gated community
Exterior
- Parking: Attached garage with garage door opener; 2 covered garage spaces
- Security: Smoke detectors; Security/high impact doors
- Utilities: Public water; Public sewer; Cable available
- Home design: Single-story home; Faces south; Resale property; Pillar/post/pier raised foundation
- Construction: Stucco and wood frame construction; Metal roof; Built on raised pillar/post/pier foundation
- Exterior features: Security/high impact doors; Sprinkler/irrigation system; Patio; Shutters (electric and manual); Lanai; Screened patio/porch; Porch; Smoke detector(s)
Interior
- Kitchen: Dishwasher; Disposal; Icemaker; Microwave; Range; Refrigerator; Refrigerator with ice maker
- Bedrooms: Split bedroom floor plan
- Flooring: Tile; Vinyl
- Bathrooms: 3 full bathrooms
- Heating & cooling: Central heating (electric); Central air conditioning (electric); Ceiling fans
- Interior features: High ceilings; Living/dining room; Tub with shower; Cable TV; Split bedrooms; Impact glass windows; Unfurnished
- Laundry & utility: Washer; Dryer; Indoor laundry
Neighborhood map
What this means for you Summary
Snapshot
- This is a 3-bed/3.0-bath single-family listed at $1.07M.
Deal economics
- At list price, monthly cash flow is $6k ($68k/yr) — positive.
- The deal already cash-flows at list — no discount required.
- Meets the 1% rule at list price ($16k rent vs $1.07M).
- Recommended offer: $1.06M (1.5% below list) — sets the bar for market timing.
- Cap rate 13.1% vs local median 3.8% in Sanibel — top-decile yield for the area; either an underpriced asset or a hidden risk that comps aren't pricing in. Stress-test before assuming the spread holds.
Location & tenants
- Location reads 67/100 on livability (#541 in FL) — a middle-class / working-renter tenant base. Strengths: crime A+, employment A+; Watch: housing D+, amenities F, commute F.
- Lee (suburban): math 47% / reading 50% proficiency, ranked #42 of 73 in FL (top 58%) — families likely to look elsewhere, expect single-tenant / working-renter base with shorter leases.
- Zoned schools: The Sanibel School (math 92% / reading 92%, grade A+, #5 of 2,144 statewide, top 0%, 289 students, 12% FRL); South Fort Myers High School (math 23% / reading 30%, grade F, #489 of 667 statewide, top 74%, 1,917 students, 50% FRL) — zoned schools average 31% FRL vs 57% district-wide (26 pts lower); this property's tenant base skews higher-income than the district average.
- Market conditions: 526 active listings in the ZIP; 4 comparable units currently listed for rent nearby; rentals at typical pace (median 26d on market — plan ~3-4 weeks tenant-placement turnaround); 15,411 units permitted in Lee County in 2024 (4,686 in 5+ unit buildings).
Forward outlook
- Local home prices are declining (-3.0%/yr); year-one equity from $7k of loan paydown is wiped out by about $32k of value loss. Plan a longer hold.
- Lee County population projected at +44% by 2050 — long-run rental-demand tailwind backs the buy-and-hold thesis.
- At projected returns (-3.0% appreciation + 3.0% rent growth), your $301k cash investment doubles in ~6 years — after that, you're playing with house money.
Negotiation context
- It's been on market 20 days — a 2% lower offer ($1.06M) is reasonable based on typical stale-listing flexibility.
- 2 sale attempts since 9y ago with the ask held roughly flat each time — persistent listings suggest the price (not the market) is what's stuck; bring a comps-based counter.
- Current owner paid $779k; 38% above their basis — modest negotiation headroom, anchor on the comps not their cost.
Risks & watch-outs
- Watch-outs: flood insurance adds $427/mo.
- Climate carrying-cost: in FEMA flood zone AE (mandatory federal flood insurance); severe wind risk, 99% chance of damaging wind over 30y; extreme-heat days projected 7→25/yr by 2055 (HVAC capex compounding) — expect insurance premiums to compound above CPI over the hold.
Questions for the listing agent
- What's the actual annual flood-insurance premium (NFIP or private), and is the property in a SFHA with mandatory coverage?
- What does the HOA fee cover, when was the last increase, and are there any pending special assessments or reserve-fund shortfalls?
- Is there a deadline driving the sale (1031 exchange, divorce, estate, relocation)? That informs how much negotiation room exists.
- Schools are A-rated — typically a magnet for longer-tenancy family renters. What's the average tenant stay here, and is there a school-zone premium baked into asking?
- What's the average days-on-market for RENTAL listings here right now (not sales)? A rising rental-DOM trend means longer vacancies and softer asking-rent achievability than the comps imply.
- What's the recent tenant-quality profile in this submarket — average credit score on applications, eviction rate, late-payment / NSF rate, and stable-employment percentage? A property-management company in the area should have these aggregated.
- How much new for-sale + rental construction is in the pipeline within 1–3 miles? Heavy new supply typically softens prices + rents 12–24 months out; constrained supply supports both.
Investment metrics
- 1% rule
- 1.52% ✓
- Cap rate
- 13.05%
- Cash-on-cash
- 24.14%
- DSCR
- 2.07
- GRM
- 5.5
CMA / ARV
No comps found within radius.
Projected returns pro-forma
-3.0% appreciation · 3.0% rent growth · sell at horizon
- IRR
- 15.3%
- Equity multiple
- 1.61×
- Total profit
- $184,417
- Equity at exit
- $160,286
- IRR
- 23.9%
- Equity multiple
- 3.07×
- Total profit
- $622,803
- Equity at exit
- $92,946
Cash invested: $301,000 (down + closing). Projections, not guarantees.
Landlord ↔ Tenant lean methodology
- Overall (STATE)
- 87 Strongly Landlord-Friendly
- State Florida
- 87 Strongly Landlord-Friendly · R+3
- County
- — inherits STATE
- City
- — inherits STATE
ZIP-level market 33957
- Home prices YoY
- -15.7%
- Active inventory
- 526
- Price-to-rent
- 5.5×
Monthly cashflow live
- Estimated rent
- $16,349 medium interval (Pro) →
- Mortgage (P&I)
- −$5,637
- Tax from tax record
- −$768 /mo · $9,214/yr
- Insurance
- −$448
- Flood insurance flood zone
- −$427 /mo · $5,118/yr
- HOA
- −$8
- Vacancy / Maint / Mgmt
- −$3,433
- Net cashflow
- $5,628
Break-even live
Sensitivity live
| Price | -10% $6,237 | -5% $5,932 | +0% $5,628 | +5% $5,324 | +10% $5,020 |
|---|---|---|---|---|---|
| Rent | -10% $4,336 | -5% $4,982 | +0% $5,628 | +5% $6,274 | +10% $6,920 |
| Rate | -1.0pp $6,169 | -0.5pp $5,901 | base $5,628 | +0.5pp $5,349 | +1.0pp $5,066 |
UW: 25.0% down · 7.5% · 30yr · 1.5% tax · 5.0% vac · 8.0% maint · 8.0% mgmt
Financing live
Cash to close
- Down payment
- $268,750
- Closing costs
- $32,250
- Reserves months
- —
- Total cash needed
- —
Loan-product check · same deal, 3 products live
Conventional
25% down · 7.5% · 30yr
- Down + closing
- —
- Monthly P&I
- —
- Monthly cashflow
- —
- DSCR
- —
- Eligible?
- —
Personal DTI + credit; lowest rate.
DSCR
20% down · 8.5% · 30yr
- Down + closing
- —
- Monthly P&I
- —
- Monthly cashflow
- —
- DSCR
- —
- Eligible?
- —
No personal income docs; deal must DSCR.
Hard money
10% down · 12.0% · 12mo
- Down + closing
- —
- Monthly P&I
- —
- Monthly cashflow
- —
- DSCR
- —
- Eligible?
- —
Short-term bridge; refi at stabilization.
Rent comps 4 comps
| Address | Beds | Baths | Sqft | Rent | $/sqft | DOM | Units | Dist |
|---|---|---|---|---|---|---|---|---|
| 707 Durion Ct Sanibel, FL | 3.0 | 2.5 | 1306 | $12,000 | $9.19 | 25d | 1 | 1.11mi |
| 548 Boulder Dr Sanibel, FL | 3.0 | 3.0 | 1969 | $6,500 | $3.30 | 25d | 1 | 1.11mi |
| 2445 W Gulf Dr Unit 47B Sanibel, FL | 2.0 | 2.0 | 1243 | $20,000 | $16.09 | 25d | 1 | 1.26mi |
| 2445 W Gulf Dr Unit 32E Sanibel, FL | 2.0 | 2.0 | 1243 | $18,000 | $14.48 | 25d | 1 | 1.34mi |
HOA detail
- Monthly dues
- $8 · $96/yr
- Likely covers
- landscapingpool
Listing history 13 events
-
2026-06-22days on market $1,075,000 Active 20 DOM
-
2026-06-18days on market $1,075,000 Active 17 DOM
-
2026-06-17days on market $1,075,000 Active 16 DOM
-
2026-06-16days on market $1,075,000 Active 15 DOM
-
2026-06-15days on market $1,075,000 Active 14 DOM
-
2026-06-13days on market $1,075,000 Active 12 DOM
-
2026-06-10days on market $1,075,000 Active 9 DOM
-
2026-06-09days on market $1,075,000 Active 8 DOM
-
2026-06-08days on market $1,075,000 Active 7 DOM
-
2026-06-07days on market $1,075,000 Active 6 DOM
-
2026-06-03days on market $1,075,000 Active 2 DOM
-
2026-06-02remarks 693-char remark
-
2026-06-02$1,075,000 Active 1 DOM
ⓘ Source: listings_history table (triggers on properties + properties_extension) + one-shot
backfill from property_details.listing_events for pre-trigger history.
Tax reassessment forecast FL · Resets to sale price
- Current annual tax
- $9,214 · $768/mo
- Projected year-2 tax
- $9,214 · $768/mo
- Expected delta
- $0/yr ($0/mo · 0.0%)
ⓘ Screening estimate from a state-policy table — verify with the county assessor before closing.
Climate risk First Street
- Flood 9/10 Extreme FEMA zone AE · 99% chance over 30 yrs
- Wildfire 2/10 Low
- Heat 10/10 Extreme 7 d/yr ≥112°F today · 25 d/yr by 30 yrs out
- Wind 10/10 Extreme 99% chance of damaging wind over 30 yrs
- Air quality 2/10 Low 1 unhealthy d/yr today · 1 by 30 yrs out
Nearby sold comps map
Loading sold comps map…
Walkable amenities ~0.75 mi
Loading nearby amenities…
Taxation est. · year 1
- Rental income
- $196,188
- − Mortgage interest
- −$60,217
- − Property taxes
- −$9,214
- − Insurance
- −$10,494
- − Repairs & maintenance
- −$15,695
- − Management
- −$15,695
- − HOA
- −$96
- − Depreciation
- −$31,273
- Taxable income
- $53,506
- Est. tax owed @ 24.0%
- −$12,841
- After-tax cash flow
- $54,695/yr
For passive investors: Depreciation is non-cash, so a rental often shows a tax loss while cash-flowing — sheltering income. Rental losses are passive: they offset passive income freely, and up to $25,000/yr can offset ordinary (W-2) income if you actively participate and your MAGI is under $100k (phasing out to $0 by $150k); unused losses carry forward. On sale, claimed depreciation is recaptured at up to 25%, and gains may owe capital-gains tax (a 1031 exchange can defer both). Figures are a year-1 estimate at your 24.0% rate — not tax advice; consult a CPA.
Schools (NCES district)
- District
- Lee
- NCES district ID
- 1201080
- Math proficiency
- 47% ▼ -11.00%
- Reading proficiency
- 50% ▼ -4.00%
- Median HH income
- $49,518
- Composite
- 41.49/100
- National rank
- #3458
- State rank
- #42 of 73 in FL
Livability — Sanibel
- Score
- 67/100
- State rank
- #541
- US rank
- #10166
Category grades
Schools grade is shown separately in the Schools card above.
Census & demographics
- Census place
- Sanibel, FL
- City population
- 6,402
- Population (ZIP)
- 6,402
Population outlook (Lee County) Hauer SSP2
- Today (2025)
- 871,946 people
- By 2030
- 955,468 · +9.6%
- By 2040
- 1,113,587 · +27.7%
- By 2050
- 1,256,891 · +44.1%
- By 2075
- 1,560,270 · +78.9%
- By 2100
- 1,726,848 · +98.0%
Race, ethnicity, and origin ACS 2023
- Neighborhood character
- Predominantly White (95%)
- Race & ethnicity
- White 95% Two or more races 2% Asian 1%
- Common ancestry
- Italian 4% Romanian 4% Slovak 2%
- Foreign-born
- 5% · Canada, China
- Languages at home
- 96% English-only · German/W. Germanic 1% Spanish 1% French/Haitian/Cajun 1%
Political lean MEDSL · Lee
- 2024 margin
- Strong R (+28.4) · D 35.5% · R 63.9%
- 2008→2024 swing
- -18.0pp toward R · 2008: -10.4pp · 2024: -28.4pp
- All cycles
- 2024: R+28.4 2020: R+19.2 2016: R+20.4 2012: R+16.6 2008: R+10.4
Not yet ingested
- Civics
- —
Market trends
- HPI YoY
- ▼ -93.08%
- Current HPI
- 501.0
- Rent YoY
- —
- Metro
- —
- State GDP YoY
- ▲ 3.28%
- F500 in state
- 36
Industry mix (Fortune 500 HQ in FL)
| Industry | F500 HQs | Revenue |
|---|---|---|
| Industrial Technology | 2 | $29B |
|
||
| Insurance | 2 | $17B |
|
||
| Retail | 1 | $60B |
|
||
| Technology Distribution | 1 | $58B |
|
||
| Homebuilding | 1 | $35B |
|
||
| Technology Manufacturing | 1 | $35B |
|
||
Price history
+6102.0% since first listed8 events — show timeline
- 2026-06-01 Listed $1,075,000 FORTMLS
- 2017-04-28 Sold (Public Records) $779,000 Public Records
- 2017-04-27 Sold (MLS) $779,000 FORTMLS
- 2017-03-27 Pending — FORTMLS
- 2017-02-07 Listed $789,000 FORTMLS
- 2005-07-11 Sold (Public Records) $575,000 Public Records
- 2000-06-02 Sold (Public Records) $263,500 Public Records
- 1981-06-01 Sold (Public Records) $17,333 Public Records
Property tax history
+2.7%/yrLatest (2025): $9,214 · +27.8% YoY. Source: county tax records.
Cash-flow waterfall
monthlySold comps — $/sqft
last 12 mo · ≤1 miLoading sold comps…