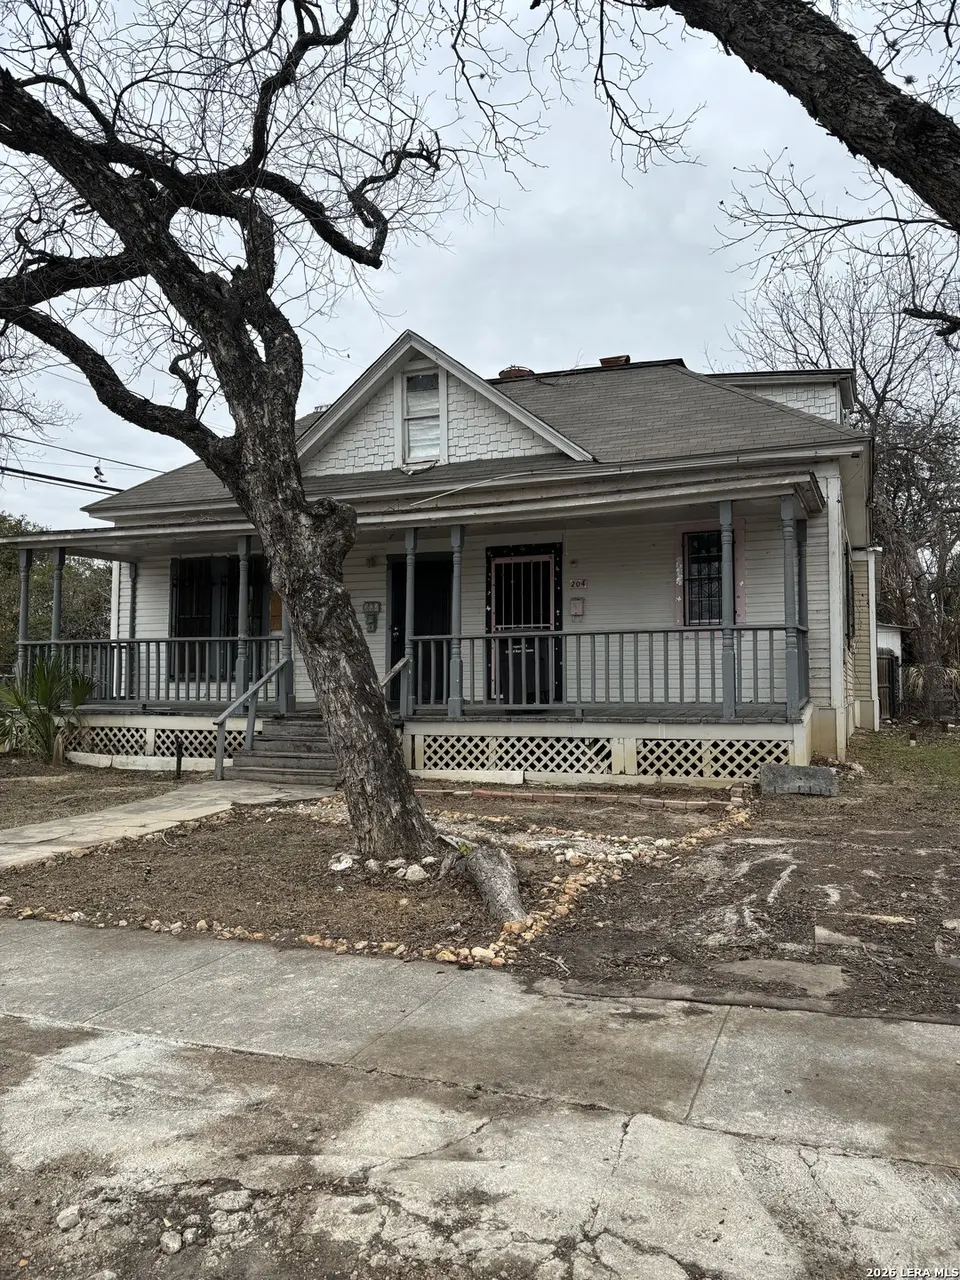
204 Piedmont · San Antonio, TX
Flood risk 1/10 · Minimal
- FEMA flood zone
- X (unshaded)
- Chance of flooding over 30 yrs
- 0.0%
- Est. flood insurance / yr
- $507 – $1,088
Fire risk 1/10 · Minimal
- Est. fire insurance / yr
- $1,222 – $2,270
Heat risk 8/10 · Major
- Hot days now (above 108°F)
- 7 days/yr
- Hot days in 30 yrs
- 20 days/yr
Wind risk 8/10 · Major
- Chance of severe wind over 30 yrs
- 80.0%
Air-quality risk 2/10 · Minimal
- Unhealthy air days now
- 1 days/yr
- Unhealthy air days in 30 yrs
- 2 days/yr
Risk factors via First Street. Map © Google.
Why this score? — see what drove the C+ grade
The composite is a weighted blend of 9 inputs, each scored 0–100. Each bar is that input's sub-score; the figure is the points it added to the 100-point composite (weight × sub-score).
- Cash flow +16.8/30.0
- ARV discount +15.0/15.0
- 1% rule +6.8/10.0
- Appreciation +5.7/10.0
- DSCR +5.2/10.0
- Rent growth +5.0/5.0
- Livability +4.0/5.0
- Condition / age +2.5/5.0
- Schools +1.4/10.0
$160,000
🖨 Deal sheet 📄 Offer letter ✓ Due diligence
Listing remarks MLS
**Investor Special** AS-SALE. Home is currently set up as a duplex with 1 bedroom and 1 bathroom on each side. Lot has been split in two using a condo regime. New survey is attached in documents. Offers will not be considered unless you have viewed and assessed the property. NO WHOLESALERS.
Key facts
- 4,399 sq ft lot
- Built 1910
- Listed 148 days
Neighborhood map
What this means for you Summary
Snapshot
- This is a 3-bed/2.0-bath single-family listed at $160k.
Deal economics
- At list price, monthly cash flow is $103 ($1k/yr) — positive.
- The deal already cash-flows at list — no discount required.
- Meets the 1% rule at list price ($2k rent vs $160k).
- Recommended offer: $141k (12.0% below list) — sets the bar for market timing.
- Cap rate 7.1% vs local median 3.8% in San Antonio — top-decile yield for the area; either an underpriced asset or a hidden risk that comps aren't pricing in. Stress-test before assuming the spread holds.
Location & tenants
- Location reads 80/100 on livability (#31 in TX, #1,616 nationally) — a professional / high-income tenant draw. Strengths: amenities A+, commute A+, cost of living A+; Watch: schools C-, crime F.
- San Antonio ISD (urban): math 12% / reading 22% proficiency, ranked #805 of 826 in TX (top 98%) — low school quality limits family demand, transient renter base, plan for 1-2y turnover; 80% free/reduced lunch — lower-income household profile, screen leases tightly.
- Market conditions: Rents rising fast (+10.9%/yr); 99 active listings in the ZIP; 40 comparable units currently listed for rent nearby; rentals at typical pace (median 24d on market — plan ~3-4 weeks tenant-placement turnaround); 40% of comp listings sitting > 30 days — soft ceiling on asking rent; lower-income renter base — watch delinquency; 8,308 units permitted in Bexar County in 2024 (2,506 in 5+ unit buildings).
- At $1,895/mo this rent would consume 64% of the median local household income ($36k/yr) (locally 470% of renters already pay >50% of income on rent) — very limited rent-growth headroom before tenants either downsize or default.
Forward outlook
- In year one you build about $3k of equity ($1k loan paydown + $2k appreciation (1.3% local appreciation)).
- Bexar County population projected at +50% by 2050 — long-run rental-demand tailwind backs the buy-and-hold thesis.
- At projected returns (1.3% appreciation + 8.0% rent growth), your $45k cash investment doubles in ~6 years — after that, you're playing with house money.
- By year 10, paydown + projected appreciation supports a ~$33k cash-out refi (75% LTV) — recoverable capital for the next deal without selling this one.
Negotiation context
- It's been on market 148 days — a 12% lower offer ($141k) is reasonable based on typical stale-listing flexibility.
Risks & watch-outs
- Watch-outs: property tax is 3.7% of price; built in 1910 — expect roof / HVAC / electrical / plumbing capex.
- Climate carrying-cost: severe wind risk, 80% chance of damaging wind over 30y; extreme-heat days projected 7→20/yr by 2055 (HVAC capex compounding) — expect insurance premiums to compound above CPI over the hold.
Questions for the listing agent
- It's been on market 148 days. Have you received any prior offers? Is the seller open to a 12% concession, seller financing, or rate buy-down credit?
- Built in 1910 — when were the roof, HVAC, electrical panel, plumbing, and water heater last replaced?
- Property tax is high relative to price — has the assessment been appealed recently, and will the sale trigger a re-assessment?
- Why hasn't it sold? Are there any deal-killer items the seller is aware of (foundation, flood, title, zoning, code violations)?
- Is there a deadline driving the sale (1031 exchange, divorce, estate, relocation)? That informs how much negotiation room exists.
- Crime grade is F in this area — have there been break-ins, vandalism, or insurance claims at this property in the last 3 years? What carrier currently insures it and at what premium?
- What's the average days-on-market for RENTAL listings here right now (not sales)? A rising rental-DOM trend means longer vacancies and softer asking-rent achievability than the comps imply.
- What's the recent tenant-quality profile in this submarket — average credit score on applications, eviction rate, late-payment / NSF rate, and stable-employment percentage? A property-management company in the area should have these aggregated.
- How much new for-sale + rental construction is in the pipeline within 1–3 miles? Heavy new supply typically softens prices + rents 12–24 months out; constrained supply supports both.
Investment metrics
- 1% rule
- 1.18% ✓
- Cap rate
- 7.06%
- Cash-on-cash
- 2.75%
- DSCR
- 1.12
- GRM
- 7.0
CMA / ARV
- ARV (median comp)
- $267,001
- List price
- $160,000
- Delta
- -40.08%
- Verdict
- UNDERPRICED
- Comps
- 20 within 1.0 mi
Show comp detail 12 sales within ~0.75 mi
| Address | Dist | Beds/Ba | Sqft | Sold | Price | $/sf | Match |
|---|---|---|---|---|---|---|---|
| 1108 Center St | 0.31mi | 3/3.0 | 1,628 (-2%) | 3mo | $324,000 | $199 | 75 |
| 1502 Nolan St | 0.69mi | 3/2.0 | 1,625 (-2%) | 1mo | $345,000 | $212 | 63 |
| 1448 Montana | 0.46mi | 4/3.0 (+1) | 1,562 (-6%) | 1mo | $309,900 | $198 | 58 |
| 403 N Palmetto | 0.39mi | 3/2.0 | 1,443 (-13%) | 2mo | $375,000 | $260 | 58 |
| 621 Center St | 0.45mi | 3/2.5 | 1,515 (-9%) | 6mo | $389,500 | $257 | 57 |
| 938 Dawson St | 0.55mi | 3/2.5 | 1,778 (+7%) | 6mo | $370,000 | $208 | 56 |
| 1323 Nolan | 0.69mi | 3/2.0 | 1,550 (-7%) | 2mo | $349,000 | $225 | 55 |
| 2235 E Houston | 0.65mi | 4/2.0 (+1) | 1,556 (-6%) | 3mo | $110,000 | $71 | 51 |
| 2243 E Houston | 0.66mi | 3/1.0 | 1,516 (-9%) | 6mo | $59,900 | $40 | 45 |
| 1217 Delaware St | 0.72mi | 3/2.0 | 1,476 (-11%) | 7mo | $299,900 | $203 | 42 |
| 219 Nelson Ave | 0.61mi | 4/2.0 (+1) | 1,424 (-14%) | 4mo | $249,000 | $175 | 39 |
| 414 Canton | 0.64mi | 4/2.5 (+1) | 1,899 (+14%) | 3mo | $230,000 | $121 | 37 |
Match score weights: distance 35% · size 25% · config 20% · recency 20%. Top-matched comps best support the ARV.
Projected returns pro-forma
1.34% appreciation · 8.0% rent growth · sell at horizon
- IRR
- 9.3%
- Equity multiple
- 1.50×
- Total profit
- $22,403
- Equity at exit
- $57,433
- IRR
- 16.5%
- Equity multiple
- 3.40×
- Total profit
- $107,693
- Equity at exit
- $78,547
Cash invested: $44,800 (down + closing). Projections, not guarantees.
Landlord ↔ Tenant lean methodology
- Overall (STATE)
- 87 Strongly Landlord-Friendly
- State Texas
- 87 Strongly Landlord-Friendly · R+5
- County
- — inherits STATE
- City
- — inherits STATE
ZIP-level market 78203
- Home prices YoY
- 0.5%
- Rents YoY
- 10.9%
- Active inventory
- 99
- Price-to-rent
- 7.0×
Monthly cashflow live
- Estimated rent
- $1,895 high interval (Pro) →
- Mortgage (P&I)
- −$839
- Tax from tax record
- −$488 /mo · $5,857/yr
- Insurance
- −$67
- HOA
- −$0
- Vacancy / Maint / Mgmt
- −$398
- Net cashflow
- $103
Break-even live
UW: 25.0% down · 7.5% · 30yr · 1.5% tax · 5.0% vac · 8.0% maint · 8.0% mgmt
Financing live
Cash to close
- Down payment
- $40,000
- Closing costs
- $4,800
- Reserves months
- —
- Total cash needed
- —
Loan-product check · same deal, 3 products live
Conventional
25% down · 7.5% · 30yr
- Down + closing
- —
- Monthly P&I
- —
- Monthly cashflow
- —
- DSCR
- —
- Eligible?
- —
Personal DTI + credit; lowest rate.
DSCR
20% down · 8.5% · 30yr
- Down + closing
- —
- Monthly P&I
- —
- Monthly cashflow
- —
- DSCR
- —
- Eligible?
- —
No personal income docs; deal must DSCR.
Hard money
10% down · 12.0% · 12mo
- Down + closing
- —
- Monthly P&I
- —
- Monthly cashflow
- —
- DSCR
- —
- Eligible?
- —
Short-term bridge; refi at stabilization.
Rent comps 40 comps
| Address | Beds | Baths | Sqft | Rent | $/sqft | DOM | Units | Dist |
|---|---|---|---|---|---|---|---|---|
| 210 Piedmont Ave Unit 101 San Antonio, TX | 2.0 | 2.5 | 1050 | $1,395 | $1.33 | 43d | 1 | 0.01mi |
| 1419 Wyoming St San Antonio, TX | 2.0 | 1.0 | 1232 | $1,550 | $1.26 | 4d | 1 | 0.04mi |
| 811 Montana St Unit 1301 San Antonio, TX | 2.0 | 2.0 | 1240 | $1,800 | $1.45 | 43d | 1 | 0.11mi |
| 802 Montana St Unit 2 San Antonio, TX | 3.0 | 1.0 | 1440 | $1,500 | $1.04 | 10d | 1 | 0.11mi |
| 316 Toledo St Unit 102 San Antonio, TX | 2.0 | 2.0 | 1168 | $2,200 | $1.88 | 43d | 1 | 0.12mi |
| 1205 Wyoming St San Antonio, TX | 2.0 | 2.0 | 1114 | $2,300 | $2.06 | 43d | 1 | 0.18mi |
| 630 Montana St Unit 301 San Antonio, TX | 2.0 | 2.0 | 1320 | $2,250 | $1.70 | 14d | 1 | 0.21mi |
| 218 S Olive St #2101 San Antonio, TX | 3.0 | 3.5 | 1800 | $3,199 | $1.78 | 43d | 1 | 0.26mi |
| 850 Nevada St Unit NA San Antonio, TX | 2.0 | 1.0 | 1345 | $1,795 | $1.33 | 12d | 1 | 0.26mi |
| 222 S Olive St San Antonio, TX | 3.0 | 3.5 | 2073 | $2,500 | $1.21 | 43d | 1 | 0.28mi |
| 222 S Olive St #1102 San Antonio, TX | 3.0 | 3.5 | 2073 | $2,500 | $1.21 | 43d | 1 | 0.28mi |
| 723 Paso Hondo San Antonio, TX | 3.0 | 1.0 | 1224 | $1,500 | $1.23 | 43d | 1 | 0.28mi |
| 415 S Olive St San Antonio, TX | 3.0 | 2.0 | 1348 | $2,600 | $1.93 | 43d | 1 | 0.35mi |
| 207 Gravel St Unit 102 San Antonio, TX | 3.0 | 2.5 | 1394 | $1,800 | $1.29 | 23d | 1 | 0.36mi |
| 114 Gravel St San Antonio, TX | 4.0 | 3.5 | 1936 | $2,095 | $1.08 | 4d | 1 | 0.40mi |
| 631 Potomac San Antonio, TX | 3.0 | 2.5 | 1844 | $1,797 | $0.97 | 23d | 1 | 0.44mi |
| 1138 Iowa St San Antonio, TX | 3.0 | 2.0 | 1505 | $1,650 | $1.10 | 23d | 1 | 0.47mi |
| 1618 Dakota St Unit 102 San Antonio, TX | 3.0 | 2.5 | 1768 | $1,925 | $1.09 | 16d | 1 | 0.49mi |
| 718 S Pine St San Antonio, TX | 2.0 | 2.0 | 1213 | $1,650 | $1.36 | 4d | 1 | 0.49mi |
| 155 Canton San Antonio, TX | 2.0 | 2.0 | 1078 | $1,250 | $1.16 | 23d | 1 | 0.49mi |
| 431 S Mesquite St San Antonio, TX | 3.0 | 2.0 | 1220 | $1,750 | $1.43 | 16d | 1 | 0.50mi |
| 326 Cactus St San Antonio, TX | 3.0 | 2.5 | 2059 | $2,500 | $1.21 | 23d | 1 | 0.50mi |
| 521 S Polaris St San Antonio, TX | 3.0 | 1.0 | 1200 | $1,249 | $1.04 | 4d | 1 | 0.51mi |
| 732 S Pine St Unit 1 San Antonio, TX | 3.0 | 2.0 | 1371 | $1,650 | $1.20 | 43d | 1 | 0.51mi |
| 104 Shenandoah San Antonio, TX | 3.0 | 2.5 | 1580 | $1,925 | $1.22 | 17d | 1 | 0.53mi |
| 707 S Olive St Unit B San Antonio, TX | 3.0 | 2.0 | 2054 | $1,500 | $0.73 | 44d | 1 | 0.53mi |
| 511 N Monumental San Antonio, TX | 2.0 | 2.0 | 1206 | $1,595 | $1.32 | 4d | 1 | 0.53mi |
| 603 S Mesquite St San Antonio, TX | 3.0 | 2.5 | 1333 | $1,750 | $1.31 | 21d | 1 | 0.54mi |
| 1101 Gibbs San Antonio, TX | 3.0 | 1.0 | 1100 | $1,345 | $1.22 | 23d | 1 | 0.56mi |
| 1101 Gibbs San Antonio, TX | 3.0 | 1.0 | 1100 | $1,345 | $1.22 | 14d | 1 | 0.56mi |
| 113 Dilworth St San Antonio, TX | 3.0 | 3.0 | 1383 | $1,850 | $1.34 | 23d | 1 | 0.56mi |
| 123 Dilworth St San Antonio, TX | 3.0 | 2.0 | 1384 | $1,900 | $1.37 | 43d | 1 | 0.57mi |
| 1111 Gibbs San Antonio, TX | 3.0 | 2.0 | 1476 | $1,595 | $1.08 | 23d | 1 | 0.58mi |
| 419 Cactus St Unit 102 San Antonio, TX | 2.0 | 1.5 | 1091 | $1,750 | $1.60 | 43d | 1 | 0.58mi |
| 136 Nelson Ave San Antonio, TX | 3.0 | 1.0 | 1092 | $1,316 | $1.21 | 43d | 1 | 0.59mi |
| 807 Dreiss St San Antonio, TX | 3.0 | 2.0 | 1200 | $2,095 | $1.75 | 23d | 1 | 0.61mi |
| 211 Utah St #601 San Antonio, TX | 2.0 | 2.5 | 1208 | $1,650 | $1.37 | 43d | 1 | 0.63mi |
| 610 Virginia Blvd Unit 2 San Antonio, TX | 3.0 | 1.0 | 1722 | $1,150 | $0.67 | 4d | 1 | 0.63mi |
| 115 Saint Charles San Antonio, TX | 3.0 | 2.0 | 1680 | $2,050 | $1.22 | 10d | 1 | 0.63mi |
| 210 Utah St #101 San Antonio, TX | 3.0 | 2.5 | 1208 | $1,695 | $1.40 | 43d | 1 | 0.66mi |
Listing history 14 events
-
2026-06-18days on market $160,000 Active 148 DOM
-
2026-06-17days on market $160,000 Active 147 DOM
-
2026-06-16days on market $160,000 Active 146 DOM
-
2026-06-15days on market $160,000 Active 145 DOM
-
2026-06-13days on market $160,000 Active 143 DOM
-
2026-06-09days on market $160,000 Active 139 DOM
-
2026-06-08days on market $160,000 Active 138 DOM
-
2026-06-07days on market $160,000 Active 137 DOM
-
2026-06-04days on market $160,000 Active 134 DOM
-
2026-06-03days on market $160,000 Active 133 DOM
-
2026-06-02days on market $160,000 Active 132 DOM
-
2026-06-01days on market $160,000 Active 131 DOM
-
2026-05-31days on market $160,000 Active 130 DOM
-
2026-01-21$160,000 New 291-char remark
Show marketing remark (291 chars)
**Investor Special** AS-SALE. Home is currently set up as a duplex with 1 bedroom and 1 bathroom on each side. Lot has been split in two using a condo regime. New survey is attached in documents. Offers will not be considered unless you have viewed and assessed the property. NO WHOLESALERS.
ⓘ Source: listings_history table (triggers on properties + properties_extension) + one-shot
backfill from property_details.listing_events for pre-trigger history.
Tax reassessment forecast TX · Resets to sale price
- Current annual tax
- $5,857 · $488/mo
- Projected year-2 tax
- $5,857 · $488/mo
- Expected delta
- $0/yr ($0/mo · 0.0%)
ⓘ Screening estimate from a state-policy table — verify with the county assessor before closing.
Climate risk First Street
- Flood 1/10 Low FEMA zone X (unshaded) · 0% chance over 30 yrs
- Wildfire 1/10 Low
- Heat 8/10 Severe 7 d/yr ≥108°F today · 20 d/yr by 30 yrs out
- Wind 8/10 Severe 80% chance of damaging wind over 30 yrs
- Air quality 2/10 Low 1 unhealthy d/yr today · 2 by 30 yrs out
Nearby sold comps map
Loading sold comps map…
Walkable amenities ~0.75 mi
Loading nearby amenities…
Taxation est. · year 1
- Rental income
- $22,734
- − Mortgage interest
- −$8,962
- − Property taxes
- −$5,857
- − Insurance
- −$800
- − Repairs & maintenance
- −$1,819
- − Management
- −$1,819
- − Depreciation
- −$4,655
- Taxable loss
- −$1,178
- Est. tax savings @ 24.0%
- +$283
- After-tax cash flow
- $1,517/yr
For passive investors: Depreciation is non-cash, so a rental often shows a tax loss while cash-flowing — sheltering income. Rental losses are passive: they offset passive income freely, and up to $25,000/yr can offset ordinary (W-2) income if you actively participate and your MAGI is under $100k (phasing out to $0 by $150k); unused losses carry forward. On sale, claimed depreciation is recaptured at up to 25%, and gains may owe capital-gains tax (a 1031 exchange can defer both). Figures are a year-1 estimate at your 24.0% rate — not tax advice; consult a CPA.
Schools (NCES district)
- District
- San Antonio ISD
- NCES district ID
- 4838730
- Math proficiency
- 12% ▼ -21.00%
- Reading proficiency
- 22% ▼ -7.00%
- Median HH income
- $30,952
- Composite
- 13.57/100
- National rank
- #9512
- State rank
- #805 of 826 in TX
Livability — San Antonio
- Score
- 80/100
- State rank
- #31
- US rank
- #1616
Category grades
Schools grade is shown separately in the Schools card above.
Census & demographics
- Census place
- San Antonio, TX
- County
- Bexar County · 1,990,555 people
- City population
- 1,806,925
- Metro
- San Antonio-New Braunfels, TX
- Population (ZIP)
- 5,200
- Household income
- $35,536
- Rent vs Own
- Severe rent burden
- 470.0
Population outlook (Bexar County) Hauer SSP2
- Today (2025)
- 2,336,851 people
- By 2030
- 2,560,728 · +9.6%
- By 2040
- 3,020,569 · +29.3%
- By 2050
- 3,493,522 · +49.5%
- By 2075
- 4,668,459 · +99.8%
- By 2100
- 5,533,242 · +136.8%
Race, ethnicity, and origin ACS 2023
- Neighborhood character
- Predominantly Hispanic (84%)
- Race & ethnicity
- Hispanic / Latino 84% Two or more races 37% Black 8% White 7% Native American 1%
- Hispanic origin (detail)
- Mexican 67% Puerto Rican 3%
- Common ancestry
- Portuguese 2% Lithuanian 2%
- Foreign-born
- 18% · Canada
- Languages at home
- 53% English-only · Spanish 46%
Political lean MEDSL · Bexar
- 2024 margin
- Lean D (+9.8) · D 54.3% · R 44.6% · Other 1.1%
- 2008→2024 swing
- +4.2pp toward D · 2008: 5.6pp · 2024: 9.8pp
- All cycles
- 2024: D+9.8 2020: D+18.2 2016: D+13.5 2012: D+4.6 2008: D+5.6
Not yet ingested
- Civics
- —
Market trends
- HPI YoY
- ▲ 1.34%
- Current HPI
- 257.4183
- Rent YoY
- ▲ 10.86%
- Metro
- San Antonio-New Braunfels, TX
- State GDP YoY
- ▲ 3.95%
- F500 in state
- 110
Industry mix (Fortune 500 HQ in TX)
| Industry | F500 HQs | Revenue |
|---|---|---|
| Energy | 16 | $1,198B |
|
||
| Technology | 5 | $198B |
|
||
| Engineering / Construction | 4 | $72B |
|
||
| Energy Services | 3 | $60B |
|
||
| Utilities | 3 | $41B |
|
||
| Healthcare | 2 | $330B |
|
||
Price history
1 event — show timeline
- 2026-01-21 Listed $160,000 LERA
Property tax history
+9.0%/yrLatest (2025): $5,857 · +0.0% YoY. Source: county tax records.
Cash-flow waterfall
monthlySold comps — $/sqft
last 12 mo · ≤1 miLoading sold comps…