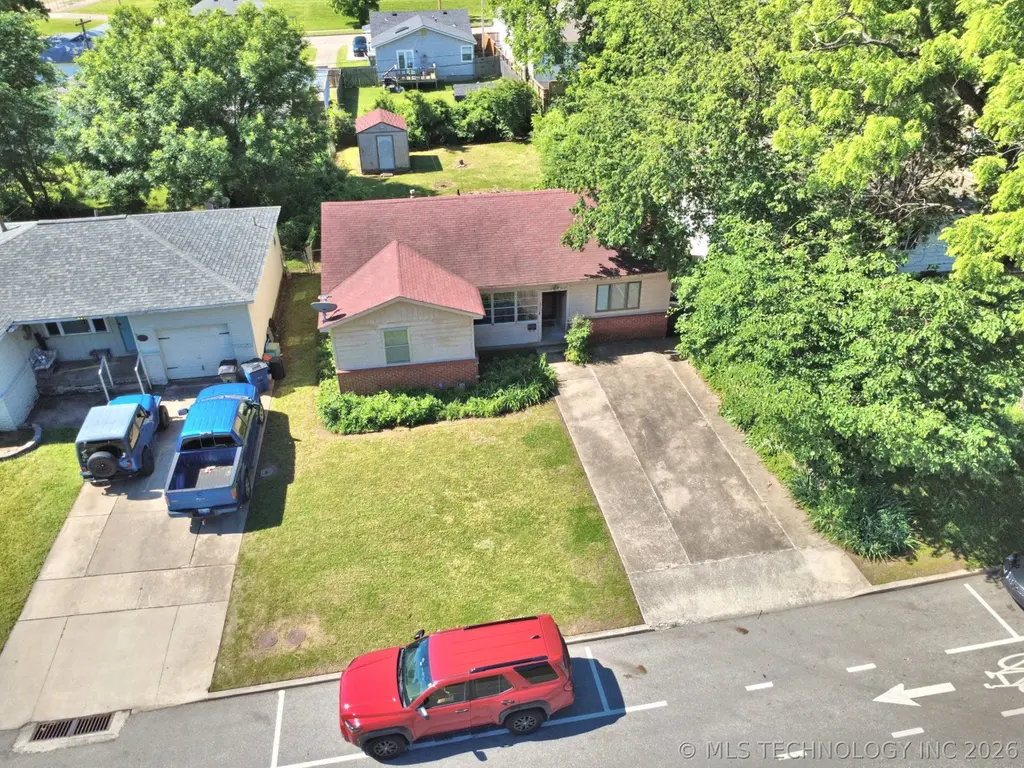
3528 E 4th St S · Tulsa, OK
Flood risk 5/10 · Moderate
- FEMA flood zone
- X (unshaded)
- Chance of flooding over 30 yrs
- 0.48%
- Est. flood insurance / yr
- $507 – $1,088
Fire risk 1/10 · Minimal
- Est. fire insurance / yr
- $2,463 – $4,575
Heat risk 6/10 · Moderate
- Hot days now (above 110°F)
- 7 days/yr
- Hot days in 30 yrs
- 18 days/yr
Wind risk 2/10 · Minimal
- Chance of severe wind over 30 yrs
- 4.0%
Air-quality risk 3/10 · Minor
- Unhealthy air days now
- 2 days/yr
- Unhealthy air days in 30 yrs
- 3 days/yr
Risk factors via First Street. Map © Google.
Why this score? — see what drove the B grade
The composite is a weighted blend of 9 inputs, each scored 0–100. Each bar is that input's sub-score; the figure is the points it added to the 100-point composite (weight × sub-score).
- Cash flow +29.4/30.0
- ARV discount +15.0/15.0
- DSCR +10.0/10.0
- 1% rule +6.9/10.0
- Livability +3.8/5.0
- Rent growth +3.7/5.0
- Condition / age +2.5/5.0
- Schools +0.8/10.0
- Appreciation +0.0/10.0
$130,000
🖨 Deal sheet 📄 Offer letter ✓ Due diligence
Listing remarks
Cutie Patootie and full of potential, this home is ready for a cash buyer with vision! Features include updated kitchen cabinetry, Corian countertops, garbage disposal, hardwood floors, two living areas, utility room, enclosed front porch, and a spacious fenced backyard filled with beautiful perennials. The bathroom offers a fabulous walk-in shower with safety features and a newer high-rise Kohler toilet. Pella sliding glass door and Pella casement windows in the garage conversion add extra charm. All kitchen and laundry appliances, plus an extra water heater, remain with the home. Conveniently located just a block North of Will Rogers High School, and only 10 minutes to downtown Tulsa! Pr
Key facts
- Utility room
- Corian countertops
- Two living areas
Tags
Property features AI
Finance
- HOA & community: Sidewalks in the community
Exterior
- Parking: Concrete driveway
- Security: Smoke detector(s); No safety shelter
- Utilities: Electricity available; Natural gas available; Phone available; Public water; Public sewer
- Home design: Single-story home; Faces north; Crawlspace foundation
- Construction: Wood siding with wood frame construction; Asphalt/fiberglass roof; Built per public records
- Exterior features: Concrete driveway; Enclosed porch; Porch; Shed(s); Full chain-link fencing
Interior
- Kitchen: Pantry; Oven; Range; Dishwasher; Garbage disposal; Refrigerator
- Bedrooms: Three first-floor bedrooms
- Flooring: Hardwood; Tile
- Bathrooms: One full bathroom with hall access and bathtub
- Heating & cooling: Central heating (gas); Central air conditioning
- Interior features: Solid surface counters; Ceiling fan(s); Aluminum frame, vinyl, insulated windows; Insulated doors and storm door(s)
- Laundry & utility: Washer hookup; Washer; Dryer; Separate inside utility room
Neighborhood map
What this means for you Summary
Snapshot
- This is a 3-bed/1.0-bath single-family listed at $130k.
Deal economics
- At list price, monthly cash flow is $462 ($6k/yr) — positive.
- The deal already cash-flows at list — no discount required.
- Meets the 1% rule at list price ($2k rent vs $130k).
- Cap rate 10.6% vs local median 3.9% in Tulsa — top-decile yield for the area; either an underpriced asset or a hidden risk that comps aren't pricing in. Stress-test before assuming the spread holds.
Location & tenants
- Location reads 75/100 on livability (#13 in OK, #4,058 nationally) — a middle-class / working-renter tenant base. Strengths: amenities A+, commute A+, cost of living A+; Watch: schools F, crime F, employment D-.
- Tulsa (urban): math 7% / reading 12% proficiency, ranked #250 of 270 in OK (top 93%) — low school quality limits family demand, transient renter base, plan for 1-2y turnover; 76% free/reduced lunch — lower-income household profile, screen leases tightly.
- Market conditions: Rents rising fast (+4.7%/yr); 116 active listings in the ZIP; 27 comparable units currently listed for rent nearby; rentals at typical pace (median 24d on market — plan ~3-4 weeks tenant-placement turnaround); 2,818 units permitted in Tulsa County in 2024 (518 in 5+ unit buildings).
- This rent runs 32% of the median local income ($59k/yr) — at the standard rent-burdened threshold; future hikes will face affordability resistance.
Forward outlook
- Local home prices are declining (-3.0%/yr); year-one equity from $899 of loan paydown is wiped out by about $4k of value loss. Plan a longer hold.
- Tulsa County population projected at +30% by 2050 — long-run rental-demand tailwind backs the buy-and-hold thesis.
- At projected returns (-3.0% appreciation + 4.7% rent growth), your $36k cash investment doubles in ~7 years — after that, you're playing with house money.
Negotiation context
- Only 7 days on market — expect competitive offers; lowballing is unlikely to land.
Risks & watch-outs
- Watch-outs: built in 1939 — expect roof / HVAC / electrical / plumbing capex.
- Climate carrying-cost: moderate flood risk; extreme-heat days projected 7→18/yr by 2055 (HVAC capex compounding) — expect insurance premiums to compound above CPI over the hold.
Questions for the listing agent
- Built in 1939 — when were the roof, HVAC, electrical panel, plumbing, and water heater last replaced?
- Is there a deadline driving the sale (1031 exchange, divorce, estate, relocation)? That informs how much negotiation room exists.
- Schools are F-rated, which usually means shorter tenancies and higher turnover. Who's the typical renter profile here, and what's been the actual vacancy rate?
- Crime grade is F in this area — have there been break-ins, vandalism, or insurance claims at this property in the last 3 years? What carrier currently insures it and at what premium?
- What's the average days-on-market for RENTAL listings here right now (not sales)? A rising rental-DOM trend means longer vacancies and softer asking-rent achievability than the comps imply.
- What's the recent tenant-quality profile in this submarket — average credit score on applications, eviction rate, late-payment / NSF rate, and stable-employment percentage? A property-management company in the area should have these aggregated.
- How much new for-sale + rental construction is in the pipeline within 1–3 miles? Heavy new supply typically softens prices + rents 12–24 months out; constrained supply supports both.
Investment metrics
- 1% rule
- 1.19% ✓
- Cap rate
- 10.56%
- Cash-on-cash
- 15.24%
- DSCR
- 1.68
- GRM
- 7.0
CMA / ARV
- ARV (on-the-fly)
- $225,050
- Comps found
- 12
Show comp detail 12 sales within ~0.75 mi
| Address | Dist | Beds/Ba | Sqft | Sold | Price | $/sf | Match |
|---|---|---|---|---|---|---|---|
| 103 S Knoxville Ave | 0.22mi | 2/2.0 (-1) | 1,194 (-7%) | 2mo | $135,000 | $113 | 67 |
| 209 S Quebec Ave | 0.39mi | 4/2.0 (+1) | 1,344 (+4%) | 1mo | $203,000 | $151 | 65 |
| 507 S Quebec Ave | 0.43mi | 3/2.0 | 1,378 (+7%) | 1mo | $225,000 | $163 | 64 |
| 3501 E 8th St | 0.38mi | 2/1.0 (-1) | 1,390 (+8%) | 1mo | $298,970 | $215 | 63 |
| 232 S Florence Ave | 0.47mi | 3/2.0 | 1,211 (-6%) | 2mo | $174,000 | $144 | 63 |
| 3310 E Admiral Ct | 0.43mi | 3/1.0 | 1,122 (-13%) | 1mo | $159,000 | $142 | 58 |
| 205 S Sandusky Ave | 0.53mi | 3/1.5 | 1,160 (-10%) | 1mo | $239,000 | $206 | 56 |
| 1228 S Knoxville Ave | 0.68mi | 2/1.0 (-1) | 1,216 (-5%) | 1mo | $240,000 | $197 | 54 |
| 448 S Quebec Ave | 0.38mi | 3/2.0 | 1,472 (+14%) | 2mo | $285,000 | $194 | 53 |
| 711 S New Haven Ave | 0.38mi | 2/2.0 (-1) | 1,463 (+14%) | 0mo | $250,000 | $171 | 50 |
| 903 S Richmond Ave | 0.62mi | 3/1.0 | 1,126 (-12%) | 1mo | $197,000 | $175 | 50 |
| 3520 E 12th Pl | 0.74mi | 2/1.5 (-1) | 1,347 (+5%) | 1mo | $280,000 | $208 | 50 |
Match score weights: distance 35% · size 25% · config 20% · recency 20%. Top-matched comps best support the ARV.
Projected returns pro-forma
-3.0% appreciation · 4.73% rent growth · sell at horizon
- IRR
- 7.6%
- Equity multiple
- 1.30×
- Total profit
- $11,065
- Equity at exit
- $19,383
- IRR
- 18.2%
- Equity multiple
- 2.62×
- Total profit
- $58,987
- Equity at exit
- $11,240
Cash invested: $36,400 (down + closing). Projections, not guarantees.
Landlord ↔ Tenant lean methodology
- Overall (STATE)
- 83 Strongly Landlord-Friendly
- State Oklahoma
- 83 Strongly Landlord-Friendly · R+20
- County
- — inherits STATE
- City
- — inherits STATE
ZIP-level market 74112
- Rents YoY
- 4.7%
- Active inventory
- 116
- Price-to-rent
- 7.0×
Monthly cashflow live
- Estimated rent
- $1,552 high interval (Pro) →
- Mortgage (P&I)
- −$682
- Tax from tax record
- −$28 /mo · $334/yr
- Insurance
- −$54
- HOA
- −$0
- Vacancy / Maint / Mgmt
- −$326
- Net cashflow
- $462
Break-even live
UW: 25.0% down · 7.5% · 30yr · 1.5% tax · 5.0% vac · 8.0% maint · 8.0% mgmt
Financing live
Cash to close
- Down payment
- $32,500
- Closing costs
- $3,900
- Reserves months
- —
- Total cash needed
- —
Loan-product check · same deal, 3 products live
Conventional
25% down · 7.5% · 30yr
- Down + closing
- —
- Monthly P&I
- —
- Monthly cashflow
- —
- DSCR
- —
- Eligible?
- —
Personal DTI + credit; lowest rate.
DSCR
20% down · 8.5% · 30yr
- Down + closing
- —
- Monthly P&I
- —
- Monthly cashflow
- —
- DSCR
- —
- Eligible?
- —
No personal income docs; deal must DSCR.
Hard money
10% down · 12.0% · 12mo
- Down + closing
- —
- Monthly P&I
- —
- Monthly cashflow
- —
- DSCR
- —
- Eligible?
- —
Short-term bridge; refi at stabilization.
Rent comps 27 comps
| Address | Beds | Baths | Sqft | Rent | $/sqft | DOM | Units | Dist |
|---|---|---|---|---|---|---|---|---|
| 3531 E 4th St Tulsa, OK | 3.0 | 2.0 | 1652 | $1,745 | $1.06 | 23d | 1 | 0.02mi |
| 537 S Marion Ave Tulsa, OK | 2.0 | 1.0 | 933 | $1,325 | $1.42 | 3d | 1 | 0.31mi |
| 3328 E 7th St Tulsa, OK | 2.0 | 1.0 | 1008 | $1,525 | $1.51 | 15d | 1 | 0.39mi |
| 516 S Quebec Ave Tulsa, OK | 2.0 | 1.0 | 1200 | $1,295 | $1.08 | 23d | 1 | 0.43mi |
| 44 S Florence Ave Tulsa, OK | 2.0 | 1.0 | 1080 | $1,450 | $1.34 | 23d | 1 | 0.48mi |
| 223 S Evanston Ave Tulsa, OK | 3.0 | 2.0 | 1220 | $1,395 | $1.14 | 23d | 1 | 0.57mi |
| 43 S Toledo Ave Tulsa, OK | 3.0 | 2.0 | 884 | $1,650 | $1.87 | 15d | 1 | 0.61mi |
| 728 N Marion Ave Tulsa, OK | 3.0 | 2.0 | 1405 | $1,305 | $0.93 | 15d | 1 | 0.66mi |
| 2808 E 1st Pl Unit P21-Q Tulsa, OK | 2.0 | 1.0 | 1025 | $1,250 | $1.22 | 23d | 1 | 0.68mi |
| 723 N Gary Pl Tulsa, OK | 2.0 | 1.0 | 1213 | $1,200 | $0.99 | 23d | 1 | 0.69mi |
| 1150 S Marion Ave Tulsa, OK | 3.0 | 2.5 | 1800 | $2,300 | $1.28 | 23d | 1 | 0.70mi |
| 839 N New Haven Ave Tulsa, OK | 3.0 | 1.0 | 1238 | $1,250 | $1.01 | 23d | 1 | 0.83mi |
| 1307 S Indianapolis Ave Tulsa, OK | 2.0 | 1.0 | 1108 | $1,990 | $1.80 | 1d | 1 | 0.84mi |
| 1316 S Oswego Ave Tulsa, OK | 2.0 | 1.0 | 975 | $1,295 | $1.33 | 23d | 1 | 0.88mi |
| 2532 E 4th St Tulsa, OK | 2.0 | 2.0 | 1088 | $800 | $0.74 | 23d | 1 | 0.98mi |
| 1338 S Florence Ave Unit 1 Tulsa, OK | 2.0 | 1.0 | 1200 | $1,450 | $1.21 | 3d | 1 | 1.02mi |
| 720 N Columbia Ave Tulsa, OK | 3.0 | 1.0 | 1233 | $1,150 | $0.93 | 3d | 1 | 1.04mi |
| 2529 E Admiral Pl Unit A Tulsa, OK | 2.0 | 1.0 | 1100 | $1,295 | $1.18 | 23d | 1 | 1.04mi |
| 2509 E 7th St Tulsa, OK | 3.0 | 2.0 | 1161 | $1,815 | $1.56 | 11d | 1 | 1.09mi |
| 1524 S Jamestown Ave Tulsa, OK | 2.0 | 2.0 | 1528 | $1,500 | $0.98 | 15d | 1 | 1.12mi |
| 1139 S Birmingham Ave Tulsa, OK | 3.0 | 2.0 | 1725 | $2,100 | $1.22 | 23d | 1 | 1.14mi |
| 5347 E 5th St Tulsa, OK | 3.0 | 1.0 | 1181 | $1,600 | $1.35 | 23d | 1 | 1.19mi |
| 2435 E 10th St Tulsa, OK | 3.0 | 1.0 | 1040 | $1,650 | $1.59 | 3d | 1 | 1.20mi |
| 4703 E Latimer Pl Tulsa, OK | 2.0 | 1.0 | 1103 | $1,290 | $1.17 | 3d | 1 | 1.25mi |
| 1632 S Louisville Ave Tulsa, OK | 3.0 | 1.0 | 1205 | $1,700 | $1.41 | 11d | 1 | 1.27mi |
| 2219 E 11th St Tulsa, OK | 1.0–3.0 | 1.0–3.0 | 1136 | $2,787 | $2.45 | 1d | 10 | 1.35mi |
| 2319 E 13th St Tulsa, OK | 2.0 | 1.0 | 875 | $1,400 | $1.60 | 23d | 1 | 1.46mi |
Listing history 3 events
-
2026-05-19status Pending
-
2026-05-12price $130,000
-
2026-05-10$5,102,026 Active
ⓘ Source: listings_history table (triggers on properties + properties_extension) + one-shot
backfill from property_details.listing_events for pre-trigger history.
Tax reassessment forecast OK · Resets to sale price
- Current annual tax
- $334 · $28/mo
- Projected year-2 tax
- $1,170 · $98/mo
- Expected delta
- +$836/yr (+$70/mo · 250.3%)
ⓘ Screening estimate from a state-policy table — verify with the county assessor before closing.
Climate risk First Street
- Flood 5/10 Major FEMA zone X (unshaded) · 48% chance over 30 yrs
- Wildfire 1/10 Low
- Heat 6/10 Major 7 d/yr ≥110°F today · 18 d/yr by 30 yrs out
- Wind 2/10 Low 4% chance of damaging wind over 30 yrs
- Air quality 3/10 Moderate 2 unhealthy d/yr today · 3 by 30 yrs out
Nearby sold comps map
Loading sold comps map…
Walkable amenities ~0.75 mi
Loading nearby amenities…
Taxation est. · year 1
- Rental income
- $18,623
- − Mortgage interest
- −$7,282
- − Property taxes
- −$334
- − Insurance
- −$650
- − Repairs & maintenance
- −$1,490
- − Management
- −$1,490
- − Depreciation
- −$3,782
- Taxable income
- $3,595
- Est. tax owed @ 24.0%
- −$863
- After-tax cash flow
- $4,684/yr
For passive investors: Depreciation is non-cash, so a rental often shows a tax loss while cash-flowing — sheltering income. Rental losses are passive: they offset passive income freely, and up to $25,000/yr can offset ordinary (W-2) income if you actively participate and your MAGI is under $100k (phasing out to $0 by $150k); unused losses carry forward. On sale, claimed depreciation is recaptured at up to 25%, and gains may owe capital-gains tax (a 1031 exchange can defer both). Figures are a year-1 estimate at your 24.0% rate — not tax advice; consult a CPA.
Schools (NCES district)
- District
- Tulsa
- NCES district ID
- 4030240
- Math proficiency
- 7% ▼ -9.00%
- Reading proficiency
- 12% ▼ -7.00%
- Median HH income
- $37,895
- Composite
- 8.04/100
- National rank
- #9919
- State rank
- #250 of 270 in OK
Livability — Tulsa
- Score
- 75/100
- State rank
- #13
- US rank
- #4058
Category grades
Schools grade is shown separately in the Schools card above.
Census & demographics
- Census place
- Tulsa, OK
- County
- Tulsa County · 640,811 people
- City population
- 389,418
- Metro
- Tulsa, OK
- Population (ZIP)
- 21,386
- Household income
- $58,951
- Rent vs Own
- Severe rent burden
- 755.0
Population outlook (Tulsa County) Hauer SSP2
- Today (2025)
- 723,846 people
- By 2030
- 766,033 · +5.8%
- By 2040
- 851,386 · +17.6%
- By 2050
- 938,389 · +29.6%
- By 2075
- 1,166,011 · +61.1%
- By 2100
- 1,350,277 · +86.5%
Race, ethnicity, and origin ACS 2023
- Neighborhood character
- Diverse neighborhood (Simpson 0.64)
- Race & ethnicity
- White 56% Hispanic / Latino 20% Two or more races 16% Black 9% Native American 6% Asian 1%
- Hispanic origin (detail)
- Mexican 14% Puerto Rican 1%
- Common ancestry
- Slovak 2% Lithuanian 2% Italian 1%
- Foreign-born
- 9% · Canada
- Languages at home
- 82% English-only · Spanish 15% Other Asian/Pacific 1%
Political lean MEDSL · Tulsa
- 2024 margin
- R (+15.2) · D 41.3% · R 56.5% · Other 2.2%
- 2008→2024 swing
- +9.2pp toward D · 2008: -24.5pp · 2024: -15.2pp
- All cycles
- 2024: R+15.2 2020: R+15.6 2016: R+22.9 2012: R+27.4 2008: R+24.5
Not yet ingested
- Civics
- —
Market trends
- HPI YoY
- ▼ -207.46%
- Current HPI
- 271.3292
- Rent YoY
- ▲ 4.73%
- Metro
- Tulsa, OK
- State GDP YoY
- ▲ 1.55%
- F500 in state
- 6
Industry mix (Fortune 500 HQ in OK)
| Industry | F500 HQs | Revenue |
|---|---|---|
| Energy | 3 | $48B |
|
||
Price history
-97.5% since first listed3 events — show timeline
- 2026-05-19 Pending — MLS Technology, Inc.
- 2026-05-12 Price Changed $130,000 MLS Technology, Inc.
- 2026-05-10 Listed $5,102,026 MLS Technology, Inc.
Property tax history
+0.4%/yrLatest (2025): $334 · +3.4% YoY. Source: county tax records.
Cash-flow waterfall
monthlySold comps — $/sqft
last 12 mo · ≤1 miLoading sold comps…