96 Richwood Dr · Moody, AL
Flood risk 1/10 · Minimal
- FEMA flood zone
- X (unshaded)
- Chance of flooding over 30 yrs
- 0.0%
- Est. flood insurance / yr
- $507 – $1,088
Fire risk 5/10 · Moderate
- Est. fire insurance / yr
- $916 – $1,700
Heat risk 5/10 · Moderate
- Hot days now (above 107°F)
- 7 days/yr
- Hot days in 30 yrs
- 19 days/yr
Wind risk 6/10 · Moderate
- Chance of severe wind over 30 yrs
- 27.0%
Air-quality risk 3/10 · Minor
- Unhealthy air days now
- 2 days/yr
- Unhealthy air days in 30 yrs
- 4 days/yr
Risk factors via First Street. Map © Google.
Why this score? — see what drove the B- grade
The composite is a weighted blend of 9 inputs, each scored 0–100. Each bar is that input's sub-score; the figure is the points it added to the 100-point composite (weight × sub-score).
- Cash flow +30.0/30.0
- DSCR +10.0/10.0
- 1% rule +7.5/10.0
- ARV discount +7.5/15.0
- Livability +3.2/5.0
- Schools +2.6/10.0
- Rent growth +2.5/5.0
- Condition / age +2.5/5.0
- Appreciation +0.0/10.0
$129,000
🖨 Deal sheet 📄 Offer letter ✓ Due diligence
Listing remarks
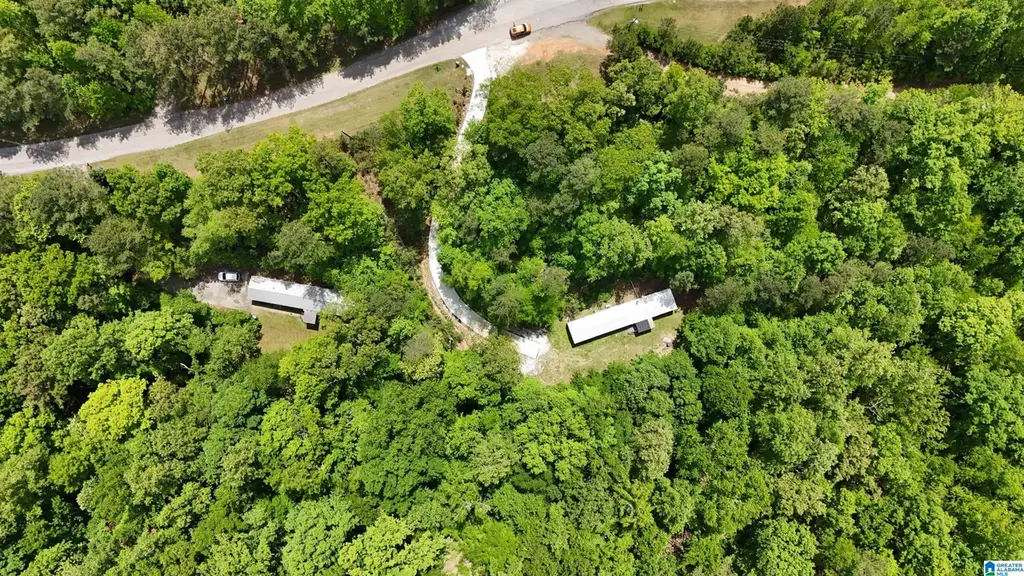
Recently renovated manufactured home situated on approximately 3+ private acres in Pell City. This 3-bedroom, 2-bath home features new appliances, durable laminate flooring throughout, and updated bathrooms with modern finishes, including a walk-in shower in the primary bath. Recent improvements include a new concrete driveway, adding durability and curb appeal. The home offers a functional layout with spacious bedrooms and a comfortable living area, set in a private, wooded setting that provides seclusion while still offering convenient access to town. Located near schools, shopping, and interstate access, this property offers a combination of updates, acreage, and location.
Key facts
- Private acres
- New appliances
- Updated bathrooms
Tags
Property features AI
Finance
- Financial info: Has down payment assistance
- HOA & community: No association fee
Exterior
- Parking: Driveway parking; Off-street parking
- Utilities: Well water; Septic system; Internet service available
- Home design: Single-family existing home; Main-level living (all primary rooms on level 1)
- Construction: Siding (other); Pillars/support foundation
- Exterior features: Heavy treed lot; Deck present; screened deck; No pool; Not waterfront
Interior
- Kitchen: Electric cooktop; Built-in dishwasher; Laminate countertops
- Bedrooms: Three bedrooms, all on the main level
- Flooring: Hardwood; Laminate
- Bathrooms: Two full bathrooms; Tub/shower combo
- Heating & cooling: Heat pump for heating and cooling
- Interior features: Hardwood and laminate flooring; Ceilings: other (see remarks); Woodburning fireplace with insert in the living room; Window treatments remain; No interior built-ins noted
- Laundry & utility: Main-level laundry in a closet; Washer hookup provided; Electric dryer hookup; Electric water heater
Neighborhood map
What this means for you Summary
Snapshot
- This is a 3-bed/2.0-bath manufactured listed at $129k.
Deal economics
- At list price, monthly cash flow is $515 ($6k/yr) — positive.
- The deal already cash-flows at list — no discount required.
- Meets the 1% rule at list price ($2k rent vs $129k).
- Recommended offer: $125k (3.0% below list) — sets the bar for market timing.
- Cap rate 11.1% vs local median 4.9% in Moody — top-decile yield for the area; either an underpriced asset or a hidden risk that comps aren't pricing in. Stress-test before assuming the spread holds.
Location & tenants
- Location reads 63/100 on livability (#191 in AL) — a middle-class / working-renter tenant base. Strengths: cost of living A+, housing A+, crime A; Watch: amenities F, commute F, health & safety F.
- Pell City (town): math 17% / reading 44% proficiency, ranked #67 of 129 in AL (top 52%) — families likely to look elsewhere, expect single-tenant / working-renter base with shorter leases.
- Zoned schools: Eden Elementary School (math 17% / reading 47%, grade F, #331 of 627 statewide, top 57%, 394 students, 68% FRL); Pell City High School (math 17% / reading 21%, grade F, #181 of 305 statewide, top 60%, 1,171 students, 55% FRL).
- Market conditions: 111 active listings in the ZIP; solid renter incomes; 557 units permitted in St. Clair County in 2024 (0 in 5+ unit buildings).
Forward outlook
- Local home prices are declining (-3.0%/yr); year-one equity from $892 of loan paydown is wiped out by about $4k of value loss. Plan a longer hold.
- St. Clair County population projected at +11% by 2050 — modest demand growth; plan on rents tracking national, not racing it.
- At projected returns (-3.0% appreciation + 3.0% rent growth), your $36k cash investment doubles in ~8 years — after that, you're playing with house money.
Negotiation context
- It's been on market 48 days — a 3% lower offer ($125k) is reasonable based on typical stale-listing flexibility.
- Current owner paid $99k; 30% above their basis — modest negotiation headroom, anchor on the comps not their cost.
Risks & watch-outs
- Climate carrying-cost: major wind risk, 27% chance of damaging wind over 30y; moderate wildfire risk; extreme-heat days projected 7→19/yr by 2055 (HVAC capex compounding) — expect insurance premiums to compound above CPI over the hold.
Questions for the listing agent
- It's been on market 48 days. Have you received any prior offers? Is the seller open to a 3% concession, seller financing, or rate buy-down credit?
- Is there a deadline driving the sale (1031 exchange, divorce, estate, relocation)? That informs how much negotiation room exists.
- What's the average days-on-market for RENTAL listings here right now (not sales)? A rising rental-DOM trend means longer vacancies and softer asking-rent achievability than the comps imply.
- What's the recent tenant-quality profile in this submarket — average credit score on applications, eviction rate, late-payment / NSF rate, and stable-employment percentage? A property-management company in the area should have these aggregated.
- How much new for-sale + rental construction is in the pipeline within 1–3 miles? Heavy new supply typically softens prices + rents 12–24 months out; constrained supply supports both.
Investment metrics
- 1% rule
- 1.25% ✓
- Cap rate
- 11.08%
- Cash-on-cash
- 17.11%
- DSCR
- 1.76
- GRM
- 6.6
CMA / ARV
No comps found within radius.
Projected returns pro-forma
-3.0% appreciation · 3.0% rent growth · sell at horizon
- IRR
- 8.4%
- Equity multiple
- 1.33×
- Total profit
- $11,849
- Equity at exit
- $19,234
- IRR
- 17.6%
- Equity multiple
- 2.45×
- Total profit
- $52,341
- Equity at exit
- $11,154
Cash invested: $36,120 (down + closing). Projections, not guarantees.
Landlord ↔ Tenant lean methodology
- Overall (STATE)
- 90 Strongly Landlord-Friendly
- State Alabama
- 90 Strongly Landlord-Friendly · R+15
- County
- — inherits STATE
- City
- — inherits STATE
ZIP-level market 35128
- Active inventory
- 111
- Price-to-rent
- 6.6×
Monthly cashflow live
- Estimated rent
- $1,618 medium interval (Pro) →
- Mortgage (P&I)
- −$676
- Tax from tax record
- −$33 /mo · $398/yr
- Insurance
- −$54
- HOA
- −$0
- Vacancy / Maint / Mgmt
- −$340
- Net cashflow
- $515
Break-even live
UW: 25.0% down · 7.5% · 30yr · 1.5% tax · 5.0% vac · 8.0% maint · 8.0% mgmt
Financing live
Cash to close
- Down payment
- $32,250
- Closing costs
- $3,870
- Reserves months
- —
- Total cash needed
- —
Loan-product check · same deal, 3 products live
Conventional
25% down · 7.5% · 30yr
- Down + closing
- —
- Monthly P&I
- —
- Monthly cashflow
- —
- DSCR
- —
- Eligible?
- —
Personal DTI + credit; lowest rate.
DSCR
20% down · 8.5% · 30yr
- Down + closing
- —
- Monthly P&I
- —
- Monthly cashflow
- —
- DSCR
- —
- Eligible?
- —
No personal income docs; deal must DSCR.
Hard money
10% down · 12.0% · 12mo
- Down + closing
- —
- Monthly P&I
- —
- Monthly cashflow
- —
- DSCR
- —
- Eligible?
- —
Short-term bridge; refi at stabilization.
Listing history 13 events
-
2026-06-10days on market $129,000 Active 48 DOM
-
2026-06-09days on market $129,000 Active 47 DOM
-
2026-06-08days on market $129,000 Active 46 DOM
-
2026-06-07days on market $129,000 Active 45 DOM
-
2026-06-05pricedays on market $129,000 Active 42 DOM
-
2026-06-03days on market $137,500 Active 41 DOM
-
2026-06-02days on market $137,500 Active 40 DOM
-
2026-06-01days on market $137,500 Active 39 DOM
-
2026-05-31days on market $137,500 Active 38 DOM
-
2026-05-20price $137,500
-
2026-05-06price $145,000
-
2026-04-21$155,000 Active
-
2023-03-02soldstatus $99,000
ⓘ Source: listings_history table (triggers on properties + properties_extension) + one-shot
backfill from property_details.listing_events for pre-trigger history.
Tax reassessment forecast AL · Resets to sale price
- Current annual tax
- $398 · $33/mo
- Projected year-2 tax
- $529 · $44/mo
- Expected delta
- +$131/yr (+$11/mo · 32.8%)
ⓘ Screening estimate from a state-policy table — verify with the county assessor before closing.
Climate risk First Street
- Flood 1/10 Low FEMA zone X (unshaded) · 0% chance over 30 yrs
- Wildfire 5/10 Major
- Heat 5/10 Major 7 d/yr ≥107°F today · 19 d/yr by 30 yrs out
- Wind 6/10 Major 27% chance of damaging wind over 30 yrs
- Air quality 3/10 Moderate 2 unhealthy d/yr today · 4 by 30 yrs out
Nearby sold comps map
Loading sold comps map…
Walkable amenities ~0.75 mi
Loading nearby amenities…
Taxation est. · year 1
- Rental income
- $19,420
- − Mortgage interest
- −$7,226
- − Property taxes
- −$398
- − Insurance
- −$645
- − Repairs & maintenance
- −$1,554
- − Management
- −$1,554
- − Depreciation
- −$3,753
- Taxable income
- $4,291
- Est. tax owed @ 24.0%
- −$1,030
- After-tax cash flow
- $5,151/yr
For passive investors: Depreciation is non-cash, so a rental often shows a tax loss while cash-flowing — sheltering income. Rental losses are passive: they offset passive income freely, and up to $25,000/yr can offset ordinary (W-2) income if you actively participate and your MAGI is under $100k (phasing out to $0 by $150k); unused losses carry forward. On sale, claimed depreciation is recaptured at up to 25%, and gains may owe capital-gains tax (a 1031 exchange can defer both). Figures are a year-1 estimate at your 24.0% rate — not tax advice; consult a CPA.
Schools (NCES district)
- District
- Pell City
- NCES district ID
- 0102650
- Math proficiency
- 17% ▼ -30.00%
- Reading proficiency
- 44% ▼ -4.00%
- Median HH income
- $45,051
- Composite
- 26.04/100
- National rank
- #7303
- State rank
- #67 of 129 in AL
Livability — Moody
- Score
- 63/100
- State rank
- #191
- US rank
- #15571
Category grades
Schools grade is shown separately in the Schools card above.
Census & demographics
- County
- Saint Clair County · 54,404 people
- City population
- 12,155
- Metro
- Birmingham-Hoover, AL
- Population (ZIP)
- 10,546
- Household income
- $83,990
- Rent vs Own
- Severe rent burden
- 120.0
Population outlook (St. Clair County) Hauer SSP2
- Today (2025)
- 94,158 people
- By 2030
- 97,008 · +3.0%
- By 2040
- 101,615 · +7.9%
- By 2050
- 104,537 · +11.0%
- By 2075
- 109,350 · +16.1%
- By 2100
- 106,785 · +13.4%
Race, ethnicity, and origin ACS 2023
- Neighborhood character
- Predominantly White (84%)
- Race & ethnicity
- White 84% Black 11% Two or more races 3%
- Common ancestry
- Italian 5% Slovak 2% Serbian 2%
- Foreign-born
- 1% · Canada
- Languages at home
- 99% English-only · Spanish 1%
Political lean MEDSL · St. Clair
- 2024 margin
- Solid R (+64.1) · D 17.6% · R 81.7%
- 2008→2024 swing
- -0.9pp no change · 2008: -63.2pp · 2024: -64.1pp
- All cycles
- 2024: R+64.1 2020: R+64.0 2016: R+68.6 2012: R+66.1 2008: R+63.2
Not yet ingested
- Civics
- —
Market trends
- HPI YoY
- ▼ -106.41%
- Current HPI
- 175.603
- Rent YoY
- —
- Metro
- Birmingham-Hoover, AL
- State GDP YoY
- ▲ 2.94%
- F500 in state
- 4
Industry mix (Fortune 500 HQ in AL)
| Industry | F500 HQs | Revenue |
|---|---|---|
| Financial Services | 1 | $8B |
|
||
| Healthcare | 1 | $5B |
|
||
Price history
+38.9% since first listed4 events — show timeline
- 2026-05-20 Price Changed $137,500 Greater Alabama MLS
- 2026-05-06 Price Changed $145,000 Greater Alabama MLS
- 2026-04-21 Listed $155,000 Greater Alabama MLS
- 2023-03-02 Sold (Public Records) $99,000 Public Records
Property tax history
+7.1%/yrLatest (2025): $398 · +0.0% YoY. Source: county tax records.
Cash-flow waterfall
monthlySold comps — $/sqft
last 12 mo · ≤1 miLoading sold comps…