8140 Fm 513 S · East Tawakoni, TX
Flood risk 1/10 · Minimal
- FEMA flood zone
- X (unshaded)
- Chance of flooding over 30 yrs
- 0.0%
- Est. flood insurance / yr
- $507 – $1,088
Fire risk 3/10 · Minor
- Est. fire insurance / yr
- $1,222 – $2,270
Heat risk 7/10 · Major
- Hot days now (above 110°F)
- 7 days/yr
- Hot days in 30 yrs
- 24 days/yr
Wind risk 6/10 · Moderate
- Chance of severe wind over 30 yrs
- 27.0%
Air-quality risk 2/10 · Minimal
- Unhealthy air days now
- 0 days/yr
- Unhealthy air days in 30 yrs
- 1 days/yr
Risk factors via First Street. Map © Google.
Why this score? — see what drove the D grade
The composite is a weighted blend of 9 inputs, each scored 0–100. Each bar is that input's sub-score; the figure is the points it added to the 100-point composite (weight × sub-score).
- Cash flow +13.1/30.0
- Appreciation +10.0/10.0
- DSCR +3.9/10.0
- 1% rule +3.8/10.0
- Schools +3.7/10.0
- Livability +2.6/5.0
- Rent growth +2.5/5.0
- Condition / age +2.5/5.0
- ARV discount +0.4/15.0
$199,000
🖨 Deal sheet (PDF) 📄 Offer letter ✓ Due diligence
Listing remarks MLS
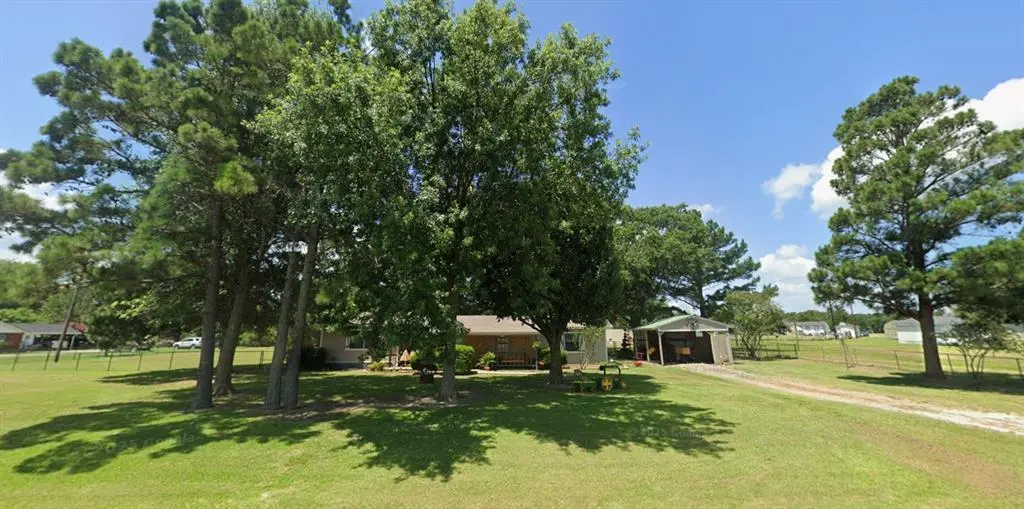
This quaint 2-bedroom, 2-bath home sits on nearly one acre and features a beautiful, park-like setting with towering pine trees and plenty of space to enjoy the outdoors. The home offers a functional layout, solid construction, and traditional exterior—ready for updates and your personal vision. A detached workshop and additional carport provide added flexibility for storage, hobbies, or projects. Conveniently located near Lake Tawakoni State Park, with easy access to hiking, camping, and renowned fishing.
Key facts
- Lake-area location
- Additional carport
- Detached workshop
Tags
Neighborhood map
What this means for you Summary
Snapshot
- This is a 2-bed/2.0-bath single-family listed at $199k.
Deal economics
- At list price, monthly cash flow is $-8 ($-99/yr) — negative.
- To cash-flow at today's rent, offer at most $198k (0.7% below list).
- To meet the 1% rule (rent ≥ 1% of price), the offer needs to be $175k (12.1% below list).
- Recommended offer: $175k (12.1% below list) — sets the bar for 1% rule.
- Cap rate 6.2% vs local median 4.5% in East Tawakoni — top-decile yield for the area; either an underpriced asset or a hidden risk that comps aren't pricing in. Stress-test before assuming the spread holds.
Location & tenants
- Location reads 52/100 on livability (#1,455 in TX) — a working-class tenant base; expect higher turnover. Strengths: cost of living A+, housing A+; Watch: crime D, amenities F, commute F.
- Lone Oak ISD (rural): math 42% / reading 43% proficiency, ranked #310 of 826 in TX (top 38%) — families likely to look elsewhere, expect single-tenant / working-renter base with shorter leases.
- Zoned schools: D C Cannon El (765 students, 81% FRL); C B Thompson Middle (math 33% / reading 36%, grade F, #858 of 1,662 statewide, top 54%, 628 students, 77% FRL); Wh Ford H S (math 17% / reading 44%, grade F, #1,085 of 1,632 statewide, top 67%, 786 students, 68% FRL) — zoned schools average 75% FRL vs 38% district-wide (37 pts higher); higher-poverty schools than district average — tighter screening recommended.
- Market conditions: 115 active listings in the ZIP; 1 comparable units currently listed for rent nearby; 1,289 units permitted in Hunt County in 2024 (527 in 5+ unit buildings).
Forward outlook
- In year one you build about $21k of equity ($1k loan paydown + $20k appreciation (10.0% local appreciation)).
- Hunt County population projected at +15% by 2050 — modest demand growth; plan on rents tracking national, not racing it.
- At projected returns (10.0% appreciation + 3.0% rent growth), your $56k cash investment doubles in ~3 years — after that, you're playing with house money.
- By year 2, paydown + projected appreciation supports a ~$34k cash-out refi (75% LTV) — recoverable capital for the next deal without selling this one.
Negotiation context
- It's been on market 91 days — a 9% lower offer ($181k) is reasonable based on typical stale-listing flexibility.
Risks & watch-outs
- Climate carrying-cost: major wind risk, 27% chance of damaging wind over 30y; extreme-heat days projected 7→24/yr by 2055 (HVAC capex compounding) — expect insurance premiums to compound above CPI over the hold.
Questions for the listing agent
- What do current leases actually rent for vs. the listed asking? Can we see a recent rent roll and the last 12 months of T-12 income?
- It's been on market 91 days. Have you received any prior offers? Is the seller open to a 12% concession, seller financing, or rate buy-down credit?
- Why hasn't it sold? Are there any deal-killer items the seller is aware of (foundation, flood, title, zoning, code violations)?
- Is there a deadline driving the sale (1031 exchange, divorce, estate, relocation)? That informs how much negotiation room exists.
- Schools are F-rated, which usually means shorter tenancies and higher turnover. Who's the typical renter profile here, and what's been the actual vacancy rate?
- Crime grade is D in this area — have there been break-ins, vandalism, or insurance claims at this property in the last 3 years? What carrier currently insures it and at what premium?
- The area grade is low — what's the realistic commute time and amenity access for the typical tenant pool here? Any planned neighborhood developments (good or bad) we should know about?
- What's the average days-on-market for RENTAL listings here right now (not sales)? A rising rental-DOM trend means longer vacancies and softer asking-rent achievability than the comps imply.
- What's the recent tenant-quality profile in this submarket — average credit score on applications, eviction rate, late-payment / NSF rate, and stable-employment percentage? A property-management company in the area should have these aggregated.
- How much new for-sale + rental construction is in the pipeline within 1–3 miles? Heavy new supply typically softens prices + rents 12–24 months out; constrained supply supports both.
Investment metrics
- 1% rule
- 0.88% ✗
- Cap rate
- 6.24%
- Cash-on-cash
- -0.18%
- DSCR
- 0.99
- GRM
- 9.5
CMA / ARV
- ARV (median comp)
- $171,918
- List price
- $199,000
- Delta
- 15.75%
- Verdict
- OVERPRICED
- Comps
- 20 within 1.0 mi
Show comp detail 4 sales within ~0.75 mi
| Address | Dist | Beds/Ba | Sqft | Sold | Price | $/sf | Match |
|---|---|---|---|---|---|---|---|
| 4601 County Road 3416 | 0.47mi | 2/1.0 | 1,144 (-3%) | 10mo | $65,000 | $57 | 62 |
| 8095 County Road 3415 | 0.29mi | 3/1.5 (+1) | 1,282 (+9%) | 9mo | $85,900 | $67 | 57 |
| 4230 Pueblo | 0.46mi | 3/2.0 (+1) | 1,056 (-10%) | 8mo | $89,900 | $85 | 49 |
| 7725 Cochise | 0.46mi | 3/2.0 (+1) | 1,120 (-5%) | 20mo | $175,000 | $156 | 49 |
Match score weights: distance 35% · size 25% · config 20% · recency 20%. Top-matched comps best support the ARV.
Projected returns pro-forma
10.0% appreciation · 3.0% rent growth · sell at horizon
- IRR
- 24.2%
- Equity multiple
- 2.94×
- Total profit
- $107,890
- Equity at exit
- $179,275
- IRR
- 21.4%
- Equity multiple
- 6.71×
- Total profit
- $318,205
- Equity at exit
- $386,613
Cash invested: $55,720 (down + closing). Projections, not guarantees.
Landlord ↔ Tenant lean methodology
- Overall (STATE)
- 87 Strongly Landlord-Friendly
- State Texas
- 87 Strongly Landlord-Friendly · R+5
- County
- — inherits STATE
- City
- — inherits STATE
ZIP-level market 75453
- Home prices YoY
- 25.2%
- Active inventory
- 115
- Price-to-rent
- 9.5×
Monthly cashflow live
- Estimated rent
- $1,750 medium interval (Pro) →
- Mortgage (P&I)
- −$1,044
- Tax from tax record
- −$264 /mo · $3,171/yr
- Insurance
- −$83
- HOA
- −$0
- Vacancy / Maint / Mgmt
- −$368
- Net cashflow
- $-8
Break-even live
Sensitivity live
| Price | -10% $104 | -5% $48 | +0% $-8 | +5% $-65 | +10% $-121 |
|---|---|---|---|---|---|
| Rent | -10% $-147 | -5% $-77 | +0% $-8 | +5% $61 | +10% $130 |
| Rate | -1.0pp $92 | -0.5pp $42 | base $-8 | +0.5pp $-60 | +1.0pp $-112 |
UW: 25.0% down · 7.5% · 30yr · 1.5% tax · 5.0% vac · 8.0% maint · 8.0% mgmt
Financing live
Cash to close
- Down payment
- $49,750
- Closing costs
- $5,970
- Reserves months
- —
- Total cash needed
- —
Loan-product check · same deal, 3 products live
Conventional
25% down · 7.5% · 30yr
- Down + closing
- —
- Monthly P&I
- —
- Monthly cashflow
- —
- DSCR
- —
- Eligible?
- —
Personal DTI + credit; lowest rate.
DSCR
20% down · 8.5% · 30yr
- Down + closing
- —
- Monthly P&I
- —
- Monthly cashflow
- —
- DSCR
- —
- Eligible?
- —
No personal income docs; deal must DSCR.
Hard money
10% down · 12.0% · 12mo
- Down + closing
- —
- Monthly P&I
- —
- Monthly cashflow
- —
- DSCR
- —
- Eligible?
- —
Short-term bridge; refi at stabilization.
Rent comps 1 comps
| Address | Beds | Baths | Sqft | Rent | $/sqft | DOM | Units | Dist |
|---|---|---|---|---|---|---|---|---|
| 469 Rs County Road 1605 Unit 1605 Point, TX | 2.0 | 1.5 | 900 | $1,750 | $1.94 | 46d | 1 | 0.79mi |
Listing history 19 events
-
2026-06-21days on market $199,000 Active 91 DOM
-
2026-06-18days on market $199,000 Active 88 DOM
-
2026-06-17days on market $199,000 Active 87 DOM
-
2026-06-16days on market $199,000 Active 86 DOM
-
2026-06-15days on market $199,000 Active 85 DOM
-
2026-06-13pricedays on market $199,000 Active 83 DOM
-
2026-06-09days on market $209,000 Active 79 DOM
-
2026-06-08days on market $209,000 Active 78 DOM
-
2026-06-07days on market $209,000 Active 77 DOM
-
2026-06-04days on market $209,000 Active 74 DOM
-
2026-06-03days on market $209,000 Active 73 DOM
-
2026-06-02days on market $209,000 Active 72 DOM
-
2026-06-01days on market $209,000 Active 71 DOM
-
2026-05-31days on market $209,000 Active 70 DOM
-
2026-05-11price $209,000 519-char remark
Show marketing remark (519 chars)
This quaint 2-bedroom, 2-bath home sits on nearly one acre and features a beautiful, park-like setting with towering pine trees and plenty of space to enjoy the outdoors. The home offers a functional layout, solid construction, and traditional exterior—ready for updates and your personal vision. A detached workshop and additional carport provide added flexibility for storage, hobbies, or projects. Conveniently located near Lake Tawakoni State Park, with easy access to hiking, camping, and renowned fishing.
-
2026-04-05price $229,000 519-char remark
Show marketing remark (519 chars)
This quaint 2-bedroom, 2-bath home sits on nearly one acre and features a beautiful, park-like setting with towering pine trees and plenty of space to enjoy the outdoors. The home offers a functional layout, solid construction, and traditional exterior—ready for updates and your personal vision. A detached workshop and additional carport provide added flexibility for storage, hobbies, or projects. Conveniently located near Lake Tawakoni State Park, with easy access to hiking, camping, and renowned fishing.
-
2026-03-22$249,000 Active 519-char remark
Show marketing remark (519 chars)
This quaint 2-bedroom, 2-bath home sits on nearly one acre and features a beautiful, park-like setting with towering pine trees and plenty of space to enjoy the outdoors. The home offers a functional layout, solid construction, and traditional exterior—ready for updates and your personal vision. A detached workshop and additional carport provide added flexibility for storage, hobbies, or projects. Conveniently located near Lake Tawakoni State Park, with easy access to hiking, camping, and renowned fishing.
-
2018-09-21soldstatus
-
1996-05-22soldstatus
ⓘ Source: listings_history table (triggers on properties + properties_extension) + one-shot
backfill from property_details.listing_events for pre-trigger history.
Tax reassessment forecast TX · Resets to sale price
- Current annual tax
- $3,171 · $264/mo
- Projected year-2 tax
- $3,642 · $303/mo
- Expected delta
- +$470/yr (+$39/mo · 14.8%)
ⓘ Screening estimate from a state-policy table — verify with the county assessor before closing.
Climate risk First Street
- Flood 1/10 Low FEMA zone X (unshaded) · 0% chance over 30 yrs
- Wildfire 3/10 Moderate
- Heat 7/10 Severe 7 d/yr ≥110°F today · 24 d/yr by 30 yrs out
- Wind 6/10 Major 27% chance of damaging wind over 30 yrs
- Air quality 2/10 Low 0 unhealthy d/yr today · 1 by 30 yrs out
Nearby sold comps map
Loading sold comps map…
Walkable amenities ~0.75 mi
Loading nearby amenities…
Taxation est. · year 1
- Rental income
- $21,000
- − Mortgage interest
- −$11,147
- − Property taxes
- −$3,171
- − Insurance
- −$995
- − Repairs & maintenance
- −$1,680
- − Management
- −$1,680
- − Depreciation
- −$5,789
- Taxable loss
- −$3,462
- Est. tax savings @ 24.0%
- +$831
- After-tax cash flow
- $732/yr
For passive investors: Depreciation is non-cash, so a rental often shows a tax loss while cash-flowing — sheltering income. Rental losses are passive: they offset passive income freely, and up to $25,000/yr can offset ordinary (W-2) income if you actively participate and your MAGI is under $100k (phasing out to $0 by $150k); unused losses carry forward. On sale, claimed depreciation is recaptured at up to 25%, and gains may owe capital-gains tax (a 1031 exchange can defer both). Figures are a year-1 estimate at your 24.0% rate — not tax advice; consult a CPA.
Schools (NCES district)
- District
- Lone Oak ISD
- NCES district ID
- 4828020
- Math proficiency
- 42% ▼ -9.00%
- Reading proficiency
- 43% ▼ -7.00%
- Median HH income
- $51,628
- Composite
- 36.72/100
- National rank
- #4593
- State rank
- #310 of 826 in TX
Livability — East Tawakoni
- Score
- 52/100
- State rank
- #1455
- US rank
- #24873
Category grades
Schools grade is shown separately in the Schools card above.
Census & demographics
- Population (ZIP)
- 2,832
Population outlook (Hunt County) Hauer SSP2
- Today (2025)
- 97,090 people
- By 2030
- 100,452 · +3.5%
- By 2040
- 106,544 · +9.7%
- By 2050
- 111,218 · +14.6%
- By 2075
- 121,695 · +25.3%
- By 2100
- 123,683 · +27.4%
Race, ethnicity, and origin ACS 2023
- Neighborhood character
- Predominantly White (73%)
- Race & ethnicity
- White 73% Hispanic / Latino 17% Two or more races 7% Black 1%
- Hispanic origin (detail)
- Mexican 15%
- Common ancestry
- Italian 2% Portuguese 1% Romanian 1%
- Foreign-born
- 7% · Canada
- Languages at home
- 93% English-only · Spanish 6% Other Asian/Pacific 1%
Political lean MEDSL · Hunt
- 2024 margin
- Solid R (+55.5) · D 21.9% · R 77.4%
- 2008→2024 swing
- -14.9pp toward R · 2008: -40.6pp · 2024: -55.5pp
- All cycles
- 2024: R+55.5 2020: R+52.5 2016: R+56.3 2012: R+51.2 2008: R+40.6
Not yet ingested
- Civics
- —
Market trends
- HPI YoY
- ▲ 51.45%
- Current HPI
- 255.6167
- Rent YoY
- —
- Metro
- —
- State GDP YoY
- ▲ 3.95%
- F500 in state
- 110
Industry mix (Fortune 500 HQ in TX)
| Industry | F500 HQs | Revenue |
|---|---|---|
| Energy | 16 | $1,198B |
|
||
| Technology | 5 | $198B |
|
||
| Engineering / Construction | 4 | $72B |
|
||
| Energy Services | 3 | $60B |
|
||
| Utilities | 3 | $41B |
|
||
| Healthcare | 2 | $330B |
|
||
Price history
-16.1% since first listed5 events — show timeline
- 2026-05-11 Price Changed $209,000 NTREIS
- 2026-04-05 Price Changed $229,000 NTREIS
- 2026-03-22 Listed $249,000 NTREIS
- 2018-09-21 Sold (Public Records) — Public Records
- 1996-05-22 Sold (Public Records) — Public Records
Property tax history
+7.2%/yrLatest (2025): $3,171 · +17.4% YoY. Source: county tax records.
Cash-flow waterfall
monthlySold comps — $/sqft
last 12 mo · ≤1 miLoading sold comps…