6885 PR Pr · Lubbock, TX
Flood risk No data
- FEMA flood zone
- —
- Chance of flooding over 30 yrs
- —
- Est. flood insurance / yr
- —
Fire risk No data
- Est. fire insurance / yr
- —
Heat risk No data
- Hot days now (above threshold)
- —
- Hot days in 30 yrs
- —
Wind risk No data
- Chance of severe wind over 30 yrs
- —
Air-quality risk No data
- Unhealthy air days now
- —
- Unhealthy air days in 30 yrs
- —
Risk factors via First Street. Map © Google.
Why this score? — see what drove the A- grade
The composite is a weighted blend of 9 inputs, each scored 0–100. Each bar is that input's sub-score; the figure is the points it added to the 100-point composite (weight × sub-score).
- Cash flow +30.0/30.0
- DSCR +10.0/10.0
- Appreciation +10.0/10.0
- 1% rule +9.4/10.0
- ARV discount +7.5/15.0
- Schools +4.4/10.0
- Livability +4.0/5.0
- Condition / age +4.0/5.0
- Rent growth +2.5/5.0
$135,000
🖨 Deal sheet 📄 Offer letter ✓ Due diligence
Listing remarks
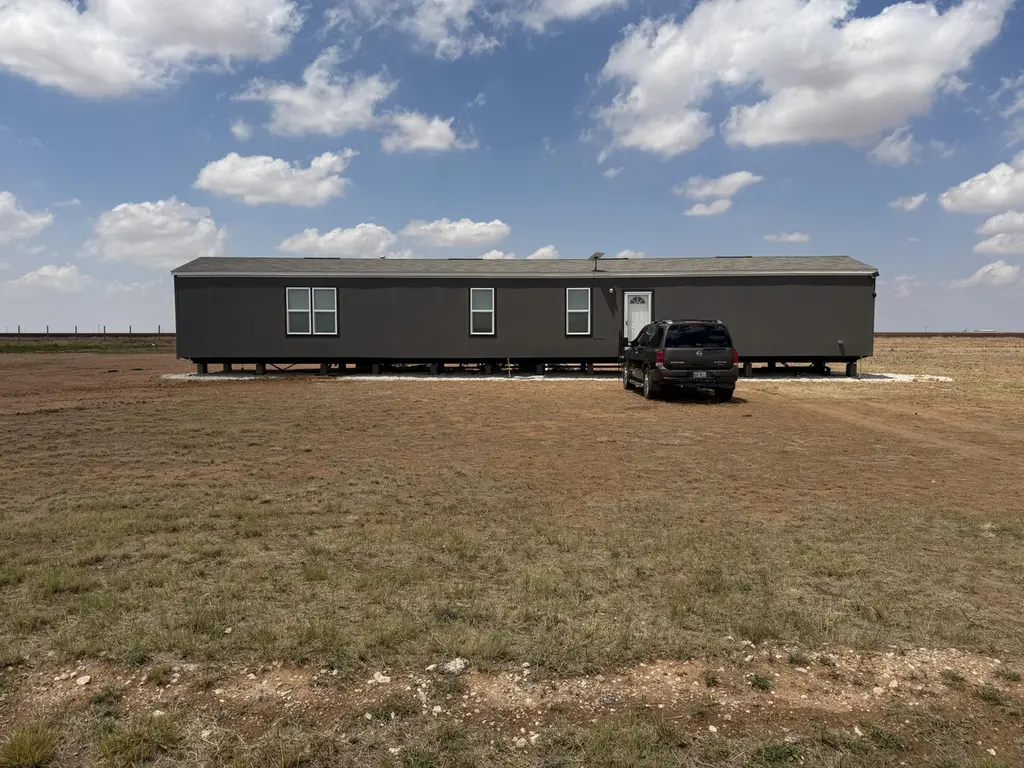
Welcome to peaceful country living with the convenience of city access! This well-maintained manufactured home sits on approximately 1 acre, offering plenty of space for outdoor activities, animals, gardening, or future improvements. The home is anchored and affixed, making it eligible for FHA financing for qualified buyers. Property features include a private well and septic system, helping keep utility costs low while providing added independence. Enjoy the quiet surroundings, open skies, and room to spread out without sacrificing comfort. Whether you're looking for your first home, an investment opportunity, or a place to enjoy country life, this property offers endless potential!
Key facts
- Plenty of space
- Private well
- Septic system
Tags
Property features AI
Exterior
- Parking: Open parking
- Utilities: Dirt road access; Unimproved road frontage; 1.0 acre lot
- Home design: Manufactured home; Single-story residence
- Construction: See remarks for construction materials; See remarks for foundation details; Built as a manufactured home
- Exterior features: Composition roof; Other exterior features
Interior
- Bathrooms: 2 full bathrooms
- Heating & cooling: Central heating; Central air; Ceiling fan(s) for cooling
- Interior features: Ceiling fans; Open floor plan; Recessed lighting; See remarks
- Laundry & utility: Laundry room
Neighborhood map
What this means for you Summary
Snapshot
- This is a 3-bed/2.0-bath manufactured listed at $135k. Condition is rated good.
Deal economics
- At list price, monthly cash flow is $600 ($7k/yr) — positive.
- The deal already cash-flows at list — no discount required.
- Meets the 1% rule at list price ($2k rent vs $135k).
- Recommended offer: $133k (1.5% below list) — sets the bar for market timing.
Location & tenants
- Location reads 80/100 on livability (#37 in TX, #1,749 nationally) — a professional / high-income tenant draw. Strengths: commute A+, cost of living A+, housing A+; Watch: employment C-, schools D+, crime F.
- Frenship ISD (urban): math 47% / reading 54% proficiency, ranked #162 of 826 in TX (top 20%) — acceptable for families but not a draw, mixed tenant base, ~2y average lease.
- Market conditions: 116 active listings in the ZIP; 7 units permitted in Hockley County in 2024 (0 in 5+ unit buildings).
Forward outlook
- In year one you build about $14k of equity ($933 loan paydown + $14k appreciation (10.0% local appreciation)).
- Hockley County population projected at +21% by 2050 — long-run rental-demand tailwind backs the buy-and-hold thesis.
- At projected returns (10.0% appreciation + 3.0% rent growth), your $38k cash investment doubles in ~2 years — after that, you're playing with house money.
- By year 3, paydown + projected appreciation supports a ~$37k cash-out refi (75% LTV) — recoverable capital for the next deal without selling this one.
Negotiation context
- It's been on market 21 days — a 2% lower offer ($133k) is reasonable based on typical stale-listing flexibility.
Questions for the listing agent
- Is there a deadline driving the sale (1031 exchange, divorce, estate, relocation)? That informs how much negotiation room exists.
- Schools are D-rated, which usually means shorter tenancies and higher turnover. Who's the typical renter profile here, and what's been the actual vacancy rate?
- Crime grade is F in this area — have there been break-ins, vandalism, or insurance claims at this property in the last 3 years? What carrier currently insures it and at what premium?
- What's the average days-on-market for RENTAL listings here right now (not sales)? A rising rental-DOM trend means longer vacancies and softer asking-rent achievability than the comps imply.
- What's the recent tenant-quality profile in this submarket — average credit score on applications, eviction rate, late-payment / NSF rate, and stable-employment percentage? A property-management company in the area should have these aggregated.
- How much new for-sale + rental construction is in the pipeline within 1–3 miles? Heavy new supply typically softens prices + rents 12–24 months out; constrained supply supports both.
Investment metrics
- 1% rule
- 1.44% ✓
- Cap rate
- 11.62%
- Cash-on-cash
- 19.04%
- DSCR
- 1.85
- GRM
- 5.8
CMA / ARV
No comps found within radius.
Projected returns pro-forma
10.0% appreciation · 3.0% rent growth · sell at horizon
- IRR
- 38.5%
- Equity multiple
- 3.96×
- Total profit
- $111,746
- Equity at exit
- $121,619
- IRR
- 33.1%
- Equity multiple
- 8.91×
- Total profit
- $299,097
- Equity at exit
- $262,275
Cash invested: $37,800 (down + closing). Projections, not guarantees.
Landlord ↔ Tenant lean methodology
- Overall (STATE)
- 87 Strongly Landlord-Friendly
- State Texas
- 87 Strongly Landlord-Friendly · R+5
- County
- — inherits STATE
- City
- — inherits STATE
ZIP-level market 79363
- Home prices YoY
- 7.3%
- Active inventory
- 116
- Price-to-rent
- 5.8×
Monthly cashflow live
- Estimated rent
- $1,940 medium interval (Pro) →
- Mortgage (P&I)
- −$708
- Tax est. 1.5%
- −$169 /mo · $2,025/yr
- Insurance
- −$56
- HOA
- −$0
- Vacancy / Maint / Mgmt
- −$407
- Net cashflow
- $600
Break-even live
UW: 25.0% down · 7.5% · 30yr · 1.5% tax · 5.0% vac · 8.0% maint · 8.0% mgmt
Financing live
Cash to close
- Down payment
- $33,750
- Closing costs
- $4,050
- Reserves months
- —
- Total cash needed
- —
Loan-product check · same deal, 3 products live
Conventional
25% down · 7.5% · 30yr
- Down + closing
- —
- Monthly P&I
- —
- Monthly cashflow
- —
- DSCR
- —
- Eligible?
- —
Personal DTI + credit; lowest rate.
DSCR
20% down · 8.5% · 30yr
- Down + closing
- —
- Monthly P&I
- —
- Monthly cashflow
- —
- DSCR
- —
- Eligible?
- —
No personal income docs; deal must DSCR.
Hard money
10% down · 12.0% · 12mo
- Down + closing
- —
- Monthly P&I
- —
- Monthly cashflow
- —
- DSCR
- —
- Eligible?
- —
Short-term bridge; refi at stabilization.
Listing history 18 events
-
2026-06-18days on market $135,000 Active 21 DOM
-
2026-06-18price $135,000 Active 20 DOM
-
2026-06-17days on market $140,000 Active 20 DOM
-
2026-06-16days on market $140,000 Active 19 DOM
-
2026-06-15pricedays on market $140,000 Active 18 DOM
-
2026-06-13days on market $145,000 Active 15 DOM
-
2026-06-10days on market $145,000 Active 13 DOM
-
2026-06-09days on market $145,000 Active 12 DOM
-
2026-06-09price $145,000 Active 11 DOM
-
2026-06-08days on market $150,000 Active 11 DOM
-
2026-06-07days on market $150,000 Active 10 DOM
-
2026-06-05days on market $150,000 Active 7 DOM
-
2026-06-03days on market $150,000 Active 6 DOM
-
2026-06-02days on market $150,000 Active 5 DOM
-
2026-06-01days on market $150,000 Active 4 DOM
-
2026-05-31days on market $150,000 Active 3 DOM
-
2026-05-30days on market $150,000 Active 2 DOM
-
2026-05-28$150,000 Active
ⓘ Source: listings_history table (triggers on properties + properties_extension) + one-shot
backfill from property_details.listing_events for pre-trigger history.
Nearby sold comps map
Loading sold comps map…
Walkable amenities ~0.75 mi
Loading nearby amenities…
Taxation est. · year 1
- Rental income
- $23,280
- − Mortgage interest
- −$7,562
- − Property taxes
- −$2,025
- − Insurance
- −$675
- − Repairs & maintenance
- −$1,862
- − Management
- −$1,862
- − Depreciation
- −$3,927
- Taxable income
- $5,366
- Est. tax owed @ 24.0%
- −$1,288
- After-tax cash flow
- $5,908/yr
For passive investors: Depreciation is non-cash, so a rental often shows a tax loss while cash-flowing — sheltering income. Rental losses are passive: they offset passive income freely, and up to $25,000/yr can offset ordinary (W-2) income if you actively participate and your MAGI is under $100k (phasing out to $0 by $150k); unused losses carry forward. On sale, claimed depreciation is recaptured at up to 25%, and gains may owe capital-gains tax (a 1031 exchange can defer both). Figures are a year-1 estimate at your 24.0% rate — not tax advice; consult a CPA.
Condition & rehab AI · 13 photos
This well-maintained manufactured home is in good condition with modern finishes and a good foundation. It's ready for a new owner to move in and enjoy the peaceful country living.
Value-add opportunities
- Both Painting exterior siding — Enhances curb appeal and value
- Both Landscaping and curb appeal — Improves curb appeal and value
- Both Interior touch-ups — Freshens up the interior and enhances value
Renovation cost estimate screening
Value-add ROI direction
- Both Painting exterior siding — Enhances curb appeal and value ↑
- Both Landscaping and curb appeal — Improves curb appeal and value ↑
- Both Interior touch-ups — Freshens up the interior and enhances value ↑
ⓘ Cost ranges are severity-bucket heuristics (US national rule-of-thumb). Get contractor quotes + a written scope before underwriting a rehab budget.
Schools (NCES district)
- District
- Frenship ISD
- NCES district ID
- 4819830
- Math proficiency
- 47% ▼ -8.00%
- Reading proficiency
- 54% ▬ 0.00%
- Median HH income
- $54,376
- Composite
- 43.59/100
- National rank
- #2976
- State rank
- #162 of 826 in TX
Livability — Lubbock
- Score
- 80/100
- State rank
- #37
- US rank
- #1749
Category grades
Schools grade is shown separately in the Schools card above.
Census & demographics
- City population
- 283,030
- Population (ZIP)
- 5,831
Population outlook (Hockley County) Hauer SSP2
- Today (2025)
- 25,295 people
- By 2030
- 26,230 · +3.7%
- By 2040
- 28,268 · +11.8%
- By 2050
- 30,536 · +20.7%
- By 2075
- 36,867 · +45.7%
- By 2100
- 40,662 · +60.8%
Race, ethnicity, and origin ACS 2023
- Neighborhood character
- Predominantly White (69%)
- Race & ethnicity
- White 69% Hispanic / Latino 27% Two or more races 20%
- Hispanic origin (detail)
- Mexican 23%
- Common ancestry
- Lithuanian 5% Slovak 3% Romanian 2%
- Foreign-born
- 3% · Canada
- Languages at home
- 84% English-only · Spanish 16%
Political lean MEDSL · Hockley
- 2024 margin
- Solid R (+66.3) · D 16.6% · R 82.8%
- 2008→2024 swing
- -14.0pp toward R · 2008: -52.3pp · 2024: -66.3pp
- All cycles
- 2024: R+66.3 2020: R+62.4 2016: R+62.3 2012: R+57.0 2008: R+52.3
Not yet ingested
- Civics
- —
Market trends
- HPI YoY
- ▲ 19.76%
- Current HPI
- 289.7445
- Rent YoY
- —
- Metro
- —
- State GDP YoY
- ▲ 3.95%
- F500 in state
- 110
Industry mix (Fortune 500 HQ in TX)
| Industry | F500 HQs | Revenue |
|---|---|---|
| Energy | 16 | $1,198B |
|
||
| Technology | 5 | $198B |
|
||
| Engineering / Construction | 4 | $72B |
|
||
| Energy Services | 3 | $60B |
|
||
| Utilities | 3 | $41B |
|
||
| Healthcare | 2 | $330B |
|
||
Price history
1 event — show timeline
- 2026-05-28 Listed $150,000 LARMLS
Cash-flow waterfall
monthlySold comps — $/sqft
last 12 mo · ≤1 miLoading sold comps…