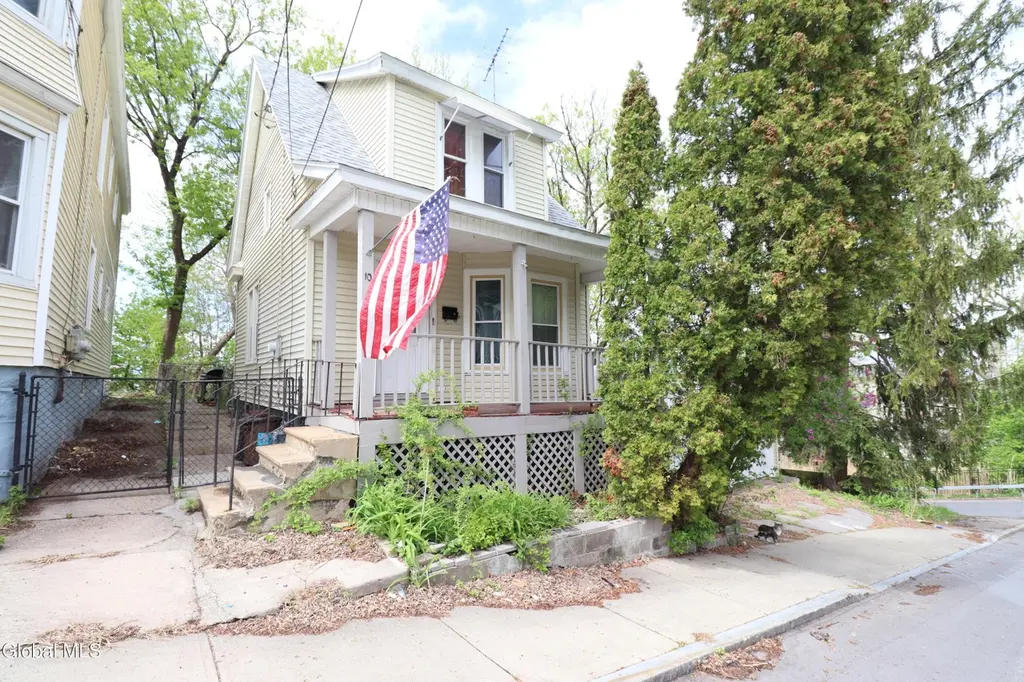
10 Daggett Ter · Schenectady, NY
Flood risk 1/10 · Minimal
- FEMA flood zone
- X (unshaded)
- Chance of flooding over 30 yrs
- 0.0%
- Est. flood insurance / yr
- $473 – $860
Fire risk 3/10 · Minor
- Est. fire insurance / yr
- $691 – $1,283
Heat risk 4/10 · Minor
- Hot days now (above 96°F)
- 7 days/yr
- Hot days in 30 yrs
- 16 days/yr
Wind risk 2/10 · Minimal
- Chance of severe wind over 30 yrs
- 4.0%
Air-quality risk 1/10 · Minimal
- Unhealthy air days now
- 0 days/yr
- Unhealthy air days in 30 yrs
- 0 days/yr
Risk factors via First Street. Map © Google.
Why this score? — see what drove the C- grade
The composite is a weighted blend of 9 inputs, each scored 0–100. Each bar is that input's sub-score; the figure is the points it added to the 100-point composite (weight × sub-score).
- Cash flow +13.4/30.0
- Appreciation +10.0/10.0
- ARV discount +5.8/15.0
- 1% rule +4.9/10.0
- DSCR +4.0/10.0
- Livability +3.9/5.0
- Schools +3.0/10.0
- Rent growth +2.5/5.0
- Condition / age +2.5/5.0
$145,900
🖨 Deal sheet 📄 Offer letter ✓ Due diligence
Listing remarks
Convenient city location, walking distance to downtown and bus line. 3 Bedrooms 1 Full bath, living room, dining room, thee bedrooms on the second floor and full bath. 2 car detached garage with covered breezeway.
Key facts
- 4,791 sq ft lot
- 2 garage spots
- Built 1920
Property features AI
Exterior
- Parking: 2 total parking spaces; 2-car garage; Driveway
- Utilities: 150 Amp electric service with circuit breakers; Public water; Public sewer
- Home design: Single family residence; Living area approximately 800
- Construction: Block construction
- Exterior features: Front porch; Shingle (asphalt) roof
Interior
- Kitchen: Range; Refrigerator
- Bedrooms: Three bedrooms on the second floor
- Flooring: Hardwood flooring; Linoleum flooring
- Bathrooms: One full bathroom on the second floor
- Heating & cooling: Hot water heating; Natural gas heating
- Interior features: 7 total rooms; Full, walk-out basement; Range; Refrigerator
- Laundry & utility: Laundry in the basement
Neighborhood map
What this means for you Summary
Snapshot
- This is a 3-bed/1.0-bath single-family listed at $146k.
Deal economics
- At list price, monthly cash flow is $4 ($46/yr) — positive.
- The deal already cash-flows at list — no discount required.
- To meet the 1% rule (rent ≥ 1% of price), the offer needs to be $145k (0.7% below list).
- Recommended offer: $145k (0.7% below list) — sets the bar for 1% rule.
Location & tenants
- Location reads 78/100 on livability (#167 in NY, #2,597 nationally) — a middle-class / working-renter tenant base. Strengths: commute A+, health & safety A+, cost of living A; Watch: employment D+, crime F.
- Schenectady City School District (urban): math 38% / reading 34% proficiency, ranked #556 of 590 in NY (top 94%) — families likely to look elsewhere, expect single-tenant / working-renter base with shorter leases; 65% free/reduced lunch — lower-income household profile, screen leases tightly.
- Zoned schools: Schenectady High School (math 75% / reading 90%, grade A, #446 of 1,100 statewide, top 41%, 2,743 students, 71% FRL).
- Zoned-school proficiency averages 82% at this address vs 36% district-wide (+46 pts) — the actual schools serving this property are materially stronger than the Schenectady City School District average implies; a family-tenant draw the district grade alone would hide.
- Market conditions: 33 active listings in the ZIP; 13 comparable units currently listed for rent nearby; rentals at typical pace (median 19d on market — plan ~3-4 weeks tenant-placement turnaround); 154 units permitted in Schenectady County in 2024 (54 in 5+ unit buildings).
Forward outlook
- In year one you build about $16k of equity ($1k loan paydown + $15k appreciation (10.0% local appreciation)).
- Schenectady County population projected to shrink 4% by 2050 — rents likely to lag national; underwrite the cash flow, not the appreciation.
- At projected returns (10.0% appreciation + 3.0% rent growth), your $41k cash investment doubles in ~3 years — after that, you're playing with house money.
- By year 3, paydown + projected appreciation supports a ~$39k cash-out refi (75% LTV) — recoverable capital for the next deal without selling this one.
Negotiation context
- Only 10 days on market — expect competitive offers; lowballing is unlikely to land.
Risks & watch-outs
- Watch-outs: property tax is 2.6% of price; built in 1920 — expect roof / HVAC / electrical / plumbing capex.
Questions for the listing agent
- Built in 1920 — when were the roof, HVAC, electrical panel, plumbing, and water heater last replaced?
- Property tax is high relative to price — has the assessment been appealed recently, and will the sale trigger a re-assessment?
- Is there a deadline driving the sale (1031 exchange, divorce, estate, relocation)? That informs how much negotiation room exists.
- Crime grade is F in this area — have there been break-ins, vandalism, or insurance claims at this property in the last 3 years? What carrier currently insures it and at what premium?
- What's the average days-on-market for RENTAL listings here right now (not sales)? A rising rental-DOM trend means longer vacancies and softer asking-rent achievability than the comps imply.
- What's the recent tenant-quality profile in this submarket — average credit score on applications, eviction rate, late-payment / NSF rate, and stable-employment percentage? A property-management company in the area should have these aggregated.
- How much new for-sale + rental construction is in the pipeline within 1–3 miles? Heavy new supply typically softens prices + rents 12–24 months out; constrained supply supports both.
Investment metrics
- 1% rule
- 0.99% ✗
- Cap rate
- 6.32%
- Cash-on-cash
- 0.11%
- DSCR
- 1.00
- GRM
- 8.4
CMA / ARV
- ARV (median comp)
- $140,575
- List price
- $145,900
- Delta
- 3.79%
- Verdict
- FAIR
- Comps
- 20 within 1.0 mi
Show comp detail 1 sale within ~0.75 mi
| Address | Dist | Beds/Ba | Sqft | Sold | Price | $/sf | Match |
|---|---|---|---|---|---|---|---|
| 538 Schenectady St | 0.58mi | 2/1.5 (-1) | 768 (-3%) | 11mo | $5,000 | $7 | 52 |
Match score weights: distance 35% · size 25% · config 20% · recency 20%. Top-matched comps best support the ARV.
Projected returns pro-forma
10.0% appreciation · 3.0% rent growth · sell at horizon
- IRR
- 24.4%
- Equity multiple
- 2.95×
- Total profit
- $79,807
- Equity at exit
- $131,438
- IRR
- 21.6%
- Equity multiple
- 6.75×
- Total profit
- $235,034
- Equity at exit
- $283,452
Cash invested: $40,852 (down + closing). Projections, not guarantees.
Landlord ↔ Tenant lean methodology
- Overall (STATE)
- 15 Strongly Tenant-Friendly
- State New York
- 15 Strongly Tenant-Friendly · D+10
- County
- — inherits STATE
- City
- — inherits STATE
ZIP-level market 12307
- Home prices YoY
- 3.3%
- Active inventory
- 33
- Price-to-rent
- 8.4×
Monthly cashflow live
- Estimated rent
- $1,449 high interval (Pro) →
- Mortgage (P&I)
- −$765
- Tax from tax record
- −$315 /mo · $3,779/yr
- Insurance
- −$61
- HOA
- −$0
- Vacancy / Maint / Mgmt
- −$304
- Net cashflow
- $4
Break-even live
UW: 25.0% down · 7.5% · 30yr · 1.5% tax · 5.0% vac · 8.0% maint · 8.0% mgmt
Financing live
Cash to close
- Down payment
- $36,475
- Closing costs
- $4,377
- Reserves months
- —
- Total cash needed
- —
Loan-product check · same deal, 3 products live
Conventional
25% down · 7.5% · 30yr
- Down + closing
- —
- Monthly P&I
- —
- Monthly cashflow
- —
- DSCR
- —
- Eligible?
- —
Personal DTI + credit; lowest rate.
DSCR
20% down · 8.5% · 30yr
- Down + closing
- —
- Monthly P&I
- —
- Monthly cashflow
- —
- DSCR
- —
- Eligible?
- —
No personal income docs; deal must DSCR.
Hard money
10% down · 12.0% · 12mo
- Down + closing
- —
- Monthly P&I
- —
- Monthly cashflow
- —
- DSCR
- —
- Eligible?
- —
Short-term bridge; refi at stabilization.
Rent comps 13 comps
| Address | Beds | Baths | Sqft | Rent | $/sqft | DOM | Units | Dist |
|---|---|---|---|---|---|---|---|---|
| 126 Prospect St Schenectady, NY | 3.0 | 1.0 | 1000 | $1,600 | $1.60 | 23d | 1 | 0.27mi |
| 762 Eastern Ave Schenectady, NY | 2.0 | 1.0 | 1119 | $1,400 | $1.25 | 23d | 1 | 0.32mi |
| 120 De Graff St Schenectady, NY | 4.0 | 1.0 | 1022 | $1,600 | $1.57 | 43d | 1 | 0.32mi |
| 409 State St Schenectady, NY | 2.0 | 1.0 | 1000 | $1,200 | $1.20 | 19d | 1 | 0.35mi |
| 922 State St Schenectady, NY | 1.0–2.0 | 1.0 | 855 | $1,390 | $1.63 | 14d | 6 | 0.46mi |
| 23 Hawk St Schenectady, NY | 2.0 | 1.0 | 920 | $1,500 | $1.63 | 19d | 1 | 0.58mi |
| 23 Monroe St Unit 23 2R Schenectady, NY | 2.0 | 1.0 | 800 | $1,325 | $1.66 | 14d | 1 | 0.63mi |
| 117 Washington Ave Schenectady, NY | 2.0–4.0 | 1.0–2.0 | 1033 | $1,515 | $1.47 | 13d | 9 | 0.69mi |
| 13 State St Schenectady, NY | 1.0–2.0 | 1.0 | 923 | $1,768 | $1.92 | 13d | 1 | 0.71mi |
| 1120 Pleasant St Schenectady, NY | 3.0 | 1.0 | 1000 | $1,500 | $1.50 | 14d | 1 | 1.21mi |
| 1130 Pleasant St Schenectady, NY | 2.0 | 1.0 | 1069 | $1,300 | $1.22 | 43d | 1 | 1.22mi |
| 1121 10th Ave Schenectady, NY | 2.0 | 1.0 | 800 | $1,250 | $1.56 | 23d | 1 | 1.39mi |
| 2042 Van Vranken Ave Schenectady, NY | 2.0 | 1.0 | 816 | $1,200 | $1.47 | 43d | 1 | 1.48mi |
Listing history 2 events
-
2026-05-14status Pending 213-char remark
-
2026-05-04$145,900 Active 213-char remark
ⓘ Source: listings_history table (triggers on properties + properties_extension) + one-shot
backfill from property_details.listing_events for pre-trigger history.
Tax reassessment forecast NY · Partial reset (capped growth)
- Current annual tax
- $3,779 · $315/mo
- Projected year-2 tax
- $3,779 · $315/mo
- Expected delta
- $0/yr ($0/mo · 0.0%)
ⓘ Screening estimate from a state-policy table — verify with the county assessor before closing.
Climate risk First Street
- Flood 1/10 Low FEMA zone X (unshaded) · 0% chance over 30 yrs
- Wildfire 3/10 Moderate
- Heat 4/10 Moderate 7 d/yr ≥96°F today · 16 d/yr by 30 yrs out
- Wind 2/10 Low 4% chance of damaging wind over 30 yrs
- Air quality 1/10 Low 0 unhealthy d/yr today · 0 by 30 yrs out
Nearby sold comps map
Loading sold comps map…
Walkable amenities ~0.75 mi
Loading nearby amenities…
Taxation est. · year 1
- Rental income
- $17,387
- − Mortgage interest
- −$8,173
- − Property taxes
- −$3,779
- − Insurance
- −$730
- − Repairs & maintenance
- −$1,391
- − Management
- −$1,391
- − Depreciation
- −$4,244
- Taxable loss
- −$2,321
- Est. tax savings @ 24.0%
- +$557
- After-tax cash flow
- $603/yr
For passive investors: Depreciation is non-cash, so a rental often shows a tax loss while cash-flowing — sheltering income. Rental losses are passive: they offset passive income freely, and up to $25,000/yr can offset ordinary (W-2) income if you actively participate and your MAGI is under $100k (phasing out to $0 by $150k); unused losses carry forward. On sale, claimed depreciation is recaptured at up to 25%, and gains may owe capital-gains tax (a 1031 exchange can defer both). Figures are a year-1 estimate at your 24.0% rate — not tax advice; consult a CPA.
Schools (NCES district)
- District
- Schenectady City School District
- NCES district ID
- 3626010
- Math proficiency
- 38% ▲ 12.00%
- Reading proficiency
- 34% ▲ 2.00%
- Median HH income
- $39,453
- Composite
- 30.2/100
- National rank
- #6309
- State rank
- #556 of 590 in NY
Livability — Schenectady
- Score
- 78/100
- State rank
- #167
- US rank
- #2597
Category grades
Schools grade is shown separately in the Schools card above.
Census & demographics
- Census place
- Schenectady, NY
- City population
- 141,369
- Population (ZIP)
- 7,977
Population outlook (Schenectady County) Hauer SSP2
- Today (2025)
- 155,046 people
- By 2030
- 154,322 · -0.5%
- By 2040
- 151,796 · -2.1%
- By 2050
- 148,621 · -4.1%
- By 2075
- 141,229 · -8.9%
- By 2100
- 126,014 · -18.7%
Race, ethnicity, and origin ACS 2023
- Neighborhood character
- Highly diverse neighborhood (Simpson 0.81)
- Race & ethnicity
- Black 28% Hispanic / Latino 25% White 19% Two or more races 16% Asian 11% Native American 3%
- Hispanic origin (detail)
- Mexican 5% Puerto Rican 14% Dominican 3%
- Common ancestry
- Lithuanian 3% Ukrainian 3% Romanian 1%
- Foreign-born
- 32% · Canada, Jamaica, South Korea
- Languages at home
- 79% English-only · Spanish 12% Arabic 2% Other Asian/Pacific 1%
Political lean MEDSL · Schenectady
- 2024 margin
- D (+10.8) · D 55.4% · R 44.6%
- 2008→2024 swing
- -1.8pp toward R · 2008: 12.7pp · 2024: 10.8pp
- All cycles
- 2024: D+10.8 2020: D+15.7 2016: D+5.8 2012: D+15.4 2008: D+12.7
Not yet ingested
- Civics
- —
Market trends
- HPI YoY
- ▲ 12.60%
- Current HPI
- 398.0252
- Rent YoY
- —
- Metro
- —
- State GDP YoY
- ▲ 2.60%
- F500 in state
- 92
Industry mix (Fortune 500 HQ in NY)
| Industry | F500 HQs | Revenue |
|---|---|---|
| Financial Services | 10 | $950B |
|
||
| Consumer Goods | 9 | $162B |
|
||
| Insurance | 4 | $225B |
|
||
| Telecommunications | 2 | $144B |
|
||
| Pharmaceuticals | 2 | $112B |
|
||
| Media / Entertainment | 2 | $69B |
|
||
Price history
2 events — show timeline
- 2026-05-14 Pending — Global MLS
- 2026-05-04 Listed $145,900 Global MLS
Property tax history
+0.6%/yrLatest (2025): $3,779 · +2.8% YoY. Source: county tax records.
Cash-flow waterfall
monthlySold comps — $/sqft
last 12 mo · ≤1 miLoading sold comps…