474 Halifax St SW · Palm Bay, FL
Flood risk 6/10 · Moderate
- FEMA flood zone
- AE
- Chance of flooding over 30 yrs
- 0.69%
- Est. flood insurance / yr
- $1,737 – $8,500
Fire risk 4/10 · Minor
- Est. fire insurance / yr
- $947 – $1,759
Heat risk 9/10 · Severe
- Hot days now (above 106°F)
- 7 days/yr
- Hot days in 30 yrs
- 22 days/yr
Wind risk 10/10 · Severe
- Chance of severe wind over 30 yrs
- 99.0%
Air-quality risk 1/10 · Minimal
- Unhealthy air days now
- 0 days/yr
- Unhealthy air days in 30 yrs
- 0 days/yr
Risk factors via First Street. Map © Google.
Why this score? — see what drove the F grade
The composite is a weighted blend of 9 inputs, each scored 0–100. Each bar is that input's sub-score; the figure is the points it added to the 100-point composite (weight × sub-score).
- Cash flow +8.1/30.0
- ARV discount +7.5/15.0
- Schools +4.7/10.0
- Livability +3.6/5.0
- Rent growth +2.8/5.0
- 1% rule +2.5/10.0
- Condition / age +2.5/5.0
- DSCR +2.1/10.0
- Appreciation +0.0/10.0
$345,990
🖨 Deal sheet (PDF) 📄 Offer letter ✓ Due diligence
Listing remarks MLS
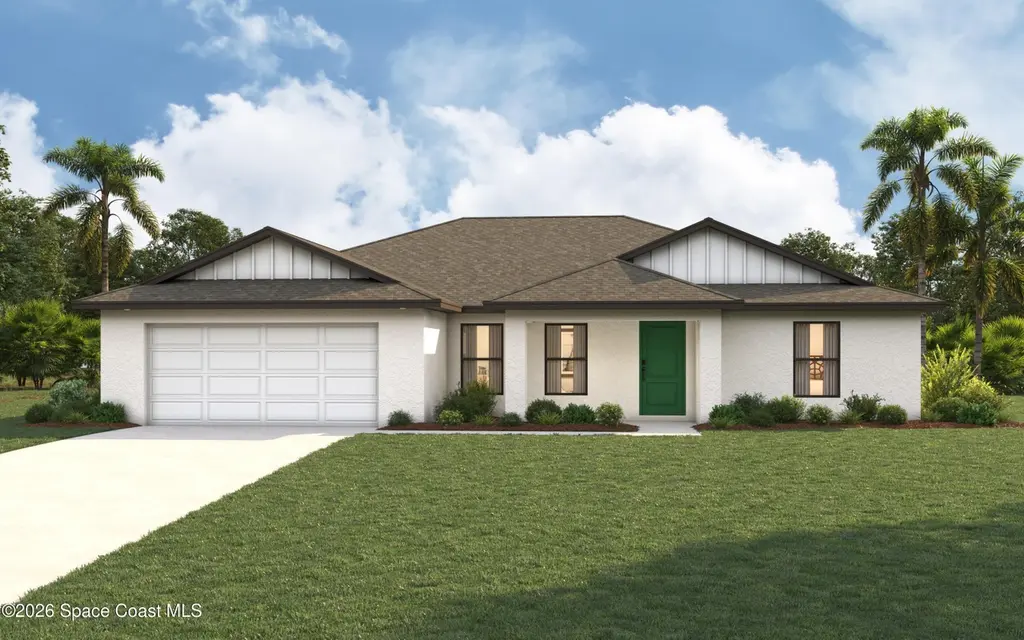
Our new construction homes in Palm Bay, Florida are located on Florida's East Coast in Brevard County, approximately 70 miles southeast of Orlando and 100 miles north of Miami. Our new homes in Palm Bay offer a lifestyle enriched by a thriving economy, anchored by major employers in aerospace, healthcare, and technology. Its beautiful setting, prime location and robust economy make Palm Bay the perfect place to live, work, and play. We invite you to consider a Christopher Alan Home to become a part of this thriving city that offers a high quality of life! DRE# 175519667
Key facts
- Covered front porch
- Split-bedroom layout
- Vaulted ceiling
Tags
Property features AI
Finance
- Other: Pets allowed
Exterior
- Parking: Attached garage; 2-car garage
- Security: Smoke detectors
- Utilities: Septic tank; Cable available; Electricity connected
- Home design: Single family residence; One story; North-facing; New construction
- Construction: Block, concrete and stucco construction; Shingle roof
- Exterior features: Impact windows; Covered front and rear porches
Interior
- Kitchen: Dishwasher; Electric range; Microwave; Refrigerator; Pantry; Kitchen island
- Bedrooms: 4 bedrooms
- Flooring: Carpet; Tile
- Bathrooms: 2 full bathrooms
- Heating & cooling: Central heating (electric); Central air conditioning (electric)
- Interior features: His and hers closets; Kitchen island; Open floorplan; Pantry; Primary bathroom with shower (no tub); Primary bedroom on main floor; Split bedroom layout; Vaulted ceilings; Walk-in closets
- Laundry & utility: In-unit laundry; Washer hookup; Electric dryer hookup; Electric water heater
Neighborhood map
What this means for you Summary
Snapshot
- This is a 4-bed/2.0-bath land listed at $346k.
Deal economics
- At list price, monthly cash flow is $-766 ($-9k/yr) — negative.
- To cash-flow at today's rent, offer at most $235k (32.0% below list).
- To meet the 1% rule (rent ≥ 1% of price), the offer needs to be $260k (24.9% below list).
- Recommended offer: $235k (32.0% below list) — sets the bar for cash-flow.
Location & tenants
- Location reads 72/100 on livability (#366 in FL) — a middle-class / working-renter tenant base. Strengths: cost of living A+, housing A+; Watch: employment D+, amenities F, health & safety D-.
- Brevard (suburban): math 53% / reading 57% proficiency, ranked #19 of 73 in FL (top 26%) — acceptable for families but not a draw, mixed tenant base, ~2y average lease.
- Zoned schools: Westside Elementary School (math 51% / reading 58%, grade C, #892 of 2,144 statewide, top 44%, 798 students, 52% FRL); Southwest Middle School (math 40% / reading 39%, grade F, #373 of 571 statewide, top 66%, 920 students, 58% FRL); Bayside High School (math 27% / reading 40%, grade F, #400 of 667 statewide, top 61%, 1,854 students, 51% FRL).
- Zoned-school proficiency averages 42% at this address vs 55% district-wide (-12 pts) — the specific schools serving this property underperform the Brevard average; the district grade overstates school quality for this exact location.
- Market conditions: Rents rising (+1.3%/yr); 1030 active listings in the ZIP; 11 comparable units currently listed for rent nearby; rentals at typical pace (median 25d on market — plan ~3-4 weeks tenant-placement turnaround); solid renter incomes; 4,602 units permitted in Brevard County in 2024 (702 in 5+ unit buildings).
- This rent runs 39% of the median local income ($80k/yr) — at the standard rent-burdened threshold; future hikes will face affordability resistance.
Forward outlook
- Local home prices are declining (-3.0%/yr); year-one equity from $2k of loan paydown is wiped out by about $10k of value loss. Plan a longer hold.
- Brevard County population projected at +15% by 2050 — modest demand growth; plan on rents tracking national, not racing it.
Negotiation context
- It's been on market 41 days — a 3% lower offer ($336k) is reasonable based on typical stale-listing flexibility.
- 2 sale attempts with the ask held roughly flat each time — persistent listings suggest the price (not the market) is what's stuck; bring a comps-based counter.
Risks & watch-outs
- Watch-outs: flood insurance adds $427/mo.
- Climate carrying-cost: in FEMA flood zone AE (mandatory federal flood insurance); severe wind risk, 99% chance of damaging wind over 30y; extreme-heat days projected 7→22/yr by 2055 (HVAC capex compounding) — expect insurance premiums to compound above CPI over the hold.
Questions for the listing agent
- What do current leases actually rent for vs. the listed asking? Can we see a recent rent roll and the last 12 months of T-12 income?
- It's been on market 41 days. Have you received any prior offers? Is the seller open to a 32% concession, seller financing, or rate buy-down credit?
- What's the actual annual flood-insurance premium (NFIP or private), and is the property in a SFHA with mandatory coverage?
- Is there a deadline driving the sale (1031 exchange, divorce, estate, relocation)? That informs how much negotiation room exists.
- The area grade is low — what's the realistic commute time and amenity access for the typical tenant pool here? Any planned neighborhood developments (good or bad) we should know about?
- What's the average days-on-market for RENTAL listings here right now (not sales)? A rising rental-DOM trend means longer vacancies and softer asking-rent achievability than the comps imply.
- What's the recent tenant-quality profile in this submarket — average credit score on applications, eviction rate, late-payment / NSF rate, and stable-employment percentage? A property-management company in the area should have these aggregated.
- How much new for-sale + rental construction is in the pipeline within 1–3 miles? Heavy new supply typically softens prices + rents 12–24 months out; constrained supply supports both.
Investment metrics
- 1% rule
- 0.75% ✗
- Cap rate
- 5.12%
- Cash-on-cash
- -4.20%
- DSCR
- 0.81
- GRM
- 11.1
CMA / ARV
No comps found within radius.
Projected returns pro-forma
-3.0% appreciation · 1.29% rent growth · sell at horizon
- IRR
- -35.5%
- Equity multiple
- -0.12×
- Total profit
- $-108,931
- Equity at exit
- $51,588
- IRR
- -62.8%
- Equity multiple
- -0.79×
- Total profit
- $-173,856
- Equity at exit
- $29,915
Cash invested: $96,877 (down + closing). Projections, not guarantees.
Landlord ↔ Tenant lean methodology
- Overall (STATE)
- 87 Strongly Landlord-Friendly
- State Florida
- 87 Strongly Landlord-Friendly · R+3
- County
- — inherits STATE
- City
- — inherits STATE
ZIP-level market 32908
- Home prices YoY
- -10.4%
- Rents YoY
- 1.3%
- Active inventory
- 1030
- Price-to-rent
- 11.1×
Monthly cashflow live
- Estimated rent
- $2,597 high interval (Pro) →
- Mortgage (P&I)
- −$1,814
- Tax est. 1.5%
- −$432 /mo · $5,190/yr
- Insurance
- −$144
- Flood insurance flood zone
- −$427 /mo · $5,118/yr
- HOA
- −$0
- Vacancy / Maint / Mgmt
- −$545
- Net cashflow
- $-766
Break-even live
Sensitivity live
| Price | -10% $-527 | -5% $-646 | +0% $-766 | +5% $-885 | +10% $-1,005 |
|---|---|---|---|---|---|
| Rent | -10% $-971 | -5% $-868 | +0% $-766 | +5% $-663 | +10% $-561 |
| Rate | -1.0pp $-592 | -0.5pp $-678 | base $-766 | +0.5pp $-855 | +1.0pp $-947 |
UW: 25.0% down · 7.5% · 30yr · 1.5% tax · 5.0% vac · 8.0% maint · 8.0% mgmt
Financing live
Cash to close
- Down payment
- $86,498
- Closing costs
- $10,380
- Reserves months
- —
- Total cash needed
- —
Loan-product check · same deal, 3 products live
Conventional
25% down · 7.5% · 30yr
- Down + closing
- —
- Monthly P&I
- —
- Monthly cashflow
- —
- DSCR
- —
- Eligible?
- —
Personal DTI + credit; lowest rate.
DSCR
20% down · 8.5% · 30yr
- Down + closing
- —
- Monthly P&I
- —
- Monthly cashflow
- —
- DSCR
- —
- Eligible?
- —
No personal income docs; deal must DSCR.
Hard money
10% down · 12.0% · 12mo
- Down + closing
- —
- Monthly P&I
- —
- Monthly cashflow
- —
- DSCR
- —
- Eligible?
- —
Short-term bridge; refi at stabilization.
Rent comps 11 comps
| Address | Beds | Baths | Sqft | Rent | $/sqft | DOM | Units | Dist |
|---|---|---|---|---|---|---|---|---|
| 583 Halifax St SW Palm Bay, FL | 4.0 | 2.0 | 1833 | $2,075 | $1.13 | 15d | 1 | 0.26mi |
| 3270 Framingham Ave SW Palm Bay, FL | 4.0 | 2.0 | 1856 | $2,400 | $1.29 | 25d | 1 | 0.31mi |
| 448 Saint Andre Blvd SW Palm Bay, FL | 4.0 | 2.0 | 2088 | $4,000 | $1.92 | 25d | 1 | 0.34mi |
| 238 Silver Frost St SE Palm Bay, FL | 3.0 | 2.0 | 1475 | $1,849 | $1.25 | 25d | 1 | 0.92mi |
| 286 Silver Frost St SE Palm Bay, FL | 4.0 | 2.0 | 1833 | $1,925 | $1.05 | 16d | 1 | 0.98mi |
| 291 Foley St SE Palm Bay, FL | 4.0 | 2.0 | 1833 | $2,025 | $1.10 | 15d | 1 | 1.09mi |
| 2650 De Groodt Rd SW Palm Bay, FL | 4.0 | 2.0 | 1874 | $2,350 | $1.25 | 16d | 1 | 1.18mi |
| 3247 Halblum Ave SE Palm Bay, FL | 4.0 | 3.0 | 1820 | $2,516 | $1.38 | 15d | 1 | 1.23mi |
| 160 Dailey St SE Palm Bay, FL | 4.0 | 2.0 | 1795 | $2,275 | $1.27 | 25d | 1 | 1.30mi |
| 496 Vanguard St SE Palm Bay, FL | 3.0 | 2.0 | 1666 | $2,150 | $1.29 | 25d | 1 | 1.38mi |
| 2785 Gabboys Ave SE Palm Bay, FL | 3.0 | 2.0 | 1475 | $1,849 | $1.25 | 25d | 1 | 1.45mi |
Listing history 7 events
-
2026-05-12status Pending
-
2026-04-01$345,990 Active
-
2026-03-13$342,990 Active 576-char remark
Show marketing remark (576 chars)
Our new construction homes in Palm Bay, Florida are located on Florida's East Coast in Brevard County, approximately 70 miles southeast of Orlando and 100 miles north of Miami. Our new homes in Palm Bay offer a lifestyle enriched by a thriving economy, anchored by major employers in aerospace, healthcare, and technology. Its beautiful setting, prime location and robust economy make Palm Bay the perfect place to live, work, and play. We invite you to consider a Christopher Alan Home to become a part of this thriving city that offers a high quality of life! DRE# 175519667
-
2025-09-30soldstatus $910,900
-
2010-12-21soldstatus $13,000
-
2010-09-20soldstatus $107,800
-
2005-10-26soldstatus $55,000
ⓘ Source: listings_history table (triggers on properties + properties_extension) + one-shot
backfill from property_details.listing_events for pre-trigger history.
Climate risk First Street
- Flood 6/10 Major FEMA zone AE · 69% chance over 30 yrs
- Wildfire 4/10 Moderate
- Heat 9/10 Extreme 7 d/yr ≥106°F today · 22 d/yr by 30 yrs out
- Wind 10/10 Extreme 99% chance of damaging wind over 30 yrs
- Air quality 1/10 Low 0 unhealthy d/yr today · 0 by 30 yrs out
Nearby sold comps map
Loading sold comps map…
Walkable amenities ~0.75 mi
Loading nearby amenities…
Taxation est. · year 1
- Rental income
- $31,167
- − Mortgage interest
- −$19,381
- − Property taxes
- −$5,190
- − Insurance
- −$6,848
- − Repairs & maintenance
- −$2,493
- − Management
- −$2,493
- − Depreciation
- −$10,065
- Taxable loss
- −$15,304
- Est. tax savings @ 24.0%
- +$3,673
- After-tax cash flow
- $-5,516/yr
For passive investors: Depreciation is non-cash, so a rental often shows a tax loss while cash-flowing — sheltering income. Rental losses are passive: they offset passive income freely, and up to $25,000/yr can offset ordinary (W-2) income if you actively participate and your MAGI is under $100k (phasing out to $0 by $150k); unused losses carry forward. On sale, claimed depreciation is recaptured at up to 25%, and gains may owe capital-gains tax (a 1031 exchange can defer both). Figures are a year-1 estimate at your 24.0% rate — not tax advice; consult a CPA.
Schools (NCES district)
- District
- Brevard
- NCES district ID
- 1200150
- Math proficiency
- 53% ▼ -9.00%
- Reading proficiency
- 57% ▼ -4.00%
- Median HH income
- $49,426
- Composite
- 46.86/100
- National rank
- #2370
- State rank
- #19 of 73 in FL
Livability — Palm Bay
- Score
- 72/100
- State rank
- #366
- US rank
- #6458
Category grades
Schools grade is shown separately in the Schools card above.
Census & demographics
- Census place
- Palm Bay, FL
- County
- Brevard County · 602,871 people
- City population
- 132,211
- Metro
- Palm Bay-Melbourne-Titusville, FL
- Population (ZIP)
- 16,535
- Household income
- $79,596
- Rent vs Own
- Severe rent burden
- 112.0
Population outlook (Brevard County) Hauer SSP2
- Today (2025)
- 623,254 people
- By 2030
- 648,420 · +4.0%
- By 2040
- 690,009 · +10.7%
- By 2050
- 715,669 · +14.8%
- By 2075
- 775,744 · +24.5%
- By 2100
- 776,687 · +24.6%
Race, ethnicity, and origin ACS 2023
- Neighborhood character
- Diverse neighborhood (Simpson 0.69)
- Race & ethnicity
- White 48% Hispanic / Latino 20% Black 20% Two or more races 19%
- Hispanic origin (detail)
- Mexican 1% Puerto Rican 8% Cuban 6% Dominican 3%
- Common ancestry
- Hispanic 3% Estonian 2% Romanian 1%
- Foreign-born
- 10% · Canada, Jamaica, South Korea
- Languages at home
- 87% English-only · Spanish 9% Other Indo-European 1% French/Haitian/Cajun 1%
Political lean MEDSL · Brevard
- 2024 margin
- Strong R (+20.8) · D 39.1% · R 59.9% · Other 1.0%
- 2008→2024 swing
- -10.4pp toward R · 2008: -10.4pp · 2024: -20.8pp
- All cycles
- 2024: R+20.8 2020: R+16.4 2016: R+19.8 2012: R+12.7 2008: R+10.4
Not yet ingested
- Civics
- —
Market trends
- HPI YoY
- ▼ -38.22%
- Current HPI
- 330.0399
- Rent YoY
- ▲ 1.29%
- Metro
- Palm Bay-Melbourne-Titusville, FL
- State GDP YoY
- ▲ 3.28%
- F500 in state
- 36
Industry mix (Fortune 500 HQ in FL)
| Industry | F500 HQs | Revenue |
|---|---|---|
| Industrial Technology | 2 | $29B |
|
||
| Insurance | 2 | $17B |
|
||
| Retail | 1 | $60B |
|
||
| Technology Distribution | 1 | $58B |
|
||
| Homebuilding | 1 | $35B |
|
||
| Technology Manufacturing | 1 | $35B |
|
||
Price history
+529.1% since first listed7 events — show timeline
- 2026-05-12 Pending — SCMLS
- 2026-04-01 Listed $345,990 SCMLS
- 2026-03-13 Listed $342,990 Zillow
- 2025-09-30 Sold (Public Records) $910,900 Public Records
- 2010-12-21 Sold (Public Records) $13,000 Public Records
- 2010-09-20 Sold (Public Records) $107,800 Public Records
- 2005-10-26 Sold (Public Records) $55,000 Public Records
Property tax history
+19.2%/yrLatest (2025): $558 · +36.8% YoY. Source: county tax records.
Cash-flow waterfall
monthlySold comps — $/sqft
last 12 mo · ≤1 miLoading sold comps…