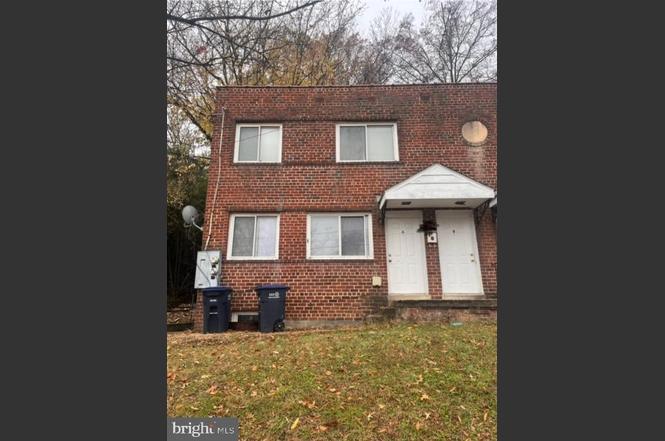
4757 South Capitol Ter S · Washington, DC
Flood risk 1/10 · Minimal
- FEMA flood zone
- X (unshaded)
- Chance of flooding over 30 yrs
- 0.0%
- Est. flood insurance / yr
- $473 – $860
Fire risk 1/10 · Minimal
- Est. fire insurance / yr
- $631 – $1,173
Heat risk 7/10 · Major
- Hot days now (above 104°F)
- 7 days/yr
- Hot days in 30 yrs
- 16 days/yr
Wind risk 4/10 · Minor
- Chance of severe wind over 30 yrs
- 21.0%
Air-quality risk 3/10 · Minor
- Unhealthy air days now
- 2 days/yr
- Unhealthy air days in 30 yrs
- 3 days/yr
Risk factors via First Street. Map © Google.
Why this score? — see what drove the D grade
The composite is a weighted blend of 9 inputs, each scored 0–100. Each bar is that input's sub-score; the figure is the points it added to the 100-point composite (weight × sub-score).
- Cash flow +13.3/30.0
- ARV discount +9.8/15.0
- DSCR +4.0/10.0
- Livability +3.7/5.0
- Schools +3.6/10.0
- Rent growth +3.5/5.0
- 1% rule +3.2/10.0
- Condition / age +2.5/5.0
- Appreciation +0.0/10.0
$325,000
🖨 Deal sheet 📄 Offer letter ✓ Due diligence
Listing remarks
Back on the Market Strickly As-Is based on current condition Versatile Duplex in Washington, DC – Now $325K! Seize the opportunity to own this adaptable duplex, featuring two separate 2-bed, 1-bath units. Ideal for customization, this property offers: Single-family home conversion Multi-generational living Condo with rental income potential Investment property with steady cash flow Located near downtown DC, National Harbor, and major beltways, this duplex boasts an expandable layout and is situated in a desirable rental market. Sold as-is, with the seller open to offers, including credit and rate buy-downs. Schedule a tour today and unlock the possibilities!
Key facts
- Built 1953
- Listed 175 days
Property features AI
Exterior
- Parking: Driveway; On-street parking
- Utilities: Public water; Public sewer; Natural gas available
- Home design: Semi-detached home; Estimated year built
- Construction: Brick construction; Slab foundation
- Exterior features: Finished below-grade area with outside entrance
Interior
- Kitchen: Galley-style kitchen
- Bedrooms: Four bedrooms on the main level
- Flooring: Carpet
- Bathrooms: Two full bathrooms on the main level; Two full bathrooms total
- Heating & cooling: Central heating; Natural gas heat; Natural gas hot water
- Interior features: Galley kitchen; Ceiling fans; Carpeted areas; Tub with shower
Neighborhood map
What this means for you Summary
Snapshot
- This is a 4-bed/2.0-bath townhouse listed at $325k.
Deal economics
- At list price, monthly cash flow is $-1 ($-14/yr) — negative.
- To cash-flow at today's rent, offer at most $325k (0.1% below list).
- To meet the 1% rule (rent ≥ 1% of price), the offer needs to be $266k (18.1% below list).
- Recommended offer: $266k (18.1% below list) — sets the bar for 1% rule.
- Cap rate 6.3% vs local median 2.5% in Washington — top-decile yield for the area; either an underpriced asset or a hidden risk that comps aren't pricing in. Stress-test before assuming the spread holds.
Location & tenants
- Location reads 73/100 on livability (#1 in DC) — a middle-class / working-renter tenant base. Strengths: amenities A+, commute A+, employment A+; Watch: crime F, cost of living F.
- District Of Columbia Public Schools (urban): math 33% / reading 40% proficiency, ranked #8 of 32 in DC (top 25%) — families likely to look elsewhere, expect single-tenant / working-renter base with shorter leases; 65% free/reduced lunch — lower-income household profile, screen leases tightly.
- Market conditions: Rents rising (+4.0%/yr); 145 active listings in the ZIP; 22 comparable units currently listed for rent nearby; rentals at typical pace (median 22d on market — plan ~3-4 weeks tenant-placement turnaround); 1,737 units permitted in District of Columbia in 2024 (1,506 in 5+ unit buildings).
- At $2,662/mo this rent would consume 65% of the median local household income ($49k/yr) (locally 4530% of renters already pay >50% of income on rent) — very limited rent-growth headroom before tenants either downsize or default.
Forward outlook
- Local home prices are declining (-3.0%/yr); year-one equity from $2k of loan paydown is wiped out by about $10k of value loss. Plan a longer hold.
- District of Columbia County population projected at +50% by 2050 — long-run rental-demand tailwind backs the buy-and-hold thesis.
Negotiation context
- It's been on market 175 days — a 12% lower offer ($286k) is reasonable based on typical stale-listing flexibility.
- 5 sale attempts since 29y ago; this cycle's ask has dropped $50k (13%) from the opening price — seller is motivated, your offer sets the floor, not the list.
- Current owner paid $11k; list at $325k implies a 2855% gain — meaningful room to come down on a strong offer.
Risks & watch-outs
- Watch-outs: built in 1953 — expect roof / HVAC / electrical / plumbing capex.
- Climate carrying-cost: extreme-heat days projected 7→16/yr by 2055 (HVAC capex compounding) — expect insurance premiums to compound above CPI over the hold.
Questions for the listing agent
- What do current leases actually rent for vs. the listed asking? Can we see a recent rent roll and the last 12 months of T-12 income?
- It's been on market 175 days. Have you received any prior offers? Is the seller open to a 18% concession, seller financing, or rate buy-down credit?
- Built in 1953 — when were the roof, HVAC, electrical panel, plumbing, and water heater last replaced?
- Why hasn't it sold? Are there any deal-killer items the seller is aware of (foundation, flood, title, zoning, code violations)?
- Is there a deadline driving the sale (1031 exchange, divorce, estate, relocation)? That informs how much negotiation room exists.
- Crime grade is F in this area — have there been break-ins, vandalism, or insurance claims at this property in the last 3 years? What carrier currently insures it and at what premium?
- The area grade is low — what's the realistic commute time and amenity access for the typical tenant pool here? Any planned neighborhood developments (good or bad) we should know about?
- What's the average days-on-market for RENTAL listings here right now (not sales)? A rising rental-DOM trend means longer vacancies and softer asking-rent achievability than the comps imply.
- What's the recent tenant-quality profile in this submarket — average credit score on applications, eviction rate, late-payment / NSF rate, and stable-employment percentage? A property-management company in the area should have these aggregated.
- How much new for-sale + rental construction is in the pipeline within 1–3 miles? Heavy new supply typically softens prices + rents 12–24 months out; constrained supply supports both.
Investment metrics
- 1% rule
- 0.82% ✗
- Cap rate
- 6.29%
- Cash-on-cash
- -0.02%
- DSCR
- 1.00
- GRM
- 10.2
CMA / ARV
- ARV (on-the-fly)
- $342,400
- Comps found
- 12
Show comp detail 12 sales within ~0.75 mi
| Address | Dist | Beds/Ba | Sqft | Sold | Price | $/sf | Match |
|---|---|---|---|---|---|---|---|
| 4647 6th St SE | 0.44mi | 4/2.5 | 1,691 (+6%) | 8mo | $355,000 | $210 | 62 |
| 618 Galveston St SE | 0.50mi | 3/1.5 (-1) | 1,550 (-3%) | 5mo | $218,500 | $141 | 60 |
| 5201 Leverett St | 0.65mi | 4/2.0 | 1,566 (-2%) | 9mo | $335,000 | $214 | 59 |
| 710 Bonini Rd SE | 0.64mi | 4/1.5 | 1,545 (-3%) | 5mo | $280,000 | $181 | 58 |
| 702 Neptune Ave | 0.59mi | 3/2.0 (-1) | 1,566 (-2%) | 10mo | $320,000 | $204 | 56 |
| 908 E Meadows Ct | 0.65mi | 3/2.0 (-1) | 1,560 (-2%) | 6mo | $335,000 | $215 | 55 |
| 98 Elmira St SW | 0.34mi | 4/2.5 | 1,412 (-12%) | 11mo | $389,900 | $276 | 54 |
| 138 Danbury St SW | 0.48mi | 3/2.5 (-1) | 1,476 (-8%) | 10mo | $370,000 | $251 | 49 |
| 624 Forrester St SE | 0.57mi | 3/1.5 (-1) | 1,500 (-6%) | 12mo | $220,000 | $147 | 46 |
| 720 Maury Ave | 0.60mi | 4/3.5 | 1,800 (+12%) | 1mo | $410,000 | $228 | 44 |
| 117 Danbury St SW | 0.49mi | 3/3.5 (-1) | 1,412 (-12%) | 11mo | $460,000 | $326 | 37 |
| 42 Brandywine St SW | 0.59mi | 3/1.5 (-1) | 1,830 (+14%) | 10mo | $361,000 | $197 | 33 |
Match score weights: distance 35% · size 25% · config 20% · recency 20%. Top-matched comps best support the ARV.
Projected returns pro-forma
-3.0% appreciation · 3.96% rent growth · sell at horizon
- IRR
- -15.3%
- Equity multiple
- 0.45×
- Total profit
- $-50,188
- Equity at exit
- $48,459
- IRR
- -5.4%
- Equity multiple
- 0.64×
- Total profit
- $-33,125
- Equity at exit
- $28,100
Cash invested: $91,000 (down + closing). Projections, not guarantees.
Landlord ↔ Tenant lean methodology
- Overall (CITY)
- 0 Strongly Tenant-Friendly
- State District of Columbia
- 12 Strongly Tenant-Friendly · D+43
- County
- — inherits STATE
- City Washington
- 0 Strongly Tenant-Friendly · D+43
ZIP-level market 20032
- Home prices YoY
- -15.6%
- Rents YoY
- 4.0%
- Active inventory
- 145
- Price-to-rent
- 10.2×
Monthly cashflow live
- Estimated rent
- $2,662 high interval (Pro) →
- Mortgage (P&I)
- −$1,704
- Tax from tax record
- −$265 /mo · $3,176/yr
- Insurance
- −$135
- HOA
- −$0
- Vacancy / Maint / Mgmt
- −$559
- Net cashflow
- $-1
Break-even live
UW: 25.0% down · 7.5% · 30yr · 1.5% tax · 5.0% vac · 8.0% maint · 8.0% mgmt
Financing live
Cash to close
- Down payment
- $81,250
- Closing costs
- $9,750
- Reserves months
- —
- Total cash needed
- —
Loan-product check · same deal, 3 products live
Conventional
25% down · 7.5% · 30yr
- Down + closing
- —
- Monthly P&I
- —
- Monthly cashflow
- —
- DSCR
- —
- Eligible?
- —
Personal DTI + credit; lowest rate.
DSCR
20% down · 8.5% · 30yr
- Down + closing
- —
- Monthly P&I
- —
- Monthly cashflow
- —
- DSCR
- —
- Eligible?
- —
No personal income docs; deal must DSCR.
Hard money
10% down · 12.0% · 12mo
- Down + closing
- —
- Monthly P&I
- —
- Monthly cashflow
- —
- DSCR
- —
- Eligible?
- —
Short-term bridge; refi at stabilization.
Rent comps 22 comps
| Address | Beds | Baths | Sqft | Rent | $/sqft | DOM | Units | Dist |
|---|---|---|---|---|---|---|---|---|
| 118 Galveston St SW Washington, DC | 1.0–3.0 | 1.0–2.0 | 951 | $2,130 | $2.24 | 2d | 10 | 0.14mi |
| 44 Forrester St SW Unit 3 Washington, DC | 3.0 | 2.0 | 1200 | $2,450 | $2.04 | 24d | 1 | 0.28mi |
| 4306 Halley Ter SE Unit 1 Washington, DC | 4.0 | 2.0 | 1270 | $3,000 | $2.36 | 10d | 1 | 0.45mi |
| 4334 Martin Luther King Jr Ave SW Washington, DC | 3.0 | 2.0 | 1323 | $3,200 | $2.42 | 24d | 1 | 0.48mi |
| 4285 S Capitol St SW Washington, DC | 3.0 | 3.5 | 1152 | $3,500 | $3.04 | 15d | 1 | 0.49mi |
| 4281 S Capitol St SW Washington, DC | 3.0 | 3.5 | 1412 | $2,900 | $2.05 | 24d | 1 | 0.50mi |
| 716 Audrey Ln Oxon Hill, MD | 3.0 | 2.0 | 1344 | $2,500 | $1.86 | 18d | 1 | 0.57mi |
| 5507 Sachem Dr Oxon Hill, MD | 4.0 | 3.0 | 1299 | $2,900 | $2.23 | 43d | 1 | 0.65mi |
| 4001 S Capitol St SW Washington, DC | 3.0 | 1.0–2.0 | 782 | $2,557 | $3.27 | 13d | 1 | 0.71mi |
| 3968 Martin Luther King Junior Ave SW Unit 1 Washington, DC | 5.0 | 3.0 | 1500 | $7,000 | $4.67 | 24d | 1 | 0.76mi |
| 5400 Livingston Ter Oxon Hill, MD | 1.0–3.0 | 1.0–1.5 | 1053 | $1,890 | $1.79 | 1d | 5 | 0.76mi |
| 4805 Springmaid Ln Oxon Hill, MD | 3.0 | 2.5 | 1296 | $2,600 | $2.01 | 18d | 1 | 0.82mi |
| 147 Mississippi Ave SE Washington, DC | 4.0 | 2.0 | 1459 | $2,795 | $1.92 | 22d | 1 | 0.91mi |
| 4935 Wall Flower Way Oxon Hill, MD | 3.0 | 3.0 | 1320 | $2,750 | $2.08 | 20d | 1 | 1.04mi |
| 1306 Sutler Ter Oxon Hill, MD | 4.0 | 2.5 | 1320 | $3,079 | $2.33 | 3d | 1 | 1.05mi |
| 819 Quade St Oxon Hill, MD | 3.0 | 1.5 | 1500 | $3,100 | $2.07 | 43d | 1 | 1.18mi |
| 1636 Deep Gorge Ct Oxon Hill, MD | 3.0 | 3.5 | 1332 | $2,750 | $2.06 | 43d | 1 | 1.21mi |
| 911 Bellevue St SE Washington, DC | 4.0 | 2.0 | 1820 | $3,400 | $1.87 | 24d | 1 | 1.23mi |
| 6039 Livingston Rd Oxon Hill, MD | 3.0 | 2.5 | 1200 | $2,500 | $2.08 | 43d | 1 | 1.27mi |
| 4005 Blakney Ln SE Washington, DC | 3.0 | 2.5 | 2024 | $3,000 | $1.48 | 17d | 1 | 1.36mi |
| 1121 Varney St SE Washington, DC | 3.0 | 3.5 | 1400 | $3,000 | $2.14 | 24d | 1 | 1.46mi |
| 742 Congress St SE Washington, DC | 3.0 | 2.5 | 1744 | $3,000 | $1.72 | 16d | 1 | 1.47mi |
Listing history 29 events
-
2026-06-18days on market $325,000 Active 175 DOM
-
2026-06-17days on market $325,000 Active 174 DOM
-
2026-06-16days on market $325,000 Active 173 DOM
-
2026-06-15days on market $325,000 Active 172 DOM
-
2026-06-13days on market $325,000 Active 170 DOM
-
2026-06-09days on market $325,000 Active 166 DOM
-
2026-06-08days on market $325,000 Active 165 DOM
-
2026-06-07days on market $325,000 Active 164 DOM
-
2026-06-04days on market $325,000 Active 161 DOM
-
2026-06-03days on market $325,000 Active 160 DOM
-
2026-06-02days on market $325,000 Active 159 DOM
-
2026-06-01days on market $325,000 Active 158 DOM
-
2026-05-31days on market $325,000 Active 157 DOM
-
2026-04-02price $325,000
-
2026-04-02price $340,000
-
2026-04-02status Active
-
2026-03-16historical Active Under Contract
-
2025-12-08status Active
-
2025-11-03$375,000
-
2025-11-03historical
-
2025-10-08historical
-
2025-03-12price $415,000
-
2025-01-07price $440,000
-
2025-01-01$450,000 Active
-
2024-12-30historical
-
1998-01-16soldstatus $11,000
-
1997-12-19historical
-
1997-10-22$14,900
-
1976-09-09soldstatus $28,000
ⓘ Source: listings_history table (triggers on properties + properties_extension) + one-shot
backfill from property_details.listing_events for pre-trigger history.
Tax reassessment forecast DC · Partial reset (capped growth)
- Current annual tax
- $3,176 · $265/mo
- Projected year-2 tax
- $3,176 · $265/mo
- Expected delta
- $0/yr ($0/mo · 0.0%)
ⓘ Screening estimate from a state-policy table — verify with the county assessor before closing.
Climate risk First Street
- Flood 1/10 Low FEMA zone X (unshaded) · 0% chance over 30 yrs
- Wildfire 1/10 Low
- Heat 7/10 Severe 7 d/yr ≥104°F today · 16 d/yr by 30 yrs out
- Wind 4/10 Moderate 21% chance of damaging wind over 30 yrs
- Air quality 3/10 Moderate 2 unhealthy d/yr today · 3 by 30 yrs out
Nearby sold comps map
Loading sold comps map…
Walkable amenities ~0.75 mi
Loading nearby amenities…
Taxation est. · year 1
- Rental income
- $31,948
- − Mortgage interest
- −$18,205
- − Property taxes
- −$3,176
- − Insurance
- −$1,625
- − Repairs & maintenance
- −$2,556
- − Management
- −$2,556
- − Depreciation
- −$9,455
- Taxable loss
- −$5,624
- Est. tax savings @ 24.0%
- +$1,350
- After-tax cash flow
- $1,336/yr
For passive investors: Depreciation is non-cash, so a rental often shows a tax loss while cash-flowing — sheltering income. Rental losses are passive: they offset passive income freely, and up to $25,000/yr can offset ordinary (W-2) income if you actively participate and your MAGI is under $100k (phasing out to $0 by $150k); unused losses carry forward. On sale, claimed depreciation is recaptured at up to 25%, and gains may owe capital-gains tax (a 1031 exchange can defer both). Figures are a year-1 estimate at your 24.0% rate — not tax advice; consult a CPA.
Schools (NCES district)
- District
- District Of Columbia Public Schools
- NCES district ID
- 1100030
- Math proficiency
- 33% ▲ 3.00%
- Reading proficiency
- 40% ▲ 5.00%
- Median HH income
- $67,671
- Composite
- 35.84/100
- National rank
- #9606
- State rank
- #8 of 32 in DC
Livability — Washington
- Score
- 73/100
- State rank
- #1
- US rank
- #5327
Category grades
Schools grade is shown separately in the Schools card above.
Census & demographics
- Census place
- Washington, DC
- County
- District of Columbia · 671,873 people
- City population
- 671,873
- Metro
- Washington-Arlington-Alexandria, DC-VA-MD-WV
- Population (ZIP)
- 40,920
- Household income
- $49,139
- Rent vs Own
- Severe rent burden
- 4530.0
Population outlook (District of Columbia County) Hauer SSP2
- Today (2025)
- 821,926 people
- By 2030
- 899,517 · +9.4%
- By 2040
- 1,061,162 · +29.1%
- By 2050
- 1,231,493 · +49.8%
- By 2075
- 1,603,312 · +95.1%
- By 2100
- 1,847,141 · +124.7%
Race, ethnicity, and origin ACS 2023
- Neighborhood character
- Predominantly Black (80%)
- Race & ethnicity
- Black 80% White 8% Two or more races 7% Hispanic / Latino 5%
- Foreign-born
- 4% · Canada
- Languages at home
- 95% English-only · Spanish 3%
Political lean MEDSL · District of Columbia
- 2024 margin
- Solid D (+86.1) · D 91.2% · R 5.1% · Other 3.8%
- 2008→2024 swing
- +0.1pp no change · 2008: 85.9pp · 2024: 86.1pp
- All cycles
- 2024: D+86.1 2020: D+86.8 2016: D+88.7 2012: D+84.2 2008: D+85.9
Not yet ingested
- Civics
- —
Market trends
- HPI YoY
- ▼ -60.34%
- Current HPI
- 326.4077
- Rent YoY
- ▲ 3.96%
- Metro
- Washington-Arlington-Alexandria, DC-VA-MD-WV
- State GDP YoY
- ▲ 1.33%
- F500 in state
- 6
Industry mix (Fortune 500 HQ in DC)
| Industry | F500 HQs | Revenue |
|---|---|---|
| Financial Services | 1 | $153B |
|
||
| Life Sciences / Industrials | 1 | $25B |
|
||
| Industrial Machinery | 1 | $8B |
|
||
Price history
+1060.7% since first listed16 events — show timeline
- 2026-04-02 Price Changed $325,000 BRIGHT MLS
- 2026-04-02 Price Changed $340,000 BRIGHT MLS
- 2026-04-02 Relisted — BRIGHT MLS
- 2026-03-16 Contingent — BRIGHT MLS
- 2025-12-08 Relisted — BRIGHT MLS
- 2025-11-03 Listing Removed — BRIGHT MLS
- 2025-11-03 Listed $375,000 BRIGHT MLS
- 2025-10-08 Listing Removed — BRIGHT MLS
- 2025-03-12 Price Changed $415,000 BRIGHT MLS
- 2025-01-07 Price Changed $440,000 BRIGHT MLS
- 2025-01-01 Listed $450,000 BRIGHT MLS
- 2024-12-30 Coming Soon — BRIGHT MLS
- 1998-01-16 Sold (MLS) $11,000 MRIS
- 1997-12-19 Delisted — MRIS
- 1997-10-22 Listed $14,900 MRIS
- 1976-09-09 Sold (Public Records) $28,000 Public Records
Property tax history
+2.1%/yrLatest (2025): $3,176 · +4.4% YoY. Source: county tax records.
Cash-flow waterfall
monthlySold comps — $/sqft
last 12 mo · ≤1 miLoading sold comps…