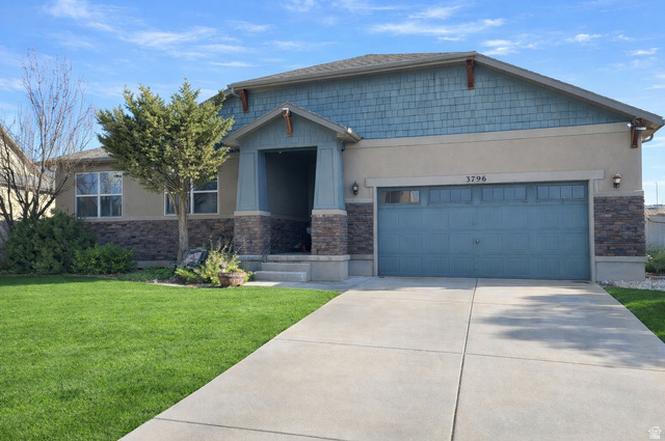
3796 N Meadow Springs Ln · Lehi, UT
Flood risk 1/10 · Minimal
- FEMA flood zone
- X (unshaded)
- Chance of flooding over 30 yrs
- 0.0%
- Est. flood insurance / yr
- $473 – $860
Fire risk 7/10 · Major
- Est. fire insurance / yr
- $453 – $841
Heat risk 4/10 · Minor
- Hot days now (above 94°F)
- 8 days/yr
- Hot days in 30 yrs
- 23 days/yr
Wind risk 1/10 · Minimal
- Chance of severe wind over 30 yrs
- —
Air-quality risk 2/10 · Minimal
- Unhealthy air days now
- 1 days/yr
- Unhealthy air days in 30 yrs
- 2 days/yr
Risk factors via First Street. Map © Google.
Why this score? — see what drove the D grade
The composite is a weighted blend of 9 inputs, each scored 0–100. Each bar is that input's sub-score; the figure is the points it added to the 100-point composite (weight × sub-score).
- Appreciation +10.0/10.0
- ARV discount +7.5/15.0
- Cash flow +6.5/30.0
- Livability +4.4/5.0
- Schools +4.2/10.0
- Rent growth +2.5/5.0
- Condition / age +2.5/5.0
- 1% rule +1.7/10.0
- DSCR +0.8/10.0
$809,900
🖨 Deal sheet 📄 Offer letter ✓ Due diligence
Listing remarks MLS
There are no remarks available.
Key facts
- Open main level
- Large family room
- Granite countertops
Tags
Property features AI
Finance
- HOA & community: Homeowners association with $80 monthly fee; Community clubhouse; Subdivision: THANKSGIVING MEADOWS PUD
Exterior
- Parking: Attached garage; 2 total parking spaces; 2 garage spaces; 2 covered parking spaces
- Utilities: Natural gas connected; Electricity connected; Sewer connected; Culinary water connected
- Home design: Rambler/Ranch style; Single-level living (accessibility feature); Single-family property; Built/standing construction; Stone and stucco exterior
- Construction: Stone and stucco construction; Asphalt roof; Full basement
- Exterior features: Bay box windows; Double-pane windows; Foyer entry; Exterior lighting; Sliding glass doors; Asphalt roof; Full fencing; Automatic full sprinkler system; Paved road; Curb and gutter; Mountain view; Landscaping: full; Mature trees; Flat terrain
Interior
- Kitchen: Refrigerator; Double oven; Freestanding range/oven; Granite countertops; Garbage disposal
- Bedrooms: 4 main-level bedrooms
- Flooring: Carpet; Hardwood; Vinyl
- Bathrooms: 3 full bathrooms; 1 half bathroom; 1 partial bathroom
- Heating & cooling: Forced air heating (gas central); Central air conditioning
- Interior features: Primary bathroom; Separate tub and shower in bath; Walk-in closet; Den/office; Garbage disposal; French doors; Great room; Double oven; Freestanding range/oven; Vaulted ceilings; Granite countertops; Blinds and drapes
- Laundry & utility: Electric dryer hookup; Full finished basement (100%)
Neighborhood map
What this means for you Summary
Snapshot
- This is a 3-bed/3.5-bath single-family listed at $810k.
Deal economics
- At list price, monthly cash flow is $-1k ($-17k/yr) — negative.
- To cash-flow at today's rent, offer at most $610k (24.6% below list).
- To meet the 1% rule (rent ≥ 1% of price), the offer needs to be $544k (32.8% below list).
- Recommended offer: $544k (32.8% below list) — sets the bar for 1% rule.
Location & tenants
- Location reads 88/100 on livability (#6 in UT, #242 nationally) — a professional / high-income tenant draw. Strengths: crime A+, commute A+, employment A+; Watch: cost of living F.
- Alpine District (suburban): math 45% / reading 50% proficiency, ranked #25 of 80 in UT (top 31%) — families likely to look elsewhere, expect single-tenant / working-renter base with shorter leases; only 18% free/reduced lunch — higher-income household profile.
- Zoned schools: Fox Hollow School (math 60% / reading 57%, grade B-, #66 of 585 statewide, top 12%, 776 students, 16% FRL); Lehi Jr High (math 54% / reading 54%, grade B-, #14 of 138 statewide, top 10%, 995 students, 13% FRL); Skyridge High School (math 42% / reading 62%, grade D+, #24 of 171 statewide, top 14%, 2,387 students, 11% FRL).
- Market conditions: 324 active listings in the ZIP; 2 comparable units currently listed for rent nearby; 6,326 units permitted in Utah County in 2024 (1,053 in 5+ unit buildings).
Forward outlook
- In year one you build about $87k of equity ($6k loan paydown + $81k appreciation (10.0% local appreciation)).
- Utah County population projected at +49% by 2050 — long-run rental-demand tailwind backs the buy-and-hold thesis.
- By year 2, paydown + projected appreciation supports a ~$139k cash-out refi (75% LTV) — recoverable capital for the next deal without selling this one.
Negotiation context
- It's been on market 132 days — a 12% lower offer ($713k) is reasonable based on typical stale-listing flexibility.
- 5 sale attempts since 16y ago with the ask held roughly flat each time — persistent listings suggest the price (not the market) is what's stuck; bring a comps-based counter.
Risks & watch-outs
- Climate carrying-cost: major wildfire risk — expect insurance premiums to compound above CPI over the hold.
Questions for the listing agent
- What do current leases actually rent for vs. the listed asking? Can we see a recent rent roll and the last 12 months of T-12 income?
- It's been on market 132 days. Have you received any prior offers? Is the seller open to a 33% concession, seller financing, or rate buy-down credit?
- What does the HOA fee cover, when was the last increase, and are there any pending special assessments or reserve-fund shortfalls?
- Why hasn't it sold? Are there any deal-killer items the seller is aware of (foundation, flood, title, zoning, code violations)?
- Is there a deadline driving the sale (1031 exchange, divorce, estate, relocation)? That informs how much negotiation room exists.
- Schools are B-rated — typically a magnet for longer-tenancy family renters. What's the average tenant stay here, and is there a school-zone premium baked into asking?
- The area grade is low — what's the realistic commute time and amenity access for the typical tenant pool here? Any planned neighborhood developments (good or bad) we should know about?
- What's the average days-on-market for RENTAL listings here right now (not sales)? A rising rental-DOM trend means longer vacancies and softer asking-rent achievability than the comps imply.
- What's the recent tenant-quality profile in this submarket — average credit score on applications, eviction rate, late-payment / NSF rate, and stable-employment percentage? A property-management company in the area should have these aggregated.
- How much new for-sale + rental construction is in the pipeline within 1–3 miles? Heavy new supply typically softens prices + rents 12–24 months out; constrained supply supports both.
Investment metrics
- 1% rule
- 0.67% ✗
- Cap rate
- 4.25%
- Cash-on-cash
- -7.30%
- DSCR
- 0.68
- GRM
- 12.4
CMA / ARV
No comps found within radius.
Projected returns pro-forma
10.0% appreciation · 3.0% rent growth · sell at horizon
- IRR
- 19.1%
- Equity multiple
- 2.56×
- Total profit
- $353,402
- Equity at exit
- $729,622
- IRR
- 17.7%
- Equity multiple
- 5.89×
- Total profit
- $1,110,034
- Equity at exit
- $1,573,458
Cash invested: $226,772 (down + closing). Projections, not guarantees.
Landlord ↔ Tenant lean methodology
- Overall (STATE)
- 86 Strongly Landlord-Friendly
- State Utah
- 86 Strongly Landlord-Friendly · R+15
- County
- — inherits STATE
- City
- — inherits STATE
ZIP-level market 84048
- Home prices YoY
- 16.8%
- Active inventory
- 324
- Price-to-rent
- 12.4×
Monthly cashflow live
- Estimated rent
- $5,441 medium interval (Pro) →
- Mortgage (P&I)
- −$4,247
- Tax est. 1.5%
- −$1,012 /mo · $12,148/yr
- Insurance
- −$337
- HOA
- −$80
- Vacancy / Maint / Mgmt
- −$1,143
- Net cashflow
- $-1,379
Break-even live
UW: 25.0% down · 7.5% · 30yr · 1.5% tax · 5.0% vac · 8.0% maint · 8.0% mgmt
Financing live
Cash to close
- Down payment
- $202,475
- Closing costs
- $24,297
- Reserves months
- —
- Total cash needed
- —
Loan-product check · same deal, 3 products live
Conventional
25% down · 7.5% · 30yr
- Down + closing
- —
- Monthly P&I
- —
- Monthly cashflow
- —
- DSCR
- —
- Eligible?
- —
Personal DTI + credit; lowest rate.
DSCR
20% down · 8.5% · 30yr
- Down + closing
- —
- Monthly P&I
- —
- Monthly cashflow
- —
- DSCR
- —
- Eligible?
- —
No personal income docs; deal must DSCR.
Hard money
10% down · 12.0% · 12mo
- Down + closing
- —
- Monthly P&I
- —
- Monthly cashflow
- —
- DSCR
- —
- Eligible?
- —
Short-term bridge; refi at stabilization.
Rent comps 2 comps
| Address | Beds | Baths | Sqft | Rent | $/sqft | DOM | Units | Dist |
|---|---|---|---|---|---|---|---|---|
| 2227 W Aspen Wood Loop Lehi, UT | 3.0 | 2.5 | 4328 | $3,150 | $0.73 | 23d | 1 | 1.07mi |
| 2777 Sandalwood Dr Lehi, UT | 2.0 | 1.0–2.0 | 1794 | $12,023 | $6.70 | 2d | 431 | 1.41mi |
HOA detail
- Monthly dues
- $80 · $960/yr
Listing history 29 events
-
2026-06-18days on market $809,900 Active 132 DOM
-
2026-06-17days on market $809,900 Active 131 DOM
-
2026-06-16days on market $809,900 Active 130 DOM
-
2026-06-15days on market $809,900 Active 129 DOM
-
2026-06-14days on market $809,900 Active 127 DOM
-
2026-06-13days on market $809,900 Active 126 DOM
-
2026-06-10days on market $809,900 Active 124 DOM
-
2026-06-09days on market $809,900 Active 123 DOM
-
2026-06-08days on market $809,900 Active 122 DOM
-
2026-06-07days on market $809,900 Active 121 DOM
-
2026-06-03days on market $809,900 Active 117 DOM
-
2026-06-03days on market $809,900 Active 116 DOM
-
2026-06-01days on market $809,900 Active 115 DOM
-
2026-05-31days on market $809,900 Active 114 DOM
-
2026-05-31days on market $809,900 Active 113 DOM
-
2026-04-01price $809,900
-
2026-02-06$820,000 Active
-
2017-09-21soldstatus Sold 31-char remark
Show marketing remark (31 chars)
There are no remarks available.
-
2017-09-08soldstatus
-
2017-07-25status Under Contract 31-char remark
Show marketing remark (31 chars)
There are no remarks available.
-
2017-07-14price $424,300 31-char remark
Show marketing remark (31 chars)
There are no remarks available.
-
2017-06-08price $429,900 31-char remark
Show marketing remark (31 chars)
There are no remarks available.
-
2017-05-26$442,500 Active 31-char remark
Show marketing remark (31 chars)
There are no remarks available.
-
2013-11-01historical
-
2013-05-03$369,900
-
2010-11-24historical
-
2010-05-24$299,900
-
2010-05-20historical
-
2010-01-08$299,990
ⓘ Source: listings_history table (triggers on properties + properties_extension) + one-shot
backfill from property_details.listing_events for pre-trigger history.
Climate risk First Street
- Flood 1/10 Low FEMA zone X (unshaded) · 0% chance over 30 yrs
- Wildfire 7/10 Severe
- Heat 4/10 Moderate 8 d/yr ≥94°F today · 23 d/yr by 30 yrs out
- Wind 1/10 Low
- Air quality 2/10 Low 1 unhealthy d/yr today · 2 by 30 yrs out
Nearby sold comps map
Loading sold comps map…
Walkable amenities ~0.75 mi
Loading nearby amenities…
Taxation est. · year 1
- Rental income
- $65,288
- − Mortgage interest
- −$45,367
- − Property taxes
- −$12,148
- − Insurance
- −$4,050
- − Repairs & maintenance
- −$5,223
- − Management
- −$5,223
- − HOA
- −$960
- − Depreciation
- −$23,561
- Taxable loss
- −$31,244
- Est. tax savings @ 24.0%
- +$7,498
- After-tax cash flow
- $-9,048/yr
For passive investors: Depreciation is non-cash, so a rental often shows a tax loss while cash-flowing — sheltering income. Rental losses are passive: they offset passive income freely, and up to $25,000/yr can offset ordinary (W-2) income if you actively participate and your MAGI is under $100k (phasing out to $0 by $150k); unused losses carry forward. On sale, claimed depreciation is recaptured at up to 25%, and gains may owe capital-gains tax (a 1031 exchange can defer both). Figures are a year-1 estimate at your 24.0% rate — not tax advice; consult a CPA.
Schools (NCES district)
- District
- Alpine District
- NCES district ID
- 4900030
- Math proficiency
- 45% ▼ -4.00%
- Reading proficiency
- 50% ▼ -2.00%
- Median HH income
- $68,595
- Composite
- 42.48/100
- National rank
- #3213
- State rank
- #25 of 80 in UT
Livability — Lehi
- Score
- 88/100
- State rank
- #6
- US rank
- #242
Category grades
Schools grade is shown separately in the Schools card above.
Census & demographics
- Census place
- Lehi, UT
Population outlook (Utah County) Hauer SSP2
- Today (2025)
- 693,420 people
- By 2030
- 757,324 · +9.2%
- By 2040
- 893,178 · +28.8%
- By 2050
- 1,035,842 · +49.4%
- By 2075
- 1,376,733 · +98.5%
- By 2100
- 1,609,388 · +132.1%
Not yet ingested
- Political lean
- —
- Race & ethnicity
- —
- Common origin
- —
- Civics
- —
Market trends
- HPI YoY
- ▲ 37.66%
- Current HPI
- 262.22
- Rent YoY
- —
- Metro
- —
- State GDP YoY
- ▲ 3.54%
- F500 in state
- 2
Industry mix (Fortune 500 HQ in UT)
| Industry | F500 HQs | Revenue |
|---|---|---|
| Financial Services | 1 | $3B |
|
||
Price history
+170.0% since first listed14 events — show timeline
- 2026-04-01 Price Changed $809,900 WFRMLS
- 2026-02-06 Listed $820,000 WFRMLS
- 2017-09-21 Sold (MLS) — WFRMLS
- 2017-09-08 Sold (Public Records) — Public Records
- 2017-07-25 Pending — WFRMLS
- 2017-07-14 Price Changed $424,300 WFRMLS
- 2017-06-08 Price Changed $429,900 WFRMLS
- 2017-05-26 Listed $442,500 WFRMLS
- 2013-11-01 Listing Removed — WFRMLS
- 2013-05-03 Listed $369,900 WFRMLS
- 2010-11-24 Listing Removed — WFRMLS
- 2010-05-24 Listed $299,900 WFRMLS
- 2010-05-20 Listing Removed — WFRMLS
- 2010-01-08 Listed $299,990 WFRMLS
Property tax history
-12.5%/yrLatest (2025): $504 · +58.8% YoY. Source: county tax records.
Cash-flow waterfall
monthlySold comps — $/sqft
last 12 mo · ≤1 miLoading sold comps…