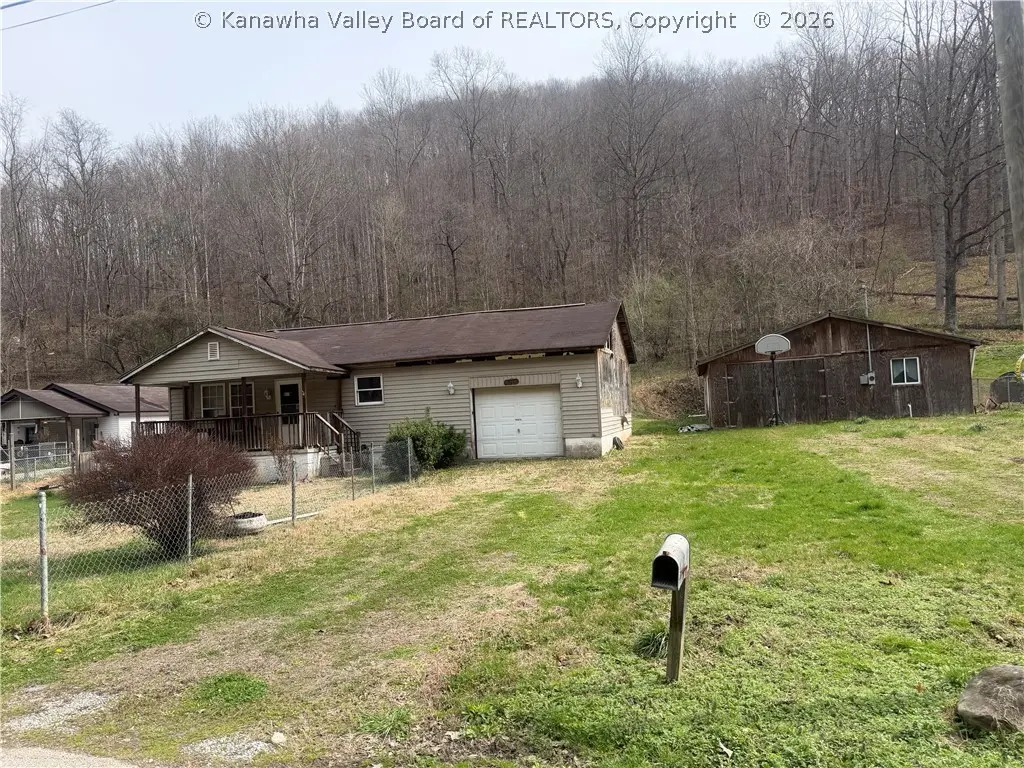
521 Long Fork Rd · Henlawson, WV
Flood risk 9/10 · Severe
- FEMA flood zone
- X (unshaded)
- Chance of flooding over 30 yrs
- 0.99%
- Est. flood insurance / yr
- $507 – $1,088
Fire risk 5/10 · Moderate
- Est. fire insurance / yr
- $787 – $1,461
Heat risk 5/10 · Moderate
- Hot days now (above 99°F)
- 8 days/yr
- Hot days in 30 yrs
- 23 days/yr
Wind risk 1/10 · Minimal
- Chance of severe wind over 30 yrs
- 1.0%
Air-quality risk 1/10 · Minimal
- Unhealthy air days now
- 0 days/yr
- Unhealthy air days in 30 yrs
- 0 days/yr
Risk factors via First Street. Map © Google.
Why this score? — see what drove the B grade
The composite is a weighted blend of 9 inputs, each scored 0–100. Each bar is that input's sub-score; the figure is the points it added to the 100-point composite (weight × sub-score).
- Cash flow +30.0/30.0
- DSCR +10.0/10.0
- 1% rule +9.0/10.0
- Appreciation +8.5/10.0
- ARV discount +7.5/15.0
- Rent growth +2.5/5.0
- Schools +2.1/10.0
- Livability +1.9/5.0
- Condition / age +1.0/5.0
$60,000
🖨 Deal sheet 📄 Offer letter ✓ Due diligence
Listing remarks
Two structures on the property. Approx. .45AC with the two lots.
Key facts
- Built 1955
- Listed 36 days
Property features AI
Exterior
- Home design: Single family residence; Residential property; 1 story
- Construction: Block construction
- Exterior features: Composition/shingle roof; Lot dimensions approximately 100 x 200 x 195 x 192
Interior
- Bathrooms: 1 full bathroom
- Heating & cooling: Forced air heating; Has heating
- Interior features: No basement; 4 total rooms
Neighborhood map
What this means for you Summary
Snapshot
- This is a 2-bed/1.0-bath single-family listed at $60k. Condition is rated poor.
Deal economics
- At list price, monthly cash flow is $185 ($2k/yr) — positive.
- The deal already cash-flows at list — no discount required.
- Meets the 1% rule at list price ($843 rent vs $60k).
- Recommended offer: $58k (3.0% below list) — sets the bar for market timing.
Location & tenants
- Location reads 38/100 on livability (#383 in WV) — a limited-amenity area; tenant pool skews transient or value-seeking. Strengths: cost of living A+, crime A; Watch: amenities F, commute F, employment F.
- Logan County Schools (rural): math 18% / reading 32% proficiency, ranked #48 of 55 in WV (top 87%) — low school quality limits family demand, transient renter base, plan for 1-2y turnover.
- Zoned schools: Chapmanville Intermediate School (math 13% / reading 21%, grade F, #363 of 377 statewide, top 97%, 306 students, 0% FRL); Chapmanville Middle School (math 13% / reading 38%, grade F, #75 of 109 statewide, top 73%, 524 students, 0% FRL); Chapmanville Regional High School (math 12% / reading 42%, grade F, #79 of 110 statewide, top 78%, 721 students, 0% FRL) — zoned schools average 0% FRL vs 49% district-wide (49 pts lower); this property's tenant base skews higher-income than the district average.
- Market conditions: 4 active listings in the ZIP; 1 units permitted in Logan County in 2024 (0 in 5+ unit buildings).
Forward outlook
- In year one you build about $5k of equity ($415 loan paydown + $4k appreciation (7.0% local appreciation)).
- Logan County population projected at -35% by 2050 — secular population decline; favor cash flow + early exit over multi-decade hold.
- At projected returns (7.0% appreciation + 3.0% rent growth), your $17k cash investment doubles in ~3 years — after that, you're playing with house money.
- By year 7, paydown + projected appreciation supports a ~$31k cash-out refi (75% LTV) — recoverable capital for the next deal without selling this one.
Negotiation context
- It's been on market 36 days — a 3% lower offer ($58k) is reasonable based on typical stale-listing flexibility.
Risks & watch-outs
- Watch-outs: flood insurance adds $66/mo; built in 1955 — expect roof / HVAC / electrical / plumbing capex.
- Climate carrying-cost: severe flood risk; moderate wildfire risk; extreme-heat days projected 8→23/yr by 2055 (HVAC capex compounding) — expect insurance premiums to compound above CPI over the hold.
Questions for the listing agent
- It's been on market 36 days. Have you received any prior offers? Is the seller open to a 3% concession, seller financing, or rate buy-down credit?
- Have any recent inspections been done? Can we get a copy of the seller's disclosures and any deferred-maintenance estimates?
- Built in 1955 — when were the roof, HVAC, electrical panel, plumbing, and water heater last replaced?
- What's the actual annual flood-insurance premium (NFIP or private), and is the property in a SFHA with mandatory coverage?
- Is there a deadline driving the sale (1031 exchange, divorce, estate, relocation)? That informs how much negotiation room exists.
- Schools are F-rated, which usually means shorter tenancies and higher turnover. Who's the typical renter profile here, and what's been the actual vacancy rate?
- What's the average days-on-market for RENTAL listings here right now (not sales)? A rising rental-DOM trend means longer vacancies and softer asking-rent achievability than the comps imply.
- What's the recent tenant-quality profile in this submarket — average credit score on applications, eviction rate, late-payment / NSF rate, and stable-employment percentage? A property-management company in the area should have these aggregated.
- How much new for-sale + rental construction is in the pipeline within 1–3 miles? Heavy new supply typically softens prices + rents 12–24 months out; constrained supply supports both.
Investment metrics
- 1% rule
- 1.40% ✓
- Cap rate
- 11.31%
- Cash-on-cash
- 17.93%
- DSCR
- 1.80
- GRM
- 5.9
CMA / ARV
No comps found within radius.
Projected returns pro-forma
7.0% appreciation · 3.0% rent growth · sell at horizon
- IRR
- 28.3%
- Equity multiple
- 2.95×
- Total profit
- $32,761
- Equity at exit
- $41,581
- IRR
- 25.9%
- Equity multiple
- 6.15×
- Total profit
- $86,538
- Equity at exit
- $78,988
Cash invested: $16,800 (down + closing). Projections, not guarantees.
Landlord ↔ Tenant lean methodology
- Overall (STATE)
- 83 Strongly Landlord-Friendly
- State West Virginia
- 83 Strongly Landlord-Friendly · R+22
- County
- — inherits STATE
- City
- — inherits STATE
ZIP-level market 25547
- Home prices YoY
- 4.4%
- Active inventory
- 4
- Price-to-rent
- 5.9×
Monthly cashflow live
- Estimated rent
- $843 medium interval (Pro) →
- Mortgage (P&I)
- −$315
- Tax est. 1.5%
- −$75 /mo · $900/yr
- Insurance
- −$25
- Flood insurance flood zone
- −$66 /mo · $798/yr
- HOA
- −$0
- Vacancy / Maint / Mgmt
- −$177
- Net cashflow
- $185
Break-even live
UW: 25.0% down · 7.5% · 30yr · 1.5% tax · 5.0% vac · 8.0% maint · 8.0% mgmt
Financing live
Cash to close
- Down payment
- $15,000
- Closing costs
- $1,800
- Reserves months
- —
- Total cash needed
- —
Loan-product check · same deal, 3 products live
Conventional
25% down · 7.5% · 30yr
- Down + closing
- —
- Monthly P&I
- —
- Monthly cashflow
- —
- DSCR
- —
- Eligible?
- —
Personal DTI + credit; lowest rate.
DSCR
20% down · 8.5% · 30yr
- Down + closing
- —
- Monthly P&I
- —
- Monthly cashflow
- —
- DSCR
- —
- Eligible?
- —
No personal income docs; deal must DSCR.
Hard money
10% down · 12.0% · 12mo
- Down + closing
- —
- Monthly P&I
- —
- Monthly cashflow
- —
- DSCR
- —
- Eligible?
- —
Short-term bridge; refi at stabilization.
Listing history 17 events
-
2026-06-18days on market $60,000 Active 36 DOM
-
2026-06-17days on market $60,000 Active 35 DOM
-
2026-06-16days on market $60,000 Active 34 DOM
-
2026-06-15days on market $60,000 Active 33 DOM
-
2026-06-15days on market $60,000 Active 32 DOM
-
2026-06-13days on market $60,000 Active 31 DOM
-
2026-06-12days on market $60,000 Active 30 DOM
-
2026-06-09days on market $60,000 Active 27 DOM
-
2026-06-08days on market $60,000 Active 26 DOM
-
2026-06-08days on market $60,000 Active 25 DOM
-
2026-06-05days on market $60,000 Active 23 DOM
-
2026-06-04days on market $60,000 Active 22 DOM
-
2026-06-03days on market $60,000 Active 21 DOM
-
2026-06-02days on market $60,000 Active 20 DOM
-
2026-06-01days on market $60,000 Active 19 DOM
-
2026-05-31days on market $60,000 Active 18 DOM
-
2026-05-13$60,000 Active
ⓘ Source: listings_history table (triggers on properties + properties_extension) + one-shot
backfill from property_details.listing_events for pre-trigger history.
Climate risk First Street
- Flood 9/10 Extreme FEMA zone X (unshaded) · 99% chance over 30 yrs
- Wildfire 5/10 Major
- Heat 5/10 Major 8 d/yr ≥99°F today · 23 d/yr by 30 yrs out
- Wind 1/10 Low 100% chance of damaging wind over 30 yrs
- Air quality 1/10 Low 0 unhealthy d/yr today · 0 by 30 yrs out
Nearby sold comps map
Loading sold comps map…
Walkable amenities ~0.75 mi
Loading nearby amenities…
Taxation est. · year 1
- Rental income
- $10,111
- − Mortgage interest
- −$3,361
- − Property taxes
- −$900
- − Insurance
- −$1,098
- − Repairs & maintenance
- −$809
- − Management
- −$809
- − Depreciation
- −$1,745
- Taxable income
- $1,389
- Est. tax owed @ 24.0%
- −$333
- After-tax cash flow
- $1,881/yr
For passive investors: Depreciation is non-cash, so a rental often shows a tax loss while cash-flowing — sheltering income. Rental losses are passive: they offset passive income freely, and up to $25,000/yr can offset ordinary (W-2) income if you actively participate and your MAGI is under $100k (phasing out to $0 by $150k); unused losses carry forward. On sale, claimed depreciation is recaptured at up to 25%, and gains may owe capital-gains tax (a 1031 exchange can defer both). Figures are a year-1 estimate at your 24.0% rate — not tax advice; consult a CPA.
Condition & rehab AI · 13 photos
This property requires extensive renovations, including kitchen, bathroom, exterior, and roof repairs. Immediate action is needed to improve the home's condition and increase its value.
Repairs flagged
- Major kitchen cabinets — dated and in poor condition
- Major kitchen flooring — checkered and worn-out
- Major bathroom fixtures — outdated and in poor condition
- Major exterior siding — weathered and boarded-up
- Major interior walls — peeling paint and cluttered
- Major roof — visible damage
Value-add opportunities
- Both kitchen renovation — modernizing the kitchen would increase both resale and rental value
- Both exterior siding and paint — renovating the exterior would improve curb appeal and increase both resale and rental value
- Both bathroom renovation — modernizing the bathroom would increase both resale and rental value
- Both roof repair — repairing the roof would improve the home's overall condition and increase both resale and rental value
Renovation cost estimate screening
| Repair item | Severity | Est. cost |
|---|---|---|
| kitchen cabinets · dated and in poor condition | Major | $15,000–50,000 |
| kitchen flooring · checkered and worn-out | Major | $15,000–50,000 |
| bathroom fixtures · outdated and in poor condition | Major | $15,000–50,000 |
| exterior siding · weathered and boarded-up | Major | $15,000–50,000 |
| interior walls · peeling paint and cluttered | Major | $15,000–50,000 |
| roof · visible damage | Major | $15,000–50,000 |
| Total estimated repair cost · 6 items | $90,000–300,000 |
Value-add ROI direction
- Both kitchen renovation — modernizing the kitchen would increase both resale and rental value ↑
- Both exterior siding and paint — renovating the exterior would improve curb appeal and increase both resale and rental value ↑
- Both bathroom renovation — modernizing the bathroom would increase both resale and rental value ↑
- Both roof repair — repairing the roof would improve the home's overall condition and increase both resale and rental value ↑
ⓘ Cost ranges are severity-bucket heuristics (US national rule-of-thumb). Get contractor quotes + a written scope before underwriting a rehab budget.
Schools (NCES district)
- District
- Logan County Schools
- NCES district ID
- 5400690
- Math proficiency
- 18% ▼ -15.00%
- Reading proficiency
- 32% ▼ -9.00%
- Median HH income
- $36,127
- Composite
- 20.68/100
- National rank
- #8531
- State rank
- #48 of 55 in WV
Livability — Henlawson
- Score
- 38/100
- State rank
- #383
- US rank
- #27501
Category grades
Schools grade is shown separately in the Schools card above.
Census & demographics
- City population
- 408
- Population (ZIP)
- 374
Population outlook (Logan County) Hauer SSP2
- Today (2025)
- 30,218 people
- By 2030
- 27,848 · -7.8%
- By 2040
- 23,262 · -23.0%
- By 2050
- 19,582 · -35.2%
- By 2075
- 12,739 · -57.8%
- By 2100
- 7,787 · -74.2%
Race, ethnicity, and origin ACS 2023
- Neighborhood character
- Predominantly White (100%)
- Race & ethnicity
- White 100%
Political lean MEDSL · Logan
- 2024 margin
- Solid R (+66.7) · D 16.1% · R 82.8% · Other 1.1%
- 2008→2024 swing
- -55.9pp toward R · 2008: -10.8pp · 2024: -66.7pp
- All cycles
- 2024: R+66.7 2020: R+63.0 2016: R+63.2 2012: R+39.7 2008: R+10.8
Not yet ingested
- Civics
- —
Market trends
- HPI YoY
- ▲ 7.00%
- Current HPI
- 164.5737
- Rent YoY
- —
- Metro
- —
- State GDP YoY
- —
- F500 in state
- 0
Price history
1 event — show timeline
- 2026-05-13 Listed $60,000 KVBOR
Cash-flow waterfall
monthlySold comps — $/sqft
last 12 mo · ≤1 miLoading sold comps…