 Multi-family
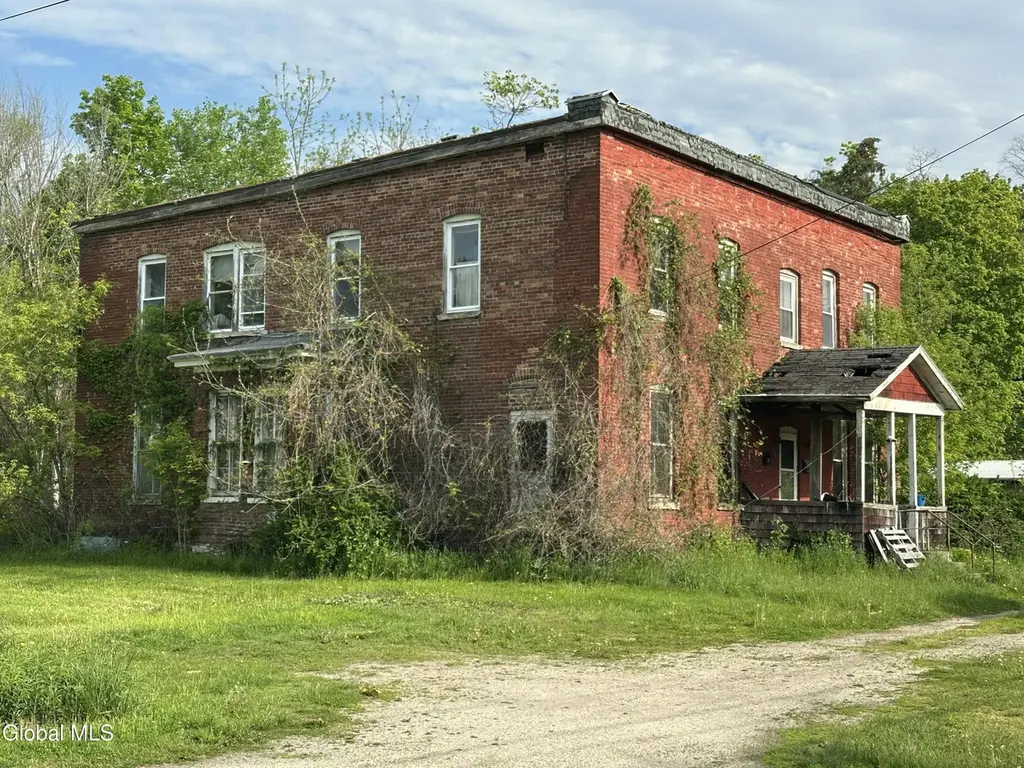
33 River Rd · Hoosick Falls, NY
Flood risk 1/10 · Minimal
- FEMA flood zone
- X (unshaded)
- Chance of flooding over 30 yrs
- 0.0%
- Est. flood insurance / yr
- $473 – $860
Fire risk 3/10 · Minor
- Est. fire insurance / yr
- $691 – $1,283
Heat risk 3/10 · Minor
- Hot days now (above 94°F)
- 7 days/yr
- Hot days in 30 yrs
- 17 days/yr
Wind risk 3/10 · Minor
- Chance of severe wind over 30 yrs
- 7.0%
Air-quality risk 2/10 · Minimal
- Unhealthy air days now
- 1 days/yr
- Unhealthy air days in 30 yrs
- 1 days/yr
Risk factors via First Street. Map © Google.
Why this score? — see what drove the C- grade
The composite is a weighted blend of 9 inputs, each scored 0–100. Each bar is that input's sub-score; the figure is the points it added to the 100-point composite (weight × sub-score).
- Cash flow +15.0/30.0
- ARV discount +7.5/15.0
- Appreciation +5.5/10.0
- 1% rule +5.0/10.0
- DSCR +5.0/10.0
- Schools +4.4/10.0
- Livability +3.6/5.0
- Rent growth +2.5/5.0
- Condition / age +2.5/5.0
$89,000
🖨 Deal sheet 📄 Offer letter ✓ Due diligence
Multi-family units
County records classify this as Multi-Family (2-4 Unit). Listing-text estimate: 1 unit. estimate disagrees with records
Listing remarks
Solid brick three-unit apartment building on a quiet street on over a half acre. The lot is level and offers plenty of room for parking, and has a horseshoe drive at the front. The house is sold as-is and requires a full renovation. Cash or renovation loan.
Key facts
- Quiet street
- Level lot
- Horseshoe drive
Tags
Property features AI
Finance
- Financial info: 3 total units; Tenants pay hot water, heat, internet, electricity and gas; Owner pays water, sewer and trash collection
Exterior
- Parking: Off-street parking for 8 vehicles
- Utilities: Public water; Public sewer; Electric: Single phase service with 150 amp panel and circuit breakers; Cable available
- Home design: Triplex; Brick construction; Stone foundation
- Construction: Brick exterior; Stone foundation; Rolled/Hot Mop roof
- Exterior features: Rolled/Hot Mop roof; Level lot; Road frontage (314 ft)
Interior
- Kitchen: Unit 1: 1 kitchen (1st floor); Unit 2: 1 kitchen (2nd floor); Unit 3: 1 kitchen (2nd floor)
- Bedrooms: Unit 1: 4 bedrooms (all on 1st floor); Unit 2: 1 bedroom (2nd floor); Unit 3: 2 bedrooms (2nd floor)
- Flooring: Hardwood flooring; Linoleum flooring
- Bathrooms: 3 full bathrooms total; Unit 1: 1 full bath (1st floor); Unit 2: 1 full bath (2nd floor); Unit 3: 1 full bath (2nd floor)
- Heating & cooling: Pellet stove heating; Propane heating; Space heaters
- Interior features: High speed internet; Basement with exterior entry and Bilco doors; Full basement
- Laundry & utility: Laundry located on main level
Neighborhood map
What this means for you Summary
Snapshot
- This is a 7-bed/3.0-bath multifamily listed at $89k.
Deal economics
- At list price, monthly cash flow is $3k ($33k/yr) — positive.
- The deal already cash-flows at list — no discount required.
- Meets the 1% rule at list price ($4k rent vs $89k).
- Recommended offer: $86k (3.0% below list) — sets the bar for market timing.
- Cap rate 43.6% vs local median 4.7% in Hoosick Falls — top-decile yield for the area; either an underpriced asset or a hidden risk that comps aren't pricing in. Stress-test before assuming the spread holds.
Location & tenants
- Location reads 72/100 on livability (#371 in NY) — a middle-class / working-renter tenant base. Strengths: housing A+, health & safety A+, cost of living A; Watch: amenities F, commute F.
- Hoosick Falls Central School District (rural): math 52% / reading 46% proficiency, ranked #469 of 755 in NY (top 62%) — families likely to look elsewhere, expect single-tenant / working-renter base with shorter leases.
- Zoned schools: Hoosick Falls Elementary School (math 54% / reading 64%, grade B-, #745 of 2,108 statewide, top 39%, 398 students, 53% FRL); Hoosick Falls High School (math 87% / reading 82%, grade A, #379 of 1,100 statewide, top 36%, 329 students, 51% FRL) — zoned schools average 52% FRL vs 35% district-wide (17 pts higher); higher-poverty schools than district average — tighter screening recommended.
- Zoned-school proficiency averages 72% at this address vs 49% district-wide (+23 pts) — the actual schools serving this property are materially stronger than the Hoosick Falls Central School District average implies; a family-tenant draw the district grade alone would hide.
- Market conditions: 49 active listings in the ZIP; 405 units permitted in Rensselaer County in 2024 (224 in 5+ unit buildings).
Forward outlook
- In year one you build about $2k of equity ($615 loan paydown + $908 appreciation (1.0% local appreciation)).
- Rensselaer County population projected to shrink 6% by 2050 — rents likely to lag national; underwrite the cash flow, not the appreciation.
- At projected returns (1.0% appreciation + 3.0% rent growth), your $25k cash investment doubles in ~1 year — after that, you're playing with house money.
Negotiation context
- It's been on market 32 days — a 3% lower offer ($86k) is reasonable based on typical stale-listing flexibility.
Risks & watch-outs
- Watch-outs: built in 1875 — expect roof / HVAC / electrical / plumbing capex.
Questions for the listing agent
- It's been on market 32 days. Have you received any prior offers? Is the seller open to a 3% concession, seller financing, or rate buy-down credit?
- Built in 1875 — when were the roof, HVAC, electrical panel, plumbing, and water heater last replaced?
- Is there a deadline driving the sale (1031 exchange, divorce, estate, relocation)? That informs how much negotiation room exists.
- What's the average days-on-market for RENTAL listings here right now (not sales)? A rising rental-DOM trend means longer vacancies and softer asking-rent achievability than the comps imply.
- What's the recent tenant-quality profile in this submarket — average credit score on applications, eviction rate, late-payment / NSF rate, and stable-employment percentage? A property-management company in the area should have these aggregated.
- How much new apartment / multifamily construction is in the pipeline within 1–3 miles? Heavy new supply (>2% of stock underway) typically softens rents 12–24 months out; light construction supports rent growth.
Investment metrics
- 1% rule
- 4.81% ✓
- Cap rate
- 43.63%
- Cash-on-cash
- 133.35%
- DSCR
- 6.93
- GRM
- 1.7
CMA / ARV
No comps found within radius.
Projected returns pro-forma
1.02% appreciation · 3.0% rent growth · sell at horizon
- IRR
- —
- Equity multiple
- 8.15×
- Total profit
- $178,196
- Equity at exit
- $30,477
- IRR
- —
- Equity multiple
- 17.03×
- Total profit
- $399,369
- Equity at exit
- $40,574
Cash invested: $24,920 (down + closing). Projections, not guarantees.
Landlord ↔ Tenant lean methodology
- Overall (STATE)
- 15 Strongly Tenant-Friendly
- State New York
- 15 Strongly Tenant-Friendly · D+10
- County
- — inherits STATE
- City
- — inherits STATE
ZIP-level market 12090
- Home prices YoY
- 0.5%
- Active inventory
- 49
- Price-to-rent
- 5.2×
Monthly cashflow live
- Estimated rent
- $4,284 medium interval (Pro) →
- Mortgage (P&I)
- −$467
- Tax est. 1.5%
- −$111 /mo · $1,335/yr
- Insurance
- −$37
- HOA
- −$0
- Vacancy / Maint / Mgmt
- −$900
- Net cashflow
- $2,769
Break-even live
3-unit breakdown (identical units grouped — click to expand)
| Units | Beds | Baths | Est. rent |
|---|---|---|---|
| 3× units | 2 | 1 | $4,284 |
| #1 | 2 | 1 | $1,428 |
| #2 | 2 | 1 | $1,428 |
| #3 | 2 | 1 | $1,428 |
| Total (3 units) | $4,284 | ||
UW: 25.0% down · 7.5% · 30yr · 1.5% tax · 5.0% vac · 8.0% maint · 8.0% mgmt
Financing live
Cash to close
- Down payment
- $22,250
- Closing costs
- $2,670
- Reserves months
- —
- Total cash needed
- —
Loan-product check · same deal, 3 products live
Conventional
25% down · 7.5% · 30yr
- Down + closing
- —
- Monthly P&I
- —
- Monthly cashflow
- —
- DSCR
- —
- Eligible?
- —
Personal DTI + credit; lowest rate.
DSCR
20% down · 8.5% · 30yr
- Down + closing
- —
- Monthly P&I
- —
- Monthly cashflow
- —
- DSCR
- —
- Eligible?
- —
No personal income docs; deal must DSCR.
Hard money
10% down · 12.0% · 12mo
- Down + closing
- —
- Monthly P&I
- —
- Monthly cashflow
- —
- DSCR
- —
- Eligible?
- —
Short-term bridge; refi at stabilization.
Listing history 16 events
-
2026-06-19days on market $89,000 Active 32 DOM
-
2026-06-18days on market $89,000 Active 31 DOM
-
2026-06-17days on market $89,000 Active 30 DOM
-
2026-06-16days on market $89,000 Active 29 DOM
-
2026-06-15days on market $89,000 Active 28 DOM
-
2026-06-14days on market $89,000 Active 26 DOM
-
2026-06-12days on market $89,000 Active 25 DOM
-
2026-06-09days on market $89,000 Active 22 DOM
-
2026-06-08days on market $89,000 Active 21 DOM
-
2026-06-07days on market $89,000 Active 20 DOM
-
2026-06-04days on market $89,000 Active 16 DOM
-
2026-06-02days on market $89,000 Active 15 DOM
-
2026-06-01days on market $89,000 Active 14 DOM
-
2026-05-31days on market $89,000 Active 13 DOM
-
2026-05-31days on market $89,000 Active 12 DOM
-
2026-05-16$89,000 Active
ⓘ Source: listings_history table (triggers on properties + properties_extension) + one-shot
backfill from property_details.listing_events for pre-trigger history.
Climate risk First Street
- Flood 1/10 Low FEMA zone X (unshaded) · 0% chance over 30 yrs
- Wildfire 3/10 Moderate
- Heat 3/10 Moderate 7 d/yr ≥94°F today · 17 d/yr by 30 yrs out
- Wind 3/10 Moderate 7% chance of damaging wind over 30 yrs
- Air quality 2/10 Low 1 unhealthy d/yr today · 1 by 30 yrs out
Nearby sold comps map
Loading sold comps map…
Walkable amenities ~0.75 mi
Loading nearby amenities…
Taxation est. · year 1
- Rental income
- $51,408
- − Mortgage interest
- −$4,985
- − Property taxes
- −$1,335
- − Insurance
- −$445
- − Repairs & maintenance
- −$4,113
- − Management
- −$4,113
- − Depreciation
- −$2,589
- Taxable income
- $33,828
- Est. tax owed @ 24.0%
- −$8,119
- After-tax cash flow
- $25,113/yr
For passive investors: Depreciation is non-cash, so a rental often shows a tax loss while cash-flowing — sheltering income. Rental losses are passive: they offset passive income freely, and up to $25,000/yr can offset ordinary (W-2) income if you actively participate and your MAGI is under $100k (phasing out to $0 by $150k); unused losses carry forward. On sale, claimed depreciation is recaptured at up to 25%, and gains may owe capital-gains tax (a 1031 exchange can defer both). Figures are a year-1 estimate at your 24.0% rate — not tax advice; consult a CPA.
Schools (NCES district)
- District
- Hoosick Falls Central School District
- NCES district ID
- 3614760
- Math proficiency
- 52% ▲ 5.00%
- Reading proficiency
- 46% ▬ 0.00%
- Median HH income
- $54,349
- Composite
- 44.44/100
- National rank
- #6093
- State rank
- #469 of 755 in NY
Livability — Hoosick Falls
- Score
- 72/100
- State rank
- #371
- US rank
- #6412
Category grades
Schools grade is shown separately in the Schools card above.
Census & demographics
- Census place
- Hoosick Falls, NY
- Population (ZIP)
- 5,874
Population outlook (Rensselaer County) Hauer SSP2
- Today (2025)
- 162,400 people
- By 2030
- 161,746 · -0.4%
- By 2040
- 158,095 · -2.7%
- By 2050
- 152,966 · -5.8%
- By 2075
- 140,767 · -13.3%
- By 2100
- 124,727 · -23.2%
Race, ethnicity, and origin ACS 2023
- Neighborhood character
- Predominantly White (93%)
- Race & ethnicity
- White 93% Hispanic / Latino 5% Two or more races 2%
- Common ancestry
- Romanian 6% Lithuanian 5% Iranian 3%
- Foreign-born
- 2% · Canada
- Languages at home
- 94% English-only · Spanish 2% German/W. Germanic 1% Russian/Polish/Slavic 1%
Political lean MEDSL · Rensselaer
- 2024 margin
- Toss-up / Even · D 50.7% · R 49.3%
- 2008→2024 swing
- -8.0pp toward R · 2008: 9.3pp · 2024: 1.4pp
- All cycles
- 2024: D+1.4 2020: D+5.6 2016: R+2.9 2012: D+11.8 2008: D+9.3
Not yet ingested
- Civics
- —
Market trends
- HPI YoY
- ▲ 1.02%
- Current HPI
- 218.9096
- Rent YoY
- —
- Metro
- —
- State GDP YoY
- ▲ 2.60%
- F500 in state
- 92
Industry mix (Fortune 500 HQ in NY)
| Industry | F500 HQs | Revenue |
|---|---|---|
| Financial Services | 10 | $950B |
|
||
| Consumer Goods | 9 | $162B |
|
||
| Insurance | 4 | $225B |
|
||
| Telecommunications | 2 | $144B |
|
||
| Pharmaceuticals | 2 | $112B |
|
||
| Media / Entertainment | 2 | $69B |
|
||
Price history
1 event — show timeline
- 2026-05-16 Listed $89,000 Global MLS
Property tax history
+2.1%/yrLatest (2025): $5,722 · +6.3% YoY. Source: county tax records.
Cash-flow waterfall
monthlySold comps — $/sqft
last 12 mo · ≤1 miLoading sold comps…