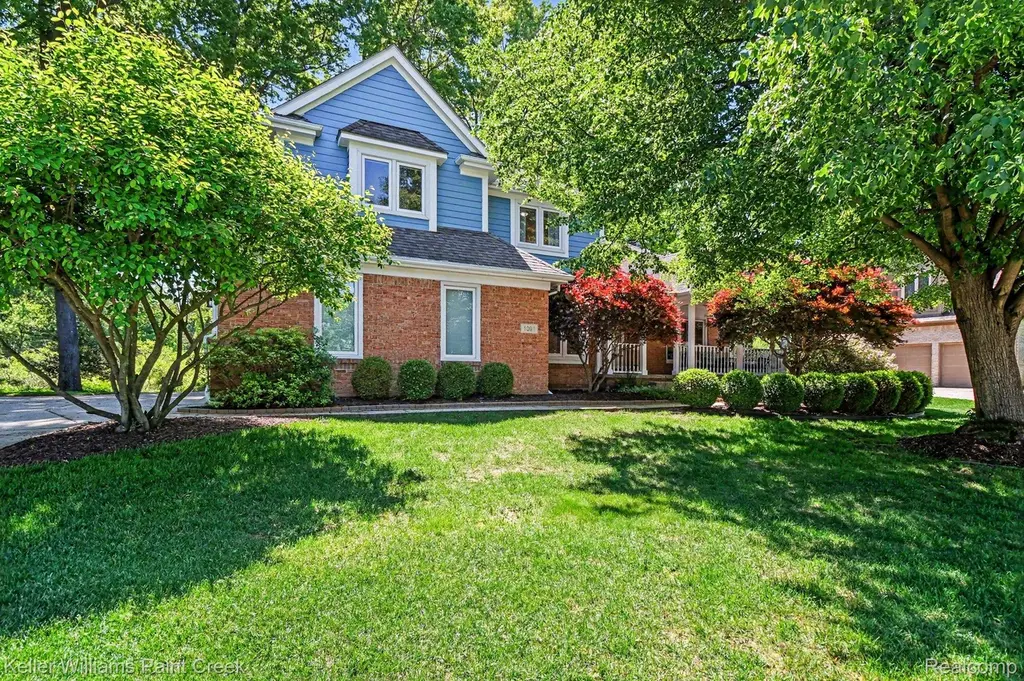
1091 American Elm St · Lake Orion, MI
Flood risk 1/10 · Minimal
- FEMA flood zone
- X (unshaded)
- Chance of flooding over 30 yrs
- 0.0%
- Est. flood insurance / yr
- $473 – $860
Fire risk 1/10 · Minimal
- Est. fire insurance / yr
- $784 – $1,456
Heat risk 2/10 · Minimal
- Hot days now (above 96°F)
- 7 days/yr
- Hot days in 30 yrs
- 15 days/yr
Wind risk 2/10 · Minimal
- Chance of severe wind over 30 yrs
- —
Air-quality risk 3/10 · Minor
- Unhealthy air days now
- 2 days/yr
- Unhealthy air days in 30 yrs
- 4 days/yr
Risk factors via First Street. Map © Google.
Why this score? — see what drove the C- grade
The composite is a weighted blend of 9 inputs, each scored 0–100. Each bar is that input's sub-score; the figure is the points it added to the 100-point composite (weight × sub-score).
- Cash flow +24.2/30.0
- DSCR +7.8/10.0
- 1% rule +5.6/10.0
- Schools +5.1/10.0
- Livability +4.0/5.0
- Rent growth +2.5/5.0
- Condition / age +2.5/5.0
- ARV discount +0.0/15.0
- Appreciation +0.0/10.0
$550,000
🖨 Deal sheet 📄 Offer letter ✓ Due diligence
Listing remarks MLS
Tucked into one of Orion's exclusive enclaves of executive homes, adjacent to the Paint Creek Trail and surrounded by the natural beauty of Bald Mountain State Recreation Area, this meticulously maintained colonial offers the privacy and peaceful setting you've been searching for. A tranquil, wooded backdrop creates beautiful views in every season, while the welcoming covered farmhouse porch invites you to slow down, relax, and stay awhile. Inside, the open floor plan offers an easy, practical flow with thoughtful updates throughout. The front office, with its cathedral ceiling, flexes beautifully as a home office, den, or library. The great room is warm and inviting, centered around a cozy gas fireplace with built-ins and large windows that showcase the stunning natural setting. The spacious kitchen opens seamlessly to the great room and features white cabinetry, granite countertops, an island, and a generous breakfast nook with plenty of room for gathering. A large patio extends the living space outdoors, making entertaining and everyday living a breeze. Beyond the kitchen is the hardworking side of the home, offering a spacious laundry room, powder room, and convenient garage entry. Upstairs, the primary suite features a beautifully remodeled bath with dual sinks, updated cabinetry, soaking tub, and separate Euro-style shower. The additional bedrooms are spacious and full of character, with features including fresh paint and built-ins, and share a beautifully updated bath. The finished basement adds exceptional flexibility with space for movie nights, gaming, hobbies, crafting, a home gym, second office, workshop, and abundant storage. Major updates include a whole-house Generac generator, central vacuum, brand-new carpeting, fresh interior and exterior paint, furnace and A/C (2023), and water heater (2022). Outdoor adventure is always close by with direct access to Bald Mountain and the Paint Creek Trail right from the neighborhood.
Key facts
- Cozy gas fireplace
- Open floor plan
- Cathedral ceiling
Tags
Property features AI
Finance
- Other: Pets allowed; Located in WHITE OAK subdivision
- HOA & community: Homeowners association with $300 annual fee (about $25/month)
Exterior
- Parking: Attached 2-car garage; Driveway; Garage door opener; Garage faces side; Direct access from garage
- Utilities: Public water; Public sewer; Natural gas available
- Home design: Single-family residence; Two levels; Ground-level entry with steps; Brick veneer and wood siding exterior
- Construction: Asphalt roof
- Exterior features: Patio; Porch; Wetlands on the lot; Wooded lot; Paved road access
Interior
- Kitchen: Dishwasher; Free-standing electric range; Free-standing refrigerator; Gas water heater
- Bathrooms: 2 full bathrooms; 1 half bathroom
- Heating & cooling: Forced-air heating (natural gas); Central air; Ceiling fans
- Interior features: Central vacuum; Smart thermostat; Finished basement with sump pump; Fireplace (gas) in great room
- Laundry & utility: Laundry room; Washer; Dryer
Neighborhood map
What this means for you Summary
Snapshot
- This is a 4-bed/2.5-bath single-family listed at $550k.
Deal economics
- At list price, monthly cash flow is $1k ($13k/yr) — positive.
- The deal already cash-flows at list — no discount required.
- Meets the 1% rule at list price ($6k rent vs $550k).
- Cap rate 8.7% vs local median 4.7% in Lake Orion — top-decile yield for the area; either an underpriced asset or a hidden risk that comps aren't pricing in. Stress-test before assuming the spread holds.
Location & tenants
- Location reads 80/100 on livability (#77 in MI, #1,679 nationally) — a professional / high-income tenant draw. Strengths: employment A+, housing A+, cost of living A; Watch: amenities F, commute F.
- Lake Orion Community Schools (suburban): math 49% / reading 64% proficiency, ranked #45 of 540 in MI (top 8%) — acceptable for families but not a draw, mixed tenant base, ~2y average lease; only 16% free/reduced lunch — higher-income household profile.
- Market conditions: 82 active listings in the ZIP; 1 comparable units currently listed for rent nearby; 2,614 units permitted in Oakland County in 2024 (721 in 5+ unit buildings).
Forward outlook
- Local home prices are declining (-3.0%/yr); year-one equity from $4k of loan paydown is wiped out by about $16k of value loss. Plan a longer hold.
- Oakland County population projected at +10% by 2050 — modest demand growth; plan on rents tracking national, not racing it.
Negotiation context
- Only 5 days on market — expect competitive offers; lowballing is unlikely to land.
- 2 sale attempts with the ask held roughly flat each time — persistent listings suggest the price (not the market) is what's stuck; bring a comps-based counter.
- Current owner paid $223k; list at $550k implies a 147% gain — meaningful room to come down on a strong offer.
Questions for the listing agent
- What does the HOA fee cover, when was the last increase, and are there any pending special assessments or reserve-fund shortfalls?
- Is there a deadline driving the sale (1031 exchange, divorce, estate, relocation)? That informs how much negotiation room exists.
- Schools are A-rated — typically a magnet for longer-tenancy family renters. What's the average tenant stay here, and is there a school-zone premium baked into asking?
- What's the average days-on-market for RENTAL listings here right now (not sales)? A rising rental-DOM trend means longer vacancies and softer asking-rent achievability than the comps imply.
- What's the recent tenant-quality profile in this submarket — average credit score on applications, eviction rate, late-payment / NSF rate, and stable-employment percentage? A property-management company in the area should have these aggregated.
- How much new for-sale + rental construction is in the pipeline within 1–3 miles? Heavy new supply typically softens prices + rents 12–24 months out; constrained supply supports both.
Investment metrics
- 1% rule
- 1.06% ✓
- Cap rate
- 8.68%
- Cash-on-cash
- 8.53%
- DSCR
- 1.38
- GRM
- 7.8
CMA / ARV
- ARV (on-the-fly)
- $385,884
- Comps found
- 6
Show comp detail 6 sales within ~0.75 mi
| Address | Dist | Beds/Ba | Sqft | Sold | Price | $/sf | Match |
|---|---|---|---|---|---|---|---|
| 1239 Cottonwood St | 0.08mi | 4/2.5 | 2,629 (+10%) | 2mo | $540,000 | $205 | 78 |
| 215 Parkview Blvd | 0.35mi | 3/1.5 (-1) | 2,412 (+1%) | 2mo | $350,000 | $145 | 71 |
| 350 Parkview Blvd | 0.30mi | 3/3.0 (-1) | 2,125 (-11%) | 8mo | $370,000 | $174 | 54 |
| 829 Markdale St | 0.41mi | 4/2.0 | 2,284 (-4%) | 23mo | $310,000 | $136 | 53 |
| 167 Glanworth St | 0.70mi | 3/2.0 (-1) | 2,148 (-10%) | 9mo | $340,000 | $158 | 37 |
| 850 Buckhorn Dr | 0.69mi | 4/2.0 | 2,034 (-15%) | 22mo | $330,000 | $162 | 23 |
Match score weights: distance 35% · size 25% · config 20% · recency 20%. Top-matched comps best support the ARV.
Projected returns pro-forma
-3.0% appreciation · 3.0% rent growth · sell at horizon
- IRR
- -3.4%
- Equity multiple
- 0.87×
- Total profit
- $-19,478
- Equity at exit
- $82,007
- IRR
- 6.3%
- Equity multiple
- 1.47×
- Total profit
- $72,496
- Equity at exit
- $47,554
Cash invested: $154,000 (down + closing). Projections, not guarantees.
Landlord ↔ Tenant lean methodology
- Overall (STATE)
- 62 Landlord-Friendly
- State Michigan
- 62 Landlord-Friendly · EVEN
- County
- — inherits STATE
- City
- — inherits STATE
ZIP-level market 48360
- Active inventory
- 82
- Price-to-rent
- 7.8×
Monthly cashflow live
- Estimated rent
- $5,850 medium interval (Pro) →
- Mortgage (P&I)
- −$2,884
- Tax from tax record
- −$388 /mo · $4,660/yr
- Insurance
- −$229
- HOA
- −$25
- Vacancy / Maint / Mgmt
- −$1,228
- Net cashflow
- $1,095
Break-even live
UW: 25.0% down · 7.5% · 30yr · 1.5% tax · 5.0% vac · 8.0% maint · 8.0% mgmt
Financing live
Cash to close
- Down payment
- $137,500
- Closing costs
- $16,500
- Reserves months
- —
- Total cash needed
- —
Loan-product check · same deal, 3 products live
Conventional
25% down · 7.5% · 30yr
- Down + closing
- —
- Monthly P&I
- —
- Monthly cashflow
- —
- DSCR
- —
- Eligible?
- —
Personal DTI + credit; lowest rate.
DSCR
20% down · 8.5% · 30yr
- Down + closing
- —
- Monthly P&I
- —
- Monthly cashflow
- —
- DSCR
- —
- Eligible?
- —
No personal income docs; deal must DSCR.
Hard money
10% down · 12.0% · 12mo
- Down + closing
- —
- Monthly P&I
- —
- Monthly cashflow
- —
- DSCR
- —
- Eligible?
- —
Short-term bridge; refi at stabilization.
Rent comps 1 comps
| Address | Beds | Baths | Sqft | Rent | $/sqft | DOM | Units | Dist |
|---|---|---|---|---|---|---|---|---|
| 442 Mystic Cove Ln Lake Orion, MI | 2.0–4.0 | 2.0–3.0 | 1989 | $5,850 | $2.94 | 1d | 4 | 0.88mi |
HOA detail
- Monthly dues
- $25 · $300/yr
- Likely covers
- watergasgym
Listing history 5 events
-
2026-06-13statusdays on market $550,000 Pending 5 DOM
-
2026-06-09days on market $550,000 Active 4 DOM
-
2026-06-08days on market $550,000 Active 3 DOM
-
2026-06-07remarks 699-char remark
-
2026-06-07$550,000 Active 2 DOM
ⓘ Source: listings_history table (triggers on properties + properties_extension) + one-shot
backfill from property_details.listing_events for pre-trigger history.
Tax reassessment forecast MI · Partial reset (capped growth)
- Current annual tax
- $4,660 · $388/mo
- Projected year-2 tax
- $6,565 · $547/mo
- Expected delta
- +$1,905/yr (+$159/mo · 40.9%)
ⓘ Screening estimate from a state-policy table — verify with the county assessor before closing.
Climate risk First Street
- Flood 1/10 Low FEMA zone X (unshaded) · 0% chance over 30 yrs
- Wildfire 1/10 Low
- Heat 2/10 Low 7 d/yr ≥96°F today · 15 d/yr by 30 yrs out
- Wind 2/10 Low
- Air quality 3/10 Moderate 2 unhealthy d/yr today · 4 by 30 yrs out
Nearby sold comps map
Loading sold comps map…
Walkable amenities ~0.75 mi
Loading nearby amenities…
Taxation est. · year 1
- Rental income
- $70,200
- − Mortgage interest
- −$30,809
- − Property taxes
- −$4,660
- − Insurance
- −$2,750
- − Repairs & maintenance
- −$5,616
- − Management
- −$5,616
- − HOA
- −$300
- − Depreciation
- −$16,000
- Taxable income
- $4,450
- Est. tax owed @ 24.0%
- −$1,068
- After-tax cash flow
- $12,069/yr
For passive investors: Depreciation is non-cash, so a rental often shows a tax loss while cash-flowing — sheltering income. Rental losses are passive: they offset passive income freely, and up to $25,000/yr can offset ordinary (W-2) income if you actively participate and your MAGI is under $100k (phasing out to $0 by $150k); unused losses carry forward. On sale, claimed depreciation is recaptured at up to 25%, and gains may owe capital-gains tax (a 1031 exchange can defer both). Figures are a year-1 estimate at your 24.0% rate — not tax advice; consult a CPA.
Schools (NCES district)
- District
- Lake Orion Community Schools
- NCES district ID
- 2620730
- Math proficiency
- 49% ▼ -10.00%
- Reading proficiency
- 64% ▼ -10.00%
- Median HH income
- $82,396
- Composite
- 51.21/100
- National rank
- #1755
- State rank
- #45 of 540 in MI
Livability — Lake Orion
- Score
- 80/100
- State rank
- #77
- US rank
- #1679
Category grades
Schools grade is shown separately in the Schools card above.
Census & demographics
- Population (ZIP)
- 12,250
Population outlook (Oakland County) Hauer SSP2
- Today (2025)
- 1,335,747 people
- By 2030
- 1,375,100 · +2.9%
- By 2040
- 1,435,385 · +7.5%
- By 2050
- 1,469,250 · +10.0%
- By 2075
- 1,531,946 · +14.7%
- By 2100
- 1,450,485 · +8.6%
Race, ethnicity, and origin ACS 2023
- Neighborhood character
- Predominantly White (78%)
- Race & ethnicity
- White 78% Two or more races 8% Hispanic / Latino 8% Asian 8% Black 1%
- Hispanic origin (detail)
- Mexican 3% Puerto Rican 4%
- Common ancestry
- Romanian 12% Lithuanian 4% Slovak 4%
- Foreign-born
- 11% · Canada, China
- Languages at home
- 88% English-only · Other Asian/Pacific 3% Other Indo-European 3% Spanish 3%
Political lean MEDSL · Oakland
- 2024 margin
- D (+10.6) · D 54.4% · R 43.8% · Other 1.9%
- 2008→2024 swing
- -3.9pp toward R · 2008: 14.5pp · 2024: 10.6pp
- All cycles
- 2024: D+10.6 2020: D+14.1 2016: D+8.1 2012: D+8.1 2008: D+14.5
Not yet ingested
- Civics
- —
Market trends
- HPI YoY
- ▼ -226.18%
- Current HPI
- 180.3844
- Rent YoY
- —
- Metro
- —
- State GDP YoY
- ▲ 1.37%
- F500 in state
- 28
Industry mix (Fortune 500 HQ in MI)
| Industry | F500 HQs | Revenue |
|---|---|---|
| Automotive Parts | 3 | $48B |
|
||
| Automotive | 2 | $372B |
|
||
| Chemicals | 1 | $45B |
|
||
| Automotive Retail | 1 | $29B |
|
||
| Healthcare / Medical Devices | 1 | $23B |
|
||
| Automotive Technology | 1 | $20B |
|
||
Price history
+1045.8% since first listed4 events — show timeline
- 2026-06-05 Listed $550,000 MiRealSource-MiMLS
- 2026-06-05 Listed $550,000 REALCOMP
- 1995-08-15 Sold (Public Records) $223,000 Public Records
- 1995-02-14 Sold (Public Records) $48,000 Public Records
Property tax history
+3.9%/yrLatest (2025): $4,660 · +2.7% YoY. Source: county tax records.
Cash-flow waterfall
monthlySold comps — $/sqft
last 12 mo · ≤1 miLoading sold comps…