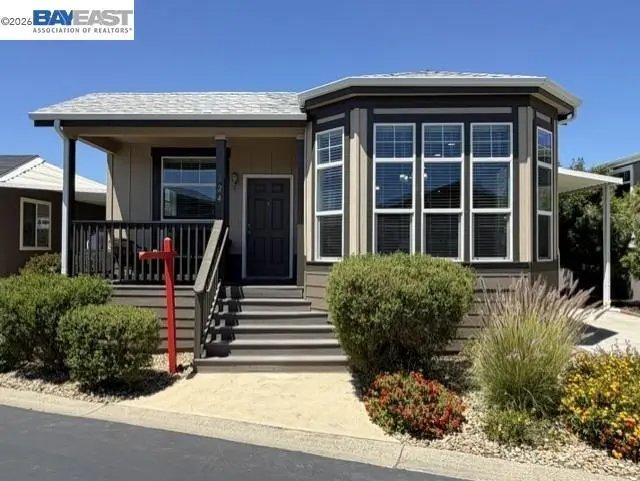
3263 Vineyard Ave #124 #124 · Pleasanton, CA
Flood risk 1/10 · Minimal
- FEMA flood zone
- X (unshaded)
- Chance of flooding over 30 yrs
- 0.0%
- Est. flood insurance / yr
- $507 – $1,088
Fire risk 6/10 · Moderate
- Est. fire insurance / yr
- $659 – $1,223
Heat risk 4/10 · Minor
- Hot days now (above 97°F)
- 7 days/yr
- Hot days in 30 yrs
- 14 days/yr
Wind risk 1/10 · Minimal
- Chance of severe wind over 30 yrs
- —
Air-quality risk 9/10 · Severe
- Unhealthy air days now
- 19 days/yr
- Unhealthy air days in 30 yrs
- 21 days/yr
Risk factors via First Street. Map © Google.
Why this score? — see what drove the C- grade
The composite is a weighted blend of 9 inputs, each scored 0–100. Each bar is that input's sub-score; the figure is the points it added to the 100-point composite (weight × sub-score).
- Cash flow +22.4/30.0
- Schools +7.3/10.0
- DSCR +7.2/10.0
- 1% rule +4.6/10.0
- Livability +4.2/5.0
- Rent growth +4.0/5.0
- Condition / age +2.5/5.0
- ARV discount +0.0/15.0
- Appreciation +0.0/10.0
$389,900
🖨 Deal sheet 📄 Offer letter ✓ Due diligence
Listing remarks MLS
Brand new manufactured home state of the art design its a must see inside and out. Open floor plan 3 bedrooms 2 baths. A kitchen to die w granite counter tops stainless steel appliances farm sink with built in self clean oven & cook top, 9 ft ceilings w/ a coffer ceiling in kitchen and master bedroom energy efficient home, 2x6 outer wall construction, R 38 insulation R 23 walls R 33 in the floor in the ceiling dual pane windows crown molding 5 1/4" baseboards, country porch, new driveway loaded with extras throughout the home. $65,000 worth of factory upgrades in this gorgeous home. Enjoy world class living in beautiful Vineyard Estates. Your close to some of the best medical facilities in the United States.
Key facts
- Ltv flooring
- Tray ceiling
- Spacious kitchen
Tags
Property features AI
Finance
- HOA & community: Vineyard Estates park; Senior community; Clubhouse; Greenbelt; Fitness center; Community pool and heated spa; Laundry facilities; Game room and rec room with fireplace; Guest parking; RV storage; Car wash area; Park interview required; Pet policies: cats and dogs allowed (approval required; number and size limits); Electric and gas metered
Exterior
- Parking: Carport for 2 or more cars
- Utilities: Public water; Public sewer; Individual electric meter; Individual gas meter; Gas water heater
- Home design: Manufactured in park (mobile home), double wide; Model: Creekside Mano
- Construction: Cement siding; Crawl space foundation; Built as a manufactured/mobile home
- Exterior features: Front yard; Side yard; Landscaped front; Automatic sprinklers (front); Yard space; Porch with awning(s) and porch steps; Shed(s) for additional storage
Interior
- Kitchen: Dishwasher; Gas range / cooktop; Built-in oven; Microwave; Garbage disposal; Refrigerator; Ice maker hookup; Kitchen island; Pantry; Stone counters; Updated kitchen
- Bedrooms: 3 bedrooms (street level)
- Flooring: Carpet; Linoleum; Vinyl
- Bathrooms: 2 total bathrooms; Full baths with shower over tub, solid surface finishes, updated baths, and windows; Primary bath with solid surface, stall shower, walk-in closet(s), and window
- Heating & cooling: Forced-air heating (natural gas); Central air conditioning; Ceiling fan(s)
- Interior features: Pantry; Updated kitchen; Dining area; Storage; Sun porch; 9 total rooms
- Laundry & utility: Laundry room with washer and dryer; 220-volt outlet
Neighborhood map
What this means for you Summary
Snapshot
- This is a 3-bed/2.0-bath manufactured listed at $390k.
Deal economics
- At list price, monthly cash flow is $650 ($8k/yr) — positive.
- The deal already cash-flows at list — no discount required.
- To meet the 1% rule (rent ≥ 1% of price), the offer needs to be $373k (4.4% below list).
- Recommended offer: $373k (4.4% below list) — sets the bar for 1% rule.
- Cap rate 8.3% vs local median 1.3% in Pleasanton — top-decile yield for the area; either an underpriced asset or a hidden risk that comps aren't pricing in. Stress-test before assuming the spread holds.
Location & tenants
- Location reads 84/100 on livability (#17 in CA, #655 nationally) — a professional / high-income tenant draw. Strengths: schools A+, amenities A+, commute A+; Watch: cost of living F.
- Pleasanton Unified (urban): math 75% / reading 79% proficiency, ranked #43 of 1,400 in CA (top 3%) — strong family-tenant draw, lease renewals of 3-5y typical; only 6% free/reduced lunch — higher-income household profile.
- Market conditions: Rents rising fast (+6.0%/yr); 152 active listings in the ZIP; 14 comparable units currently listed for rent nearby; rentals at typical pace (median 20d on market — plan ~3-4 weeks tenant-placement turnaround); high-income renter base; 1,742 units permitted in Alameda County in 2024 (856 in 5+ unit buildings).
Forward outlook
- Local home prices are declining (-3.0%/yr); year-one equity from $3k of loan paydown is wiped out by about $12k of value loss. Plan a longer hold.
- Alameda County population projected at +34% by 2050 — long-run rental-demand tailwind backs the buy-and-hold thesis.
- At projected returns (-3.0% appreciation + 6.0% rent growth), your $109k cash investment doubles in ~10 years — after that, you're playing with house money.
Negotiation context
- Only 9 days on market — expect competitive offers; lowballing is unlikely to land.
- 4 sale attempts since 24y ago with the ask held roughly flat each time — persistent listings suggest the price (not the market) is what's stuck; bring a comps-based counter.
Risks & watch-outs
- Climate carrying-cost: major wildfire risk — expect insurance premiums to compound above CPI over the hold.
Questions for the listing agent
- Is there a deadline driving the sale (1031 exchange, divorce, estate, relocation)? That informs how much negotiation room exists.
- Schools are A-rated — typically a magnet for longer-tenancy family renters. What's the average tenant stay here, and is there a school-zone premium baked into asking?
- What's the average days-on-market for RENTAL listings here right now (not sales)? A rising rental-DOM trend means longer vacancies and softer asking-rent achievability than the comps imply.
- What's the recent tenant-quality profile in this submarket — average credit score on applications, eviction rate, late-payment / NSF rate, and stable-employment percentage? A property-management company in the area should have these aggregated.
- How much new for-sale + rental construction is in the pipeline within 1–3 miles? Heavy new supply typically softens prices + rents 12–24 months out; constrained supply supports both.
Investment metrics
- 1% rule
- 0.96% ✗
- Cap rate
- 8.29%
- Cash-on-cash
- 7.15%
- DSCR
- 1.32
- GRM
- 8.7
CMA / ARV
- ARV (on-the-fly)
- $310,752
- Comps found
- 12
Show comp detail 12 sales within ~0.75 mi
| Address | Dist | Beds/Ba | Sqft | Sold | Price | $/sf | Match |
|---|---|---|---|---|---|---|---|
| 3231 Vineyard Ave #76 | 0.08mi | 3/2.0 | 1,431 (-4%) | 2mo | $370,000 | $259 | 88 |
| 3263 Vineyard Ave #125 | 0.01mi | 3/2.0 | 1,578 (+6%) | 6mo | $310,000 | $196 | 85 |
| 3263 Vineyard Ave #189 | 0.13mi | 3/2.0 | 1,512 (+1%) | 10mo | $350,000 | $231 | 84 |
| 3263 Vineyard Ave #178 | 0.08mi | 3/2.0 | 1,440 (-4%) | 8mo | $238,000 | $165 | 83 |
| 3263 Vineyard Ave #174 | 0.07mi | 3/2.0 | 1,600 (+7%) | 4mo | $315,000 | $197 | 82 |
| 3231 Vineyard Ave Spc 93 | 0.10mi | 2/2.0 (-1) | 1,413 (-5%) | 3mo | $287,000 | $203 | 79 |
| 3231 Vineyard Ave., #102 #102 | 0.09mi | 2/2.0 (-1) | 1,440 (-4%) | 9mo | $205,000 | $142 | 77 |
| 3263 Vineyard Ave #42 | 0.12mi | 3/2.0 | 1,590 (+6%) | 9mo | $402,000 | $253 | 76 |
| 3263 Vineyard #68 | 0.06mi | 3/2.0 | 1,300 (-13%) | 2mo | $275,000 | $212 | 74 |
| 3231 Vineyard Ave., #94 #94 | 0.09mi | 2/2.0 (-1) | 1,340 (-10%) | 0mo | $230,000 | $172 | 73 |
| 3263 Vineyard Ave. #35 #35 | 0.10mi | 2/2.0 (-1) | 1,368 (-8%) | 3mo | $295,000 | $216 | 73 |
| 3231 Vineyard #37 | 0.09mi | 2/2.0 (-1) | 1,296 (-13%) | 10mo | $270,000 | $208 | 60 |
Match score weights: distance 35% · size 25% · config 20% · recency 20%. Top-matched comps best support the ARV.
Projected returns pro-forma
-3.0% appreciation · 6.04% rent growth · sell at horizon
- IRR
- -2.4%
- Equity multiple
- 0.91×
- Total profit
- $-10,200
- Equity at exit
- $58,135
- IRR
- 10.0%
- Equity multiple
- 1.87×
- Total profit
- $95,017
- Equity at exit
- $33,711
Cash invested: $109,172 (down + closing). Projections, not guarantees.
Landlord ↔ Tenant lean methodology
- Overall (STATE)
- 18 Strongly Tenant-Friendly
- State California
- 18 Strongly Tenant-Friendly · D+13
- County
- — inherits STATE
- City
- — inherits STATE
ZIP-level market 94566
- Rents YoY
- 6.0%
- Active inventory
- 152
- Price-to-rent
- 8.7×
Monthly cashflow live
- Estimated rent
- $3,729 high interval (Pro) →
- Mortgage (P&I)
- −$2,045
- Tax from tax record
- −$88 /mo · $1,062/yr
- Insurance
- −$162
- HOA
- −$0
- Vacancy / Maint / Mgmt
- −$783
- Net cashflow
- $650
Break-even live
UW: 25.0% down · 7.5% · 30yr · 1.5% tax · 5.0% vac · 8.0% maint · 8.0% mgmt
Financing live
Cash to close
- Down payment
- $97,475
- Closing costs
- $11,697
- Reserves months
- —
- Total cash needed
- —
Loan-product check · same deal, 3 products live
Conventional
25% down · 7.5% · 30yr
- Down + closing
- —
- Monthly P&I
- —
- Monthly cashflow
- —
- DSCR
- —
- Eligible?
- —
Personal DTI + credit; lowest rate.
DSCR
20% down · 8.5% · 30yr
- Down + closing
- —
- Monthly P&I
- —
- Monthly cashflow
- —
- DSCR
- —
- Eligible?
- —
No personal income docs; deal must DSCR.
Hard money
10% down · 12.0% · 12mo
- Down + closing
- —
- Monthly P&I
- —
- Monthly cashflow
- —
- DSCR
- —
- Eligible?
- —
Short-term bridge; refi at stabilization.
Rent comps 14 comps
| Address | Beds | Baths | Sqft | Rent | $/sqft | DOM | Units | Dist |
|---|---|---|---|---|---|---|---|---|
| 749 Palomino Dr Unit C Pleasanton, CA | 2.0 | 1.5 | 1130 | $3,250 | $2.88 | 43d | 1 | 0.50mi |
| 835 Palomino Dr Unit 2 Pleasanton, CA | 2.0 | 1.5 | 1080 | $2,850 | $2.64 | 20d | 1 | 0.51mi |
| 3819 Vineyard Ave Pleasanton, CA | 1.0–3.0 | 1.0–1.5 | 863 | $3,384 | $3.92 | 1d | 14 | 0.62mi |
| 3847 Vineyard Ave Pleasanton, CA | 2.0 | 2.0 | 900 | $2,700 | $3.00 | 16d | 1 | 0.67mi |
| 242 Birch Creek Dr Pleasanton, CA | 2.0 | 2.5 | 1221 | $3,100 | $2.54 | 43d | 1 | 0.68mi |
| 223 Birch Creek Dr Pleasanton, CA | 3.0 | 2.5 | 1848 | $4,800 | $2.60 | 3d | 1 | 0.73mi |
| 3955 Vineyard Ave Pleasanton, CA | 1.0–2.0 | 1.0–1.5 | 829 | $3,436 | $4.14 | 1d | 5 | 0.79mi |
| 368 Trenton Cir Pleasanton, CA | 4.0 | 3.0 | 1620 | $5,000 | $3.09 | 24d | 1 | 0.82mi |
| 4059 Vineyard Ave Pleasanton, CA | 3.0 | 2.0 | 1300 | $3,850 | $2.96 | 24d | 1 | 0.86mi |
| 1539 Trimingham Dr Pleasanton, CA | 2.0 | 2.0 | 1369 | $3,600 | $2.63 | 1d | 1 | 1.20mi |
| 4678 Whiting St Pleasanton, CA | 3.0 | 2.0 | 1538 | $5,500 | $3.58 | 24d | 1 | 1.31mi |
| 4468 Del Valle Pkwy Unit 1 Pleasanton, CA | 2.0 | 2.0 | 1280 | $3,100 | $2.42 | 16d | 1 | 1.47mi |
| 198 Peters Ave Unit C Pleasanton, CA | 2.0 | 2.0 | 878 | $2,950 | $3.36 | 43d | 1 | 1.49mi |
| 4320 Valley Ave Pleasanton, CA | 2.0 | 2.0 | 1073 | $3,474 | $3.24 | 3d | 2 | 1.49mi |
Listing history 8 events
-
2026-06-18days on market $389,900 Active 9 DOM
-
2026-06-17days on market $389,900 Active 8 DOM
-
2026-06-16days on market $389,900 Active 7 DOM
-
2026-06-15days on market $389,900 Active 6 DOM
-
2026-06-13days on market $389,900 Active 4 DOM
-
2026-06-13days on market $389,900 Active 3 DOM
-
2026-06-10remarks 456-char remark
-
2026-06-10$389,900 Active 1 DOM
ⓘ Source: listings_history table (triggers on properties + properties_extension) + one-shot
backfill from property_details.listing_events for pre-trigger history.
Tax reassessment forecast CA · Resets to sale price
- Current annual tax
- $1,062 · $88/mo
- Projected year-2 tax
- $2,963 · $247/mo
- Expected delta
- +$1,902/yr (+$158/mo · 179.2%)
ⓘ Screening estimate from a state-policy table — verify with the county assessor before closing.
Climate risk First Street
- Flood 1/10 Low FEMA zone X (unshaded) · 0% chance over 30 yrs
- Wildfire 6/10 Major
- Heat 4/10 Moderate 7 d/yr ≥97°F today · 14 d/yr by 30 yrs out
- Wind 1/10 Low
- Air quality 9/10 Extreme 19 unhealthy d/yr today · 21 by 30 yrs out
Nearby sold comps map
Loading sold comps map…
Walkable amenities ~0.75 mi
Loading nearby amenities…
Taxation est. · year 1
- Rental income
- $44,747
- − Mortgage interest
- −$21,840
- − Property taxes
- −$1,062
- − Insurance
- −$1,950
- − Repairs & maintenance
- −$3,580
- − Management
- −$3,580
- − Depreciation
- −$11,343
- Taxable income
- $1,394
- Est. tax owed @ 24.0%
- −$335
- After-tax cash flow
- $7,469/yr
For passive investors: Depreciation is non-cash, so a rental often shows a tax loss while cash-flowing — sheltering income. Rental losses are passive: they offset passive income freely, and up to $25,000/yr can offset ordinary (W-2) income if you actively participate and your MAGI is under $100k (phasing out to $0 by $150k); unused losses carry forward. On sale, claimed depreciation is recaptured at up to 25%, and gains may owe capital-gains tax (a 1031 exchange can defer both). Figures are a year-1 estimate at your 24.0% rate — not tax advice; consult a CPA.
Schools (NCES district)
- District
- Pleasanton Unified
- NCES district ID
- 0600020
- Math proficiency
- 75% ▼ -1.00%
- Reading proficiency
- 79% ▼ -1.00%
- Median HH income
- $123,770
- Composite
- 73.12/100
- National rank
- #351
- State rank
- #43 of 1400 in CA
Livability — Pleasanton
- Score
- 84/100
- State rank
- #17
- US rank
- #655
Category grades
Schools grade is shown separately in the Schools card above.
Census & demographics
- Census place
- Pleasanton, CA
- County
- Alameda County · 1,614,355 people
- City population
- 78,550
- Metro
- San Francisco-Oakland-Berkeley, CA
- Population (ZIP)
- 44,222
- Household income
- $191,155
- Rent vs Own
- Severe rent burden
- 1190.0
Population outlook (Alameda County) Hauer SSP2
- Today (2025)
- 1,928,884 people
- By 2030
- 2,069,146 · +7.3%
- By 2040
- 2,338,405 · +21.2%
- By 2050
- 2,586,608 · +34.1%
- By 2075
- 3,061,911 · +58.7%
- By 2100
- 3,234,133 · +67.7%
Race, ethnicity, and origin ACS 2023
- Neighborhood character
- Diverse neighborhood (Simpson 0.66)
- Race & ethnicity
- White 42% Asian 38% Hispanic / Latino 13% Two or more races 10%
- Hispanic origin (detail)
- Mexican 9%
- Common ancestry
- Italian 3% Russian 3% Romanian 2%
- Foreign-born
- 33% · China, Canada, South Korea
- Languages at home
- 59% English-only · Other Indo-European 10% Chinese 10% Spanish 8%
Political lean MEDSL · Alameda
- 2024 margin
- Solid D (+53.6) · D 74.6% · R 21.0% · Other 4.4%
- 2008→2024 swing
- -5.9pp toward R · 2008: 59.5pp · 2024: 53.6pp
- All cycles
- 2024: D+53.6 2020: D+62.5 2016: D+64.4 2012: D+59.8 2008: D+59.5
Not yet ingested
- Civics
- —
Market trends
- HPI YoY
- ▼ -841.68%
- Current HPI
- 308.8324
- Rent YoY
- ▲ 6.04%
- Metro
- San Francisco-Oakland-Berkeley, CA
- State GDP YoY
- ▲ 3.21%
- F500 in state
- 116
Industry mix (Fortune 500 HQ in CA)
| Industry | F500 HQs | Revenue |
|---|---|---|
| Technology | 27 | $1,492B |
|
||
| Financial Services | 3 | $174B |
|
||
| Retail | 3 | $44B |
|
||
| Insurance | 3 | $26B |
|
||
| Media / Entertainment | 2 | $115B |
|
||
| Pharmaceuticals / Biotech | 2 | $62B |
|
||
Price history
+310.4% since first listed12 events — show timeline
- 2026-06-09 Listed $389,900 bridgeMLS, Bay East AOR, or Contra Costa AOR
- 2017-09-28 Sold (MLS) $340,750 bridgeMLS, Bay East AOR, or Contra Costa AOR
- 2017-08-26 Pending — bridgeMLS, Bay East AOR, or Contra Costa AOR
- 2017-08-10 Price Changed $369,750 bridgeMLS, Bay East AOR, or Contra Costa AOR
- 2017-07-24 Listed $389,750 bridgeMLS, Bay East AOR, or Contra Costa AOR
- 2014-04-02 Sold (MLS) $71,000 bridgeMLS, Bay East AOR, or Contra Costa AOR
- 2014-03-25 Pending — bridgeMLS, Bay East AOR, or Contra Costa AOR
- 2014-03-22 Pending — bridgeMLS, Bay East AOR, or Contra Costa AOR
- 2014-03-21 Listed $71,000 bridgeMLS, Bay East AOR, or Contra Costa AOR
- 2002-06-21 Sold (MLS) $90,000 bridgeMLS, Bay East AOR, or Contra Costa AOR
- 2002-05-10 Listing Removed — bridgeMLS, Bay East AOR, or Contra Costa AOR
- 2002-03-20 Listed $95,000 bridgeMLS, Bay East AOR, or Contra Costa AOR
Property tax history
+1.1%/yrLatest (2025): $1,062 · -0.4% YoY. Source: county tax records.
Cash-flow waterfall
monthlySold comps — $/sqft
last 12 mo · ≤1 miLoading sold comps…