7 Arbor Club Dr #211 · Palm Valley, FL
Flood risk 4/10 · Minor
- FEMA flood zone
- X (unshaded)
- Chance of flooding over 30 yrs
- 0.13%
- Est. flood insurance / yr
- $507 – $1,088
Fire risk 1/10 · Minimal
- Est. fire insurance / yr
- $947 – $1,759
Heat risk 10/10 · Severe
- Hot days now (above 103°F)
- 7 days/yr
- Hot days in 30 yrs
- 22 days/yr
Wind risk 10/10 · Severe
- Chance of severe wind over 30 yrs
- 99.0%
Air-quality risk 4/10 · Minor
- Unhealthy air days now
- 5 days/yr
- Unhealthy air days in 30 yrs
- 5 days/yr
Risk factors via First Street. Map © Google.
Why this score? — see what drove the D- grade
The composite is a weighted blend of 9 inputs, each scored 0–100. Each bar is that input's sub-score; the figure is the points it added to the 100-point composite (weight × sub-score).
- Cash flow +8.1/30.0
- ARV discount +6.6/15.0
- Schools +6.4/10.0
- 1% rule +4.6/10.0
- Rent growth +4.3/5.0
- Livability +3.5/5.0
- Condition / age +2.5/5.0
- DSCR +2.2/10.0
- Appreciation +0.0/10.0
$250,000
🖨 Deal sheet 📄 Offer letter ✓ Due diligence
Listing remarks MLS
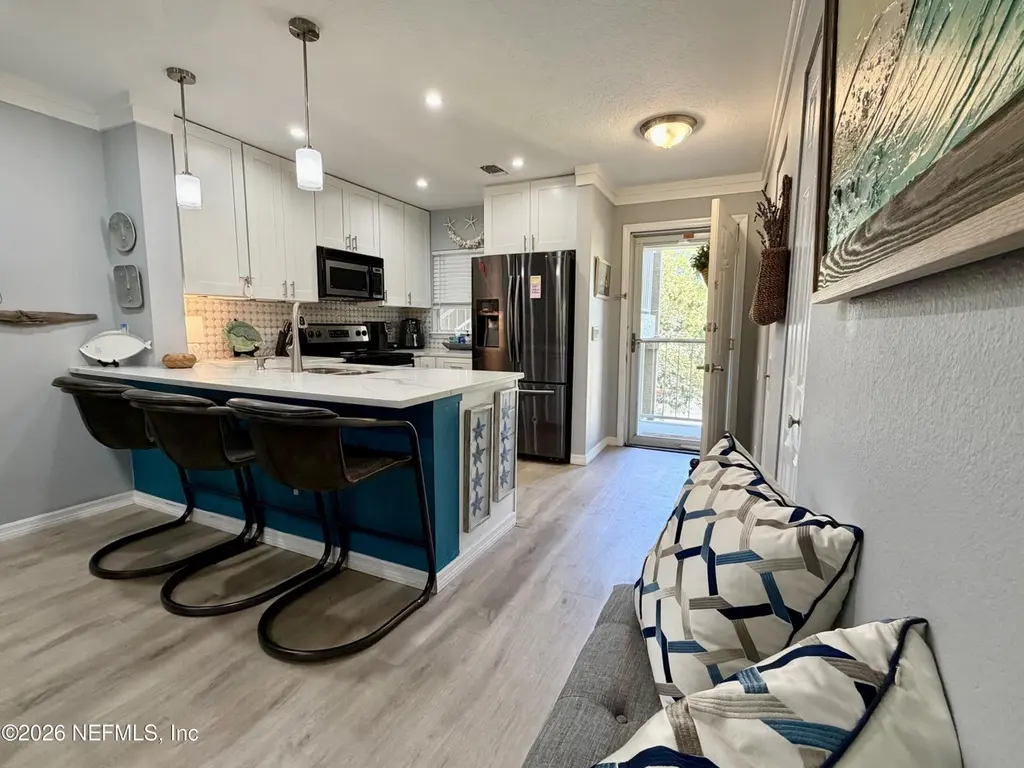
Beautifully maintained villa. Light and bright. Back Porch overlooks lagoon and fountain. Master Bath has a walk-in shower. Walk to top notch restaurants, shopping, etc. Beach access for community.
Key facts
- $526 HOA
- Built 1992
- Listed 77 days
Tags
Neighborhood map
What this means for you Summary
Snapshot
- This is a 2-bed/2.0-bath condo listed at $250k.
Deal economics
- At list price, monthly cash flow is $-242 ($-3k/yr) — negative.
- To cash-flow at today's rent, offer at most $207k (17.1% below list).
- To meet the 1% rule (rent ≥ 1% of price), the offer needs to be $241k (3.7% below list).
- Recommended offer: $207k (17.1% below list) — sets the bar for cash-flow.
- Cap rate 5.1% vs local median 2.3% in Palm Valley — top-decile yield for the area; either an underpriced asset or a hidden risk that comps aren't pricing in. Stress-test before assuming the spread holds.
Location & tenants
- Location reads 69/100 on livability (#462 in FL) — a middle-class / working-renter tenant base. Strengths: schools A+, crime A+, employment A+; Watch: amenities F, commute F, cost of living F.
- St. Johns (rural): math 75% / reading 73% proficiency, ranked #2 of 73 in FL (top 3%) — strong family-tenant draw, lease renewals of 3-5y typical; only 20% free/reduced lunch — higher-income household profile.
- Market conditions: Rents rising fast (+7.4%/yr); 333 active listings in the ZIP; 17 comparable units currently listed for rent nearby; rentals at typical pace (median 24d on market — plan ~3-4 weeks tenant-placement turnaround); high-income renter base; 5,575 units permitted in St. Johns County in 2024 (584 in 5+ unit buildings).
Forward outlook
- Local home prices are declining (-3.0%/yr); year-one equity from $2k of loan paydown is wiped out by about $8k of value loss. Plan a longer hold.
- St. Johns County population projected at +60% by 2050 — long-run rental-demand tailwind backs the buy-and-hold thesis.
Negotiation context
- It's been on market 77 days — a 6% lower offer ($235k) is reasonable based on typical stale-listing flexibility.
- 6 sale attempts since 18y ago with the ask held roughly flat each time — persistent listings suggest the price (not the market) is what's stuck; bring a comps-based counter.
Risks & watch-outs
- Watch-outs: HOA is 22% of rent.
- Climate carrying-cost: severe wind risk, 99% chance of damaging wind over 30y; extreme-heat days projected 7→22/yr by 2055 (HVAC capex compounding) — expect insurance premiums to compound above CPI over the hold.
Questions for the listing agent
- What do current leases actually rent for vs. the listed asking? Can we see a recent rent roll and the last 12 months of T-12 income?
- It's been on market 77 days. Have you received any prior offers? Is the seller open to a 17% concession, seller financing, or rate buy-down credit?
- What does the HOA fee cover, when was the last increase, and are there any pending special assessments or reserve-fund shortfalls?
- Any open or pending special assessments — roof, HVAC, plumbing, elevator, façade? What's the per-unit balance and payoff schedule, and is the seller paying it off at close or rolling it to the buyer?
- Why hasn't it sold? Are there any deal-killer items the seller is aware of (foundation, flood, title, zoning, code violations)?
- Is there a deadline driving the sale (1031 exchange, divorce, estate, relocation)? That informs how much negotiation room exists.
- Schools are A-rated — typically a magnet for longer-tenancy family renters. What's the average tenant stay here, and is there a school-zone premium baked into asking?
- The area grade is low — what's the realistic commute time and amenity access for the typical tenant pool here? Any planned neighborhood developments (good or bad) we should know about?
- What's the average days-on-market for RENTAL listings here right now (not sales)? A rising rental-DOM trend means longer vacancies and softer asking-rent achievability than the comps imply.
- What's the recent tenant-quality profile in this submarket — average credit score on applications, eviction rate, late-payment / NSF rate, and stable-employment percentage? A property-management company in the area should have these aggregated.
- How much new apartment / multifamily construction is in the pipeline within 1–3 miles? Heavy new supply (>2% of stock underway) typically softens rents 12–24 months out; light construction supports rent growth.
Investment metrics
- 1% rule
- 0.96% ✗
- Cap rate
- 5.13%
- Cash-on-cash
- -4.15%
- DSCR
- 0.82
- GRM
- 8.7
CMA / ARV
- ARV (median comp)
- $245,293
- List price
- $250,000
- Delta
- 1.92%
- Verdict
- FAIR
- Comps
- 20 within 1.0 mi
Projected returns pro-forma
-3.0% appreciation · 7.39% rent growth · sell at horizon
- IRR
- -17.2%
- Equity multiple
- 0.36×
- Total profit
- $-44,552
- Equity at exit
- $37,276
- IRR
- -1.3%
- Equity multiple
- 0.89×
- Total profit
- $-7,608
- Equity at exit
- $21,615
Cash invested: $70,000 (down + closing). Projections, not guarantees.
Landlord ↔ Tenant lean methodology
- Overall (STATE)
- 87 Strongly Landlord-Friendly
- State Florida
- 87 Strongly Landlord-Friendly · R+3
- County
- — inherits STATE
- City
- — inherits STATE
ZIP-level market 32082
- Rents YoY
- 7.4%
- Active inventory
- 333
- Price-to-rent
- 8.7×
Monthly cashflow live
- Estimated rent
- $2,407 high interval (Pro) →
- Mortgage (P&I)
- −$1,311
- Tax from tax record
- −$202 /mo · $2,428/yr
- Insurance
- −$104
- HOA
- −$526
- Vacancy / Maint / Mgmt
- −$505
- Net cashflow
- $-242
Break-even live
UW: 25.0% down · 7.5% · 30yr · 1.5% tax · 5.0% vac · 8.0% maint · 8.0% mgmt
Financing live
Cash to close
- Down payment
- $62,500
- Closing costs
- $7,500
- Reserves months
- —
- Total cash needed
- —
Loan-product check · same deal, 3 products live
Conventional
25% down · 7.5% · 30yr
- Down + closing
- —
- Monthly P&I
- —
- Monthly cashflow
- —
- DSCR
- —
- Eligible?
- —
Personal DTI + credit; lowest rate.
DSCR
20% down · 8.5% · 30yr
- Down + closing
- —
- Monthly P&I
- —
- Monthly cashflow
- —
- DSCR
- —
- Eligible?
- —
No personal income docs; deal must DSCR.
Hard money
10% down · 12.0% · 12mo
- Down + closing
- —
- Monthly P&I
- —
- Monthly cashflow
- —
- DSCR
- —
- Eligible?
- —
Short-term bridge; refi at stabilization.
Rent comps 17 comps
| Address | Beds | Baths | Sqft | Rent | $/sqft | DOM | Units | Dist |
|---|---|---|---|---|---|---|---|---|
| 5 Arbor Club Dr #103 Ponte Vedra Beach, FL | 2.0 | 2.0 | 1200 | $2,300 | $1.92 | 7d | 1 | 0.03mi |
| 11 Arbor Club Dr #214 Ponte Vedra Beach, FL | 2.0 | 2.0 | 1116 | $2,200 | $1.97 | 23d | 1 | 0.09mi |
| 19 Arbor Club Dr Ponte Vedra Beach, FL | 2.0 | 2.0 | 1116 | $2,095 | $1.88 | 23d | 1 | 0.13mi |
| 908 Shoreline Cir Ponte Vedra Beach, FL | 2.0 | 2.0 | 1033 | $2,100 | $2.03 | 3d | 1 | 0.20mi |
| 100 Fairway Park Blvd Ponte Vedra Beach, FL | 1.0–2.0 | 1.0–2.0 | 750 | $1,700 | $2.27 | 14d | 3 | 0.25mi |
| 71 Ponte Vedra Colony Cir Ponte Vedra Beach, FL | 2.0 | 2.0 | 950 | $3,200 | $3.37 | 23d | 1 | 0.31mi |
| 46 Ponte Vedra Colony Cir Ponte Vedra Beach, FL | 2.0 | 2.0 | 1000 | $1,900 | $1.90 | 21d | 1 | 0.31mi |
| 650 Ponte Vedra Blvd Unit E Ponte Vedra Beach, FL | 2.0 | 2.5 | 1406 | $3,995 | $2.84 | 23d | 1 | 0.60mi |
| 622 Ponte Vedra Blvd Unit D4 Ponte Vedra Beach, FL | 3.0 | 2.0 | 1440 | $4,500 | $3.12 | 23d | 1 | 0.61mi |
| 657 Ponte Vedra Blvd Unit 657C Ponte Vedra Beach, FL | 2.0 | 2.0 | 1226 | $6,500 | $5.30 | 23d | 1 | 0.66mi |
| 562 Ponte Vedra Blvd Ponte Vedra Beach, FL | 3.0 | 1.5 | 1453 | $4,500 | $3.10 | 23d | 1 | 0.75mi |
| 230 Colima Ct Ponte Vedra Beach, FL | 2.0 | 2.0 | 990 | $2,148 | $2.17 | 7d | 1 | 0.94mi |
| 130 Veracruz Dr #722 Ponte Vedra Beach, FL | 2.0 | 2.0 | 991 | $2,000 | $2.02 | 23d | 1 | 0.95mi |
| 160 Veracruz Dr Ponte Vedra Beach, FL | 2.0 | 2.0 | 1065 | $2,188 | $2.05 | 23d | 1 | 1.04mi |
| 43 Tifton Way N Ponte Vedra Beach, FL | 2.0 | 2.0 | 1415 | $3,950 | $2.79 | 23d | 1 | 1.13mi |
| 100 Ironwood Dr #133 Ponte Vedra Beach, FL | 2.0 | 2.0 | 1117 | $2,295 | $2.05 | 23d | 1 | 1.14mi |
| 743 Spinnakers Reach Dr Ponte Vedra Beach, FL | 1.0 | 1.0 | 700 | $4,500 | $6.43 | 23d | 1 | 1.47mi |
HOA detail condo
- Monthly dues
- $526 · $6,312/yr
- Assessments
- None detected in remarks — confirm with the listing agent.
Listing history 34 events
-
2026-06-18days on market $250,000 Active 77 DOM
-
2026-06-17days on market $250,000 Active 76 DOM
-
2026-06-16days on market $250,000 Active 75 DOM
-
2026-06-15days on market $250,000 Active 74 DOM
-
2026-06-13days on market $250,000 Active 72 DOM
-
2026-06-13days on market $250,000 Active 71 DOM
-
2026-06-10days on market $250,000 Active 68 DOM
-
2026-06-08days on market $250,000 Active 67 DOM
-
2026-06-07days on market $250,000 Active 66 DOM
-
2026-06-03days on market $250,000 Active 62 DOM
-
2026-06-02days on market $250,000 Active 61 DOM
-
2026-06-01days on market $250,000 Active 60 DOM
-
2026-05-31days on market $250,000 Active 59 DOM
-
2026-04-01$250,000 Active 200-char remark
Show marketing remark (200 chars)
Beautifully maintained villa. Light and bright. Back Porch overlooks lagoon and fountain. Master Bath has a walk-in shower. Walk to top notch restaurants, shopping, etc. Beach access for community.
-
2022-07-20soldstatus $305,000
-
2022-07-18soldstatus $305,000 Sold 194-char remark
Show marketing remark (194 chars)
Welcome Home to Ocean Grove!! This second unit condo is ready for you. This unit is just a short bike ride from the private deeded beach access. It has been renovated and renew two months ago!!!
-
2022-06-22status Pending 194-char remark
Show marketing remark (194 chars)
Welcome Home to Ocean Grove!! This second unit condo is ready for you. This unit is just a short bike ride from the private deeded beach access. It has been renovated and renew two months ago!!!
-
2022-06-21historical Active - Contingent 194-char remark
Show marketing remark (194 chars)
Welcome Home to Ocean Grove!! This second unit condo is ready for you. This unit is just a short bike ride from the private deeded beach access. It has been renovated and renew two months ago!!!
-
2022-06-09status Active 194-char remark
Show marketing remark (194 chars)
Welcome Home to Ocean Grove!! This second unit condo is ready for you. This unit is just a short bike ride from the private deeded beach access. It has been renovated and renew two months ago!!!
-
2022-06-06historical Active - Contingent 194-char remark
Show marketing remark (194 chars)
Welcome Home to Ocean Grove!! This second unit condo is ready for you. This unit is just a short bike ride from the private deeded beach access. It has been renovated and renew two months ago!!!
-
2022-05-23$305,000 Active 194-char remark
Show marketing remark (194 chars)
Welcome Home to Ocean Grove!! This second unit condo is ready for you. This unit is just a short bike ride from the private deeded beach access. It has been renovated and renew two months ago!!!
-
2020-12-02soldstatus $134,000
-
2019-11-20soldstatus $159,000
-
2019-11-15soldstatus $159,000 Sold
-
2019-11-01status Pending
-
2019-10-28status Pending
-
2019-10-15historical Active - Contingent
-
2019-09-19status Active
-
2019-08-30status Pending
-
2019-08-11historical Active - Contingent
-
2019-08-01$159,000 Active
-
2008-11-30historical
-
2008-04-30$189,000
-
2005-03-23soldstatus $179,900
ⓘ Source: listings_history table (triggers on properties + properties_extension) + one-shot
backfill from property_details.listing_events for pre-trigger history.
Tax reassessment forecast FL · Resets to sale price
- Current annual tax
- $2,428 · $202/mo
- Projected year-2 tax
- $2,428 · $202/mo
- Expected delta
- $0/yr ($0/mo · 0.0%)
ⓘ Screening estimate from a state-policy table — verify with the county assessor before closing.
Climate risk First Street
- Flood 4/10 Moderate FEMA zone X (unshaded) · 13% chance over 30 yrs
- Wildfire 1/10 Low
- Heat 10/10 Extreme 7 d/yr ≥103°F today · 22 d/yr by 30 yrs out
- Wind 10/10 Extreme 99% chance of damaging wind over 30 yrs
- Air quality 4/10 Moderate 5 unhealthy d/yr today · 5 by 30 yrs out
Nearby sold comps map
Loading sold comps map…
Walkable amenities ~0.75 mi
Loading nearby amenities…
Taxation est. · year 1
- Rental income
- $28,879
- − Mortgage interest
- −$14,004
- − Property taxes
- −$2,428
- − Insurance
- −$1,250
- − Repairs & maintenance
- −$2,310
- − Management
- −$2,310
- − HOA
- −$6,312
- − Depreciation
- −$7,273
- Taxable loss
- −$7,008
- Est. tax savings @ 24.0%
- +$1,682
- After-tax cash flow
- $-1,226/yr
For passive investors: Depreciation is non-cash, so a rental often shows a tax loss while cash-flowing — sheltering income. Rental losses are passive: they offset passive income freely, and up to $25,000/yr can offset ordinary (W-2) income if you actively participate and your MAGI is under $100k (phasing out to $0 by $150k); unused losses carry forward. On sale, claimed depreciation is recaptured at up to 25%, and gains may owe capital-gains tax (a 1031 exchange can defer both). Figures are a year-1 estimate at your 24.0% rate — not tax advice; consult a CPA.
Schools (NCES district)
- District
- St. Johns
- NCES district ID
- 1201740
- Math proficiency
- 75% ▼ -5.00%
- Reading proficiency
- 73% ▼ -2.00%
- Median HH income
- $66,842
- Composite
- 64.31/100
- National rank
- #556
- State rank
- #2 of 73 in FL
Livability — Palm Valley
- Score
- 69/100
- State rank
- #462
- US rank
- #8349
Category grades
Schools grade is shown separately in the Schools card above.
Census & demographics
- Census place
- Palm Valley, FL
- County
- Saint Johns County · 301,599 people
- Metro
- Jacksonville, FL
- Population (ZIP)
- 29,289
- Household income
- $124,558
- Rent vs Own
- Severe rent burden
- 672.0
Population outlook (St. Johns County) Hauer SSP2
- Today (2025)
- 303,941 people
- By 2030
- 342,590 · +12.7%
- By 2040
- 417,328 · +37.3%
- By 2050
- 487,011 · +60.2%
- By 2075
- 635,395 · +109.1%
- By 2100
- 717,469 · +136.1%
Race, ethnicity, and origin ACS 2023
- Neighborhood character
- Predominantly White (87%)
- Race & ethnicity
- White 87% Two or more races 6% Hispanic / Latino 6% Asian 3% Black 1%
- Hispanic origin (detail)
- Puerto Rican 1% Cuban 1%
- Common ancestry
- Slovak 4% Romanian 3% Italian 3%
- Foreign-born
- 9% · Canada, China
- Languages at home
- 91% English-only · Spanish 3% Other Indo-European 2% Russian/Polish/Slavic 1%
Political lean MEDSL · St. Johns
- 2024 margin
- Solid R (+31.4) · D 33.9% · R 65.2%
- 2008→2024 swing
- +0.2pp no change · 2008: -31.6pp · 2024: -31.4pp
- All cycles
- 2024: R+31.4 2020: R+26.7 2016: R+33.4 2012: R+37.8 2008: R+31.6
Not yet ingested
- Civics
- —
Market trends
- HPI YoY
- ▼ -435.26%
- Current HPI
- 306.134
- Rent YoY
- ▲ 7.39%
- Metro
- Jacksonville, FL
- State GDP YoY
- ▲ 3.28%
- F500 in state
- 36
Industry mix (Fortune 500 HQ in FL)
| Industry | F500 HQs | Revenue |
|---|---|---|
| Industrial Technology | 2 | $29B |
|
||
| Insurance | 2 | $17B |
|
||
| Retail | 1 | $60B |
|
||
| Technology Distribution | 1 | $58B |
|
||
| Homebuilding | 1 | $35B |
|
||
| Technology Manufacturing | 1 | $35B |
|
||
Price history
+39.0% since first listed21 events — show timeline
- 2026-04-01 Listed $250,000 realMLS
- 2022-07-20 Sold (Public Records) $305,000 Public Records
- 2022-07-18 Sold (MLS) $305,000 realMLS
- 2022-06-22 Pending — realMLS
- 2022-06-21 Contingent — realMLS
- 2022-06-09 Relisted — realMLS
- 2022-06-06 Contingent — realMLS
- 2022-05-23 Listed $305,000 realMLS
- 2020-12-02 Sold (Public Records) $134,000 Public Records
- 2019-11-20 Sold (Public Records) $159,000 Public Records
- 2019-11-15 Sold (MLS) $159,000 realMLS
- 2019-11-01 Pending — realMLS
- 2019-10-28 Pending — realMLS
- 2019-10-15 Contingent — realMLS
- 2019-09-19 Relisted — realMLS
- 2019-08-30 Pending — realMLS
- 2019-08-11 Contingent — realMLS
- 2019-08-01 Listed $159,000 realMLS
- 2008-11-30 Listing Removed — realMLS
- 2008-04-30 Listed $189,000 realMLS
- 2005-03-23 Sold (Public Records) $179,900 Public Records
Property tax history
+4.8%/yrLatest (2025): $2,428 · -2.0% YoY. Source: county tax records.
Cash-flow waterfall
monthlySold comps — $/sqft
last 12 mo · ≤1 miLoading sold comps…