125 Cottontown Trl · Leighton, AL
Flood risk 1/10 · Minimal
- FEMA flood zone
- X (unshaded)
- Chance of flooding over 30 yrs
- 0.0%
- Est. flood insurance / yr
- $507 – $1,088
Fire risk 5/10 · Moderate
- Est. fire insurance / yr
- $916 – $1,700
Heat risk 5/10 · Moderate
- Hot days now (above 107°F)
- 7 days/yr
- Hot days in 30 yrs
- 20 days/yr
Wind risk 4/10 · Minor
- Chance of severe wind over 30 yrs
- 21.0%
Air-quality risk 2/10 · Minimal
- Unhealthy air days now
- 0 days/yr
- Unhealthy air days in 30 yrs
- 1 days/yr
Risk factors via First Street. Map © Google.
Why this score? — see what drove the B- grade
The composite is a weighted blend of 9 inputs, each scored 0–100. Each bar is that input's sub-score; the figure is the points it added to the 100-point composite (weight × sub-score).
- Cash flow +26.3/30.0
- DSCR +8.9/10.0
- Appreciation +7.6/10.0
- ARV discount +7.5/15.0
- 1% rule +5.8/10.0
- Livability +2.6/5.0
- Rent growth +2.5/5.0
- Condition / age +2.5/5.0
- Schools +2.1/10.0
$94,900
🖨 Deal sheet 📄 Offer letter ✓ Due diligence
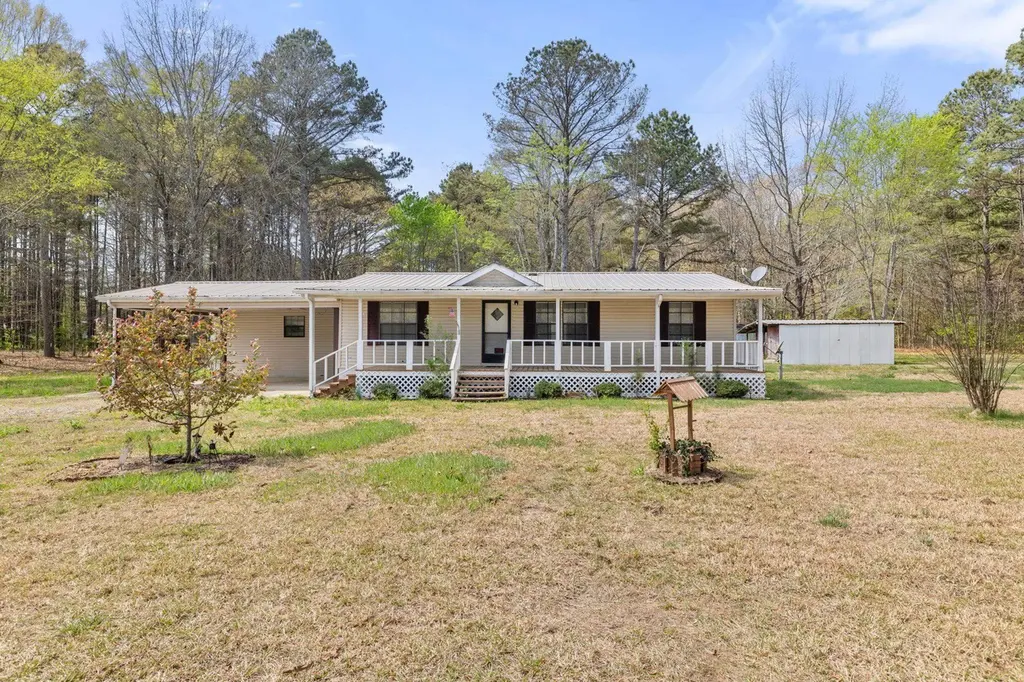
Listing remarks
Nearly 2 acres in a super serene setting. Which, in this price range, is kind of the whole point. The house is exactly what you think it is. Solid, functional, and ready to be painted and loved. Nothing hidden, nothing overdone. Just a good setup with room to make it your own. Featuring a metal roof, with an HVAC installed in 2023, and plenty of space to do whatever you want with it. Sale subject to probate court approval. If you’ve been waiting on something with land that doesn’t try too hard, this is probably your house.
Key facts
- Metal roof
- Hvac installed
- 2 acres
Tags
Neighborhood map
What this means for you Summary
Snapshot
- This is a 3-bed/2.0-bath manufactured listed at $95k.
Deal economics
- At list price, monthly cash flow is $246 ($3k/yr) — positive.
- The deal already cash-flows at list — no discount required.
- Meets the 1% rule at list price ($1k rent vs $95k).
Location & tenants
- Location reads 52/100 on livability (#500 in AL) — a working-class tenant base; expect higher turnover. Strengths: cost of living A+; Watch: crime F, amenities F, commute F.
- Colbert County (rural): math 13% / reading 38% proficiency, ranked #90 of 129 in AL (top 70%) — low school quality limits family demand, transient renter base, plan for 1-2y turnover.
- Zoned schools: Colbert County High School (math 5% / reading 32%, grade F, #184 of 305 statewide, top 61%, 455 students, 43% FRL) — zoned schools average 43% FRL vs 59% district-wide (16 pts lower); this property's tenant base skews higher-income than the district average.
- Market conditions: 29 active listings in the ZIP; 91 units permitted in Colbert County in 2024 (0 in 5+ unit buildings).
Forward outlook
- In year one you build about $6k of equity ($656 loan paydown + $5k appreciation (5.3% local appreciation)).
- Colbert County population projected to shrink 7% by 2050 — rents likely to lag national; underwrite the cash flow, not the appreciation.
- At projected returns (5.3% appreciation + 3.0% rent growth), your $27k cash investment doubles in ~3 years — after that, you're playing with house money.
- By year 6, paydown + projected appreciation supports a ~$30k cash-out refi (75% LTV) — recoverable capital for the next deal without selling this one.
Negotiation context
- Only 6 days on market — expect competitive offers; lowballing is unlikely to land.
- 4 sale attempts since 16y ago with the ask held roughly flat each time — persistent listings suggest the price (not the market) is what's stuck; bring a comps-based counter.
- Current owner paid $45k; list at $95k implies a 111% gain — meaningful room to come down on a strong offer.
Risks & watch-outs
- Climate carrying-cost: moderate wildfire risk; extreme-heat days projected 7→20/yr by 2055 (HVAC capex compounding) — expect insurance premiums to compound above CPI over the hold.
Questions for the listing agent
- Is there a deadline driving the sale (1031 exchange, divorce, estate, relocation)? That informs how much negotiation room exists.
- Schools are F-rated, which usually means shorter tenancies and higher turnover. Who's the typical renter profile here, and what's been the actual vacancy rate?
- Crime grade is F in this area — have there been break-ins, vandalism, or insurance claims at this property in the last 3 years? What carrier currently insures it and at what premium?
- What's the average days-on-market for RENTAL listings here right now (not sales)? A rising rental-DOM trend means longer vacancies and softer asking-rent achievability than the comps imply.
- What's the recent tenant-quality profile in this submarket — average credit score on applications, eviction rate, late-payment / NSF rate, and stable-employment percentage? A property-management company in the area should have these aggregated.
- How much new for-sale + rental construction is in the pipeline within 1–3 miles? Heavy new supply typically softens prices + rents 12–24 months out; constrained supply supports both.
Investment metrics
- 1% rule
- 1.08% ✓
- Cap rate
- 9.40%
- Cash-on-cash
- 11.10%
- DSCR
- 1.49
- GRM
- 7.7
CMA / ARV
No comps found within radius.
Projected returns pro-forma
5.26% appreciation · 3.0% rent growth · sell at horizon
- IRR
- 23.0%
- Equity multiple
- 2.46×
- Total profit
- $38,902
- Equity at exit
- $55,283
- IRR
- 22.2%
- Equity multiple
- 4.89×
- Total profit
- $103,360
- Equity at exit
- $96,679
Cash invested: $26,572 (down + closing). Projections, not guarantees.
Landlord ↔ Tenant lean methodology
- Overall (STATE)
- 90 Strongly Landlord-Friendly
- State Alabama
- 90 Strongly Landlord-Friendly · R+15
- County
- — inherits STATE
- City
- — inherits STATE
ZIP-level market 35646
- Home prices YoY
- 3.6%
- Active inventory
- 29
- Price-to-rent
- 7.7×
Monthly cashflow live
- Estimated rent
- $1,022 medium interval (Pro) →
- Mortgage (P&I)
- −$498
- Tax from tax record
- −$25 /mo · $297/yr
- Insurance
- −$40
- HOA
- −$0
- Vacancy / Maint / Mgmt
- −$215
- Net cashflow
- $246
Break-even live
UW: 25.0% down · 7.5% · 30yr · 1.5% tax · 5.0% vac · 8.0% maint · 8.0% mgmt
Financing live
Cash to close
- Down payment
- $23,725
- Closing costs
- $2,847
- Reserves months
- —
- Total cash needed
- —
Loan-product check · same deal, 3 products live
Conventional
25% down · 7.5% · 30yr
- Down + closing
- —
- Monthly P&I
- —
- Monthly cashflow
- —
- DSCR
- —
- Eligible?
- —
Personal DTI + credit; lowest rate.
DSCR
20% down · 8.5% · 30yr
- Down + closing
- —
- Monthly P&I
- —
- Monthly cashflow
- —
- DSCR
- —
- Eligible?
- —
No personal income docs; deal must DSCR.
Hard money
10% down · 12.0% · 12mo
- Down + closing
- —
- Monthly P&I
- —
- Monthly cashflow
- —
- DSCR
- —
- Eligible?
- —
Short-term bridge; refi at stabilization.
Listing history 6 events
-
2026-04-06status Pending
-
2026-03-31$94,900 Active
-
2016-02-01$69,900
-
2014-01-23$64,900
-
2010-09-30soldstatus $45,000
-
2010-05-19$47,900
ⓘ Source: listings_history table (triggers on properties + properties_extension) + one-shot
backfill from property_details.listing_events for pre-trigger history.
Tax reassessment forecast AL · Resets to sale price
- Current annual tax
- $297 · $25/mo
- Projected year-2 tax
- $389 · $32/mo
- Expected delta
- +$92/yr (+$8/mo · 31.2%)
ⓘ Screening estimate from a state-policy table — verify with the county assessor before closing.
Climate risk First Street
- Flood 1/10 Low FEMA zone X (unshaded) · 0% chance over 30 yrs
- Wildfire 5/10 Major
- Heat 5/10 Major 7 d/yr ≥107°F today · 20 d/yr by 30 yrs out
- Wind 4/10 Moderate 21% chance of damaging wind over 30 yrs
- Air quality 2/10 Low 0 unhealthy d/yr today · 1 by 30 yrs out
Nearby sold comps map
Loading sold comps map…
Walkable amenities ~0.75 mi
Loading nearby amenities…
Taxation est. · year 1
- Rental income
- $12,270
- − Mortgage interest
- −$5,316
- − Property taxes
- −$297
- − Insurance
- −$474
- − Repairs & maintenance
- −$982
- − Management
- −$982
- − Depreciation
- −$2,761
- Taxable income
- $1,459
- Est. tax owed @ 24.0%
- −$350
- After-tax cash flow
- $2,600/yr
For passive investors: Depreciation is non-cash, so a rental often shows a tax loss while cash-flowing — sheltering income. Rental losses are passive: they offset passive income freely, and up to $25,000/yr can offset ordinary (W-2) income if you actively participate and your MAGI is under $100k (phasing out to $0 by $150k); unused losses carry forward. On sale, claimed depreciation is recaptured at up to 25%, and gains may owe capital-gains tax (a 1031 exchange can defer both). Figures are a year-1 estimate at your 24.0% rate — not tax advice; consult a CPA.
Schools (NCES district)
- District
- Colbert County
- NCES district ID
- 0100840
- Math proficiency
- 13% ▼ -24.00%
- Reading proficiency
- 38% ▬ 0.00%
- Median HH income
- $40,710
- Composite
- 21.48/100
- National rank
- #8328
- State rank
- #90 of 129 in AL
Livability — Leighton
- Score
- 52/100
- State rank
- #500
- US rank
- #24843
Category grades
Schools grade is shown separately in the Schools card above.
Census & demographics
- Population (ZIP)
- 4,005
Population outlook (Colbert County) Hauer SSP2
- Today (2025)
- 54,154 people
- By 2030
- 53,746 · -0.8%
- By 2040
- 52,431 · -3.2%
- By 2050
- 50,303 · -7.1%
- By 2075
- 44,789 · -17.3%
- By 2100
- 36,676 · -32.3%
Race, ethnicity, and origin ACS 2023
- Neighborhood character
- Predominantly White (69%)
- Race & ethnicity
- White 69% Black 29% Two or more races 2%
- Common ancestry
- Iranian 2% Italian 2% Romanian 1%
Political lean MEDSL · Colbert
- 2024 margin
- Solid R (+46.4) · D 26.4% · R 72.8%
- 2008→2024 swing
- -26.2pp toward R · 2008: -20.3pp · 2024: -46.4pp
- All cycles
- 2024: R+46.4 2020: R+38.9 2016: R+38.3 2012: R+20.4 2008: R+20.3
Not yet ingested
- Civics
- —
Market trends
- HPI YoY
- ▲ 5.26%
- Current HPI
- 151.8695
- Rent YoY
- —
- Metro
- —
- State GDP YoY
- ▲ 2.94%
- F500 in state
- 4
Industry mix (Fortune 500 HQ in AL)
| Industry | F500 HQs | Revenue |
|---|---|---|
| Financial Services | 1 | $8B |
|
||
| Healthcare | 1 | $5B |
|
||
Price history
+98.1% since first listed6 events — show timeline
- 2026-04-06 Pending — SAARMLS
- 2026-03-31 Listed $94,900 SAARMLS
- 2016-02-01 Listed $69,900 SAARMLS
- 2014-01-23 Listed $64,900 SAARMLS
- 2010-09-30 Sold (MLS) $45,000 SAARMLS
- 2010-05-19 Listed $47,900 SAARMLS
Property tax history
+5.6%/yrLatest (2025): $297 · +145.1% YoY. Source: county tax records.
Cash-flow waterfall
monthlySold comps — $/sqft
last 12 mo · ≤1 miLoading sold comps…