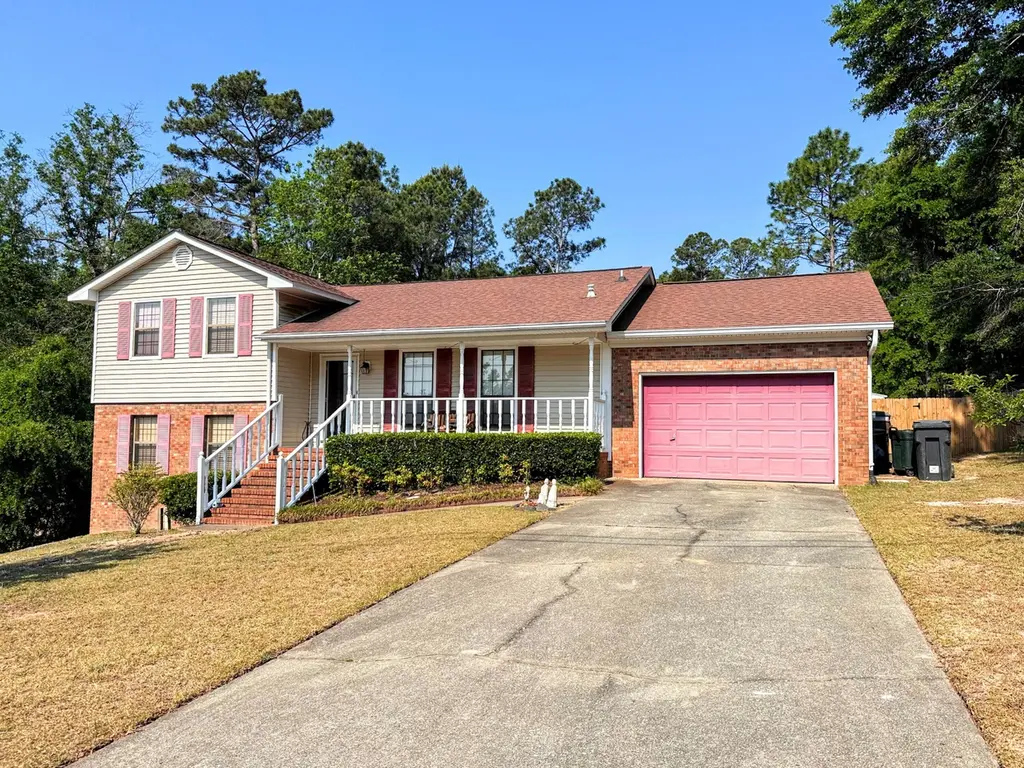
5213 Woodridge Dr · Augusta-Richmond County consolidated government (balance), GA
Flood risk 1/10 · Minimal
- FEMA flood zone
- X (unshaded)
- Chance of flooding over 30 yrs
- 0.0%
- Est. flood insurance / yr
- $507 – $1,088
Fire risk 5/10 · Moderate
- Est. fire insurance / yr
- $963 – $1,789
Heat risk 7/10 · Major
- Hot days now (above 107°F)
- 7 days/yr
- Hot days in 30 yrs
- 17 days/yr
Wind risk 6/10 · Moderate
- Chance of severe wind over 30 yrs
- 72.0%
Air-quality risk 3/10 · Minor
- Unhealthy air days now
- 3 days/yr
- Unhealthy air days in 30 yrs
- 3 days/yr
Risk factors via First Street. Map © Google.
Why this score? — see what drove the D grade
The composite is a weighted blend of 9 inputs, each scored 0–100. Each bar is that input's sub-score; the figure is the points it added to the 100-point composite (weight × sub-score).
- Cash flow +14.3/30.0
- ARV discount +10.7/15.0
- DSCR +4.4/10.0
- 1% rule +4.0/10.0
- Livability +2.5/5.0
- Condition / age +2.5/5.0
- Rent growth +2.3/5.0
- Schools +1.3/10.0
- Appreciation +0.0/10.0
$240,000
🖨 Deal sheet (PDF) 📄 Offer letter ✓ Due diligence
Listing remarks MLS
WELL KEPT TRI-LEVEL HOME, 4BR/2BA, FORMAL LIVING & DINING ROOM. GREAT ROOM W/ FP, REAR DECK & MUCH MORE.
Key facts
- Covered front porch
- Updated roof
- Covered rear deck
Tags
Property features AI
Finance
- HOA & community: Street lights
Exterior
- Parking: Attached garage with garage door opener; 1 garage space (1 total parking space); Parking pad
- Utilities: Public water; Public sewer; Cable available
- Home design: Single-family residence; Multi/split levels (3 stories); Entry level: 1
- Construction: Brick, brick veneer, vinyl siding and frame construction; Composition roof; Slab foundation; Built with exterior outbuilding
- Exterior features: Covered patio/deck/front and rear porches; Deck; Patio; Front porch; Rear porch; Storm doors; Privacy fencing / fenced yard; Landscaped yard; Outbuilding; Paved road access; Street lights in community; Has a view
Interior
- Kitchen: Range; Dishwasher
- Flooring: Carpet; Vinyl; Ceramic tile
- Bathrooms: 2 full bathrooms
- Heating & cooling: Central air; Heating with fireplace(s), electric and natural gas
- Interior features: Pantry; Window coverings
- Laundry & utility: Washer hookup
Neighborhood map
What this means for you Summary
Snapshot
- This is a 4-bed/2.0-bath single-family listed at $240k.
Deal economics
- At list price, monthly cash flow is $45 ($537/yr) — positive.
- The deal already cash-flows at list — no discount required.
- To meet the 1% rule (rent ≥ 1% of price), the offer needs to be $216k (10.2% below list).
- Recommended offer: $216k (10.2% below list) — sets the bar for 1% rule.
- Cap rate 6.5% vs local median 5.3% in Augusta-Richmond County consolidated government (balance) — meaningfully above typical; check what's discounted (condition, days-on-market, listing class) to confirm the premium yield is real.
Location & tenants
- Location reads: area grade D — affects rentability + tenant quality, not the cash-flow math above.
- Richmond County (urban): math 12% / reading 20% proficiency, ranked #154 of 174 in GA (top 88%) — low school quality limits family demand, transient renter base, plan for 1-2y turnover; 72% free/reduced lunch — lower-income household profile, screen leases tightly.
- Zoned schools: Goshen Elementary School (math 17% / reading 22%, grade F, #878 of 1,228 statewide, top 75%, 448 students, 98% FRL); Pine Hill Middle School (math 5% / reading 19%, grade F, #417 of 470 statewide, top 90%, 582 students, 98% FRL); Cross Creek High School (math 2% / reading 12%, grade F, #385 of 424 statewide, top 92%, 1,133 students, 98% FRL) — zoned schools average 98% FRL vs 72% district-wide (26 pts higher); higher-poverty schools than district average — tighter screening recommended.
- Market conditions: Rents soft (-0.7%/yr); 370 active listings in the ZIP; 3 comparable units currently listed for rent nearby; rentals at typical pace (median 16d on market — plan ~3-4 weeks tenant-placement turnaround); 561 units permitted in Richmond County in 2024 (0 in 5+ unit buildings).
- This rent runs 37% of the median local income ($70k/yr) — at the standard rent-burdened threshold; future hikes will face affordability resistance.
Forward outlook
- Local home prices are declining (-3.0%/yr); year-one equity from $2k of loan paydown is wiped out by about $7k of value loss. Plan a longer hold.
- Richmond County population projected to shrink 5% by 2050 — rents likely to lag national; underwrite the cash flow, not the appreciation.
Negotiation context
- It's been on market 41 days — a 3% lower offer ($233k) is reasonable based on typical stale-listing flexibility.
- 8 sale attempts since 19y ago with the ask held roughly flat each time — persistent listings suggest the price (not the market) is what's stuck; bring a comps-based counter.
- Current owner paid $114k; list at $240k implies a 111% gain — meaningful room to come down on a strong offer.
Risks & watch-outs
- Climate carrying-cost: major wind risk, 72% chance of damaging wind over 30y; moderate wildfire risk; extreme-heat days projected 7→17/yr by 2055 (HVAC capex compounding) — expect insurance premiums to compound above CPI over the hold.
Questions for the listing agent
- It's been on market 41 days. Have you received any prior offers? Is the seller open to a 10% concession, seller financing, or rate buy-down credit?
- Is there a deadline driving the sale (1031 exchange, divorce, estate, relocation)? That informs how much negotiation room exists.
- The area grade is low — what's the realistic commute time and amenity access for the typical tenant pool here? Any planned neighborhood developments (good or bad) we should know about?
- What's the average days-on-market for RENTAL listings here right now (not sales)? A rising rental-DOM trend means longer vacancies and softer asking-rent achievability than the comps imply.
- What's the recent tenant-quality profile in this submarket — average credit score on applications, eviction rate, late-payment / NSF rate, and stable-employment percentage? A property-management company in the area should have these aggregated.
- How much new for-sale + rental construction is in the pipeline within 1–3 miles? Heavy new supply typically softens prices + rents 12–24 months out; constrained supply supports both.
Investment metrics
- 1% rule
- 0.90% ✗
- Cap rate
- 6.52%
- Cash-on-cash
- 0.80%
- DSCR
- 1.04
- GRM
- 9.3
CMA / ARV
- ARV (median comp)
- $258,207
- List price
- $240,000
- Delta
- -7.05%
- Verdict
- FAIR
- Comps
- 20 within 1.0 mi
Show comp detail 4 sales within ~0.75 mi
| Address | Dist | Beds/Ba | Sqft | Sold | Price | $/sf | Match |
|---|---|---|---|---|---|---|---|
| 1573 Oglethorpe Dr | 0.44mi | 4/2.0 | 1,886 (-4%) | 2mo | $272,500 | $144 | 72 |
| 4011 Brown Hurst Rd | 0.32mi | 3/2.0 (-1) | 1,890 (-4%) | 6mo | $265,500 | $140 | 69 |
| 1548 Citation Rd | 0.43mi | 4/3.0 | 1,812 (-8%) | 16mo | $262,000 | $145 | 50 |
| 1541 Brown Rd | 0.74mi | 3/3.0 (-1) | 1,982 (+1%) | 22mo | $220,000 | $111 | 37 |
Match score weights: distance 35% · size 25% · config 20% · recency 20%. Top-matched comps best support the ARV.
Projected returns pro-forma
-3.0% appreciation · 0.0% rent growth · sell at horizon
- IRR
- -18.4%
- Equity multiple
- 0.37×
- Total profit
- $-42,327
- Equity at exit
- $35,785
- IRR
- -18.3%
- Equity multiple
- 0.14×
- Total profit
- $-57,475
- Equity at exit
- $20,751
Cash invested: $67,200 (down + closing). Projections, not guarantees.
Landlord ↔ Tenant lean methodology
- Overall (STATE)
- 90 Strongly Landlord-Friendly
- State Georgia
- 90 Strongly Landlord-Friendly · R+3
- County
- — inherits STATE
- City
- — inherits STATE
ZIP-level market 30815
- Home prices YoY
- -24.2%
- Rents YoY
- -0.7%
- Active inventory
- 370
- Price-to-rent
- 9.3×
Monthly cashflow live
- Estimated rent
- $2,156 medium interval (Pro) →
- Mortgage (P&I)
- −$1,259
- Tax est. 1.5%
- −$300 /mo · $3,600/yr
- Insurance
- −$100
- HOA
- −$0
- Vacancy / Maint / Mgmt
- −$453
- Net cashflow
- $45
Break-even live
Sensitivity live
| Price | -10% $211 | -5% $128 | +0% $45 | +5% $-38 | +10% $-121 |
|---|---|---|---|---|---|
| Rent | -10% $-126 | -5% $-40 | +0% $45 | +5% $130 | +10% $215 |
| Rate | -1.0pp $166 | -0.5pp $106 | base $45 | +0.5pp $-17 | +1.0pp $-81 |
UW: 25.0% down · 7.5% · 30yr · 1.5% tax · 5.0% vac · 8.0% maint · 8.0% mgmt
Financing live
Cash to close
- Down payment
- $60,000
- Closing costs
- $7,200
- Reserves months
- —
- Total cash needed
- —
Loan-product check · same deal, 3 products live
Conventional
25% down · 7.5% · 30yr
- Down + closing
- —
- Monthly P&I
- —
- Monthly cashflow
- —
- DSCR
- —
- Eligible?
- —
Personal DTI + credit; lowest rate.
DSCR
20% down · 8.5% · 30yr
- Down + closing
- —
- Monthly P&I
- —
- Monthly cashflow
- —
- DSCR
- —
- Eligible?
- —
No personal income docs; deal must DSCR.
Hard money
10% down · 12.0% · 12mo
- Down + closing
- —
- Monthly P&I
- —
- Monthly cashflow
- —
- DSCR
- —
- Eligible?
- —
Short-term bridge; refi at stabilization.
Rent comps 3 comps
| Address | Beds | Baths | Sqft | Rent | $/sqft | DOM | Units | Dist |
|---|---|---|---|---|---|---|---|---|
| 1233 Paramount Ct Hephzibah, GA | 4.0 | 2.5 | 2560 | $2,300 | $0.90 | 16d | 1 | 0.50mi |
| 4210 Valencia Ln Augusta, GA | 4.0 | 2.5 | 1900 | $1,795 | $0.94 | 16d | 1 | 1.35mi |
| 4376 E Barcelona Way Unit 00 4404 Augusta, GA | 4.0 | 2.5 | 1696 | $1,795 | $1.06 | 25d | 1 | 1.45mi |
Listing history 34 events
-
2026-06-21days on market $240,000 Active 41 DOM
-
2026-06-18days on market $240,000 Active 38 DOM
-
2026-06-17days on market $240,000 Active 37 DOM
-
2026-06-16days on market $240,000 Active 36 DOM
-
2026-06-15days on market $240,000 Active 35 DOM
-
2026-06-14days on market $240,000 Active 33 DOM
-
2026-06-10days on market $240,000 Active 30 DOM
-
2026-06-09days on market $240,000 Active 29 DOM
-
2026-06-08days on market $240,000 Active 28 DOM
-
2026-06-07days on market $240,000 Active 27 DOM
-
2026-06-03days on market $240,000 Active 23 DOM
-
2026-06-02days on market $240,000 Active 22 DOM
-
2026-06-01days on market $240,000 Active 21 DOM
-
2026-05-31days on market $240,000 Active 20 DOM
-
2026-05-30days on market $240,000 Active 19 DOM
-
2026-05-11historical
-
2026-04-24$250,000 Active
-
2026-04-24$250,000 Active 1671-char remark
-
2026-02-13price $125,900
Show marketing remark (117 chars)
WELL KEPT TRI-LEVEL HOME, 4BR/2BA, FORMAL LIVING & DINING ROOM. GREAT ROOM W/ FP, REAR DECK & MUCH MORE.
-
2023-04-12soldstatus $113,500
Show marketing remark (117 chars)
WELL KEPT TRI-LEVEL HOME, 4BR/2BA, FORMAL LIVING & DINING ROOM. GREAT ROOM W/ FP, REAR DECK & MUCH MORE.
-
2023-02-24$314,900
Show marketing remark (117 chars)
WELL KEPT TRI-LEVEL HOME, 4BR/2BA, FORMAL LIVING & DINING ROOM. GREAT ROOM W/ FP, REAR DECK & MUCH MORE.
-
2022-10-25historical
-
2022-10-25historical
-
2022-09-08$259,900
-
2022-09-08$259,900
-
2020-01-29historical
-
2020-01-29historical
-
2019-04-26$155,000
-
2019-04-26$155,000
-
2007-08-03soldstatus $113,500
-
2007-08-01soldstatus $113,500 Closed
Show marketing remark (117 chars)
WELL KEPT TRI-LEVEL HOME, 4BR/2BA, FORMAL LIVING & DINING ROOM. GREAT ROOM W/ FP, REAR DECK & MUCH MORE.
-
2007-08-01soldstatus $113,500
Show marketing remark (117 chars)
WELL KEPT TRI-LEVEL HOME, 4BR/2BA, FORMAL LIVING & DINING ROOM. GREAT ROOM W/ FP, REAR DECK & MUCH MORE.
-
2007-04-25$125,900
-
1988-10-01soldstatus $83,900
ⓘ Source: listings_history table (triggers on properties + properties_extension) + one-shot
backfill from property_details.listing_events for pre-trigger history.
Climate risk First Street
- Flood 1/10 Low FEMA zone X (unshaded) · 0% chance over 30 yrs
- Wildfire 5/10 Major
- Heat 7/10 Severe 7 d/yr ≥107°F today · 17 d/yr by 30 yrs out
- Wind 6/10 Major 72% chance of damaging wind over 30 yrs
- Air quality 3/10 Moderate 3 unhealthy d/yr today · 3 by 30 yrs out
Nearby sold comps map
Loading sold comps map…
Walkable amenities ~0.75 mi
Loading nearby amenities…
Taxation est. · year 1
- Rental income
- $25,873
- − Mortgage interest
- −$13,444
- − Property taxes
- −$3,600
- − Insurance
- −$1,200
- − Repairs & maintenance
- −$2,070
- − Management
- −$2,070
- − Depreciation
- −$6,982
- Taxable loss
- −$3,492
- Est. tax savings @ 24.0%
- +$838
- After-tax cash flow
- $1,375/yr
For passive investors: Depreciation is non-cash, so a rental often shows a tax loss while cash-flowing — sheltering income. Rental losses are passive: they offset passive income freely, and up to $25,000/yr can offset ordinary (W-2) income if you actively participate and your MAGI is under $100k (phasing out to $0 by $150k); unused losses carry forward. On sale, claimed depreciation is recaptured at up to 25%, and gains may owe capital-gains tax (a 1031 exchange can defer both). Figures are a year-1 estimate at your 24.0% rate — not tax advice; consult a CPA.
Schools (NCES district)
- District
- Richmond County
- NCES district ID
- 1304380
- Math proficiency
- 12% ▼ -9.00%
- Reading proficiency
- 20% ▼ -6.00%
- Median HH income
- $38,069
- Composite
- 13.43/100
- National rank
- #9524
- State rank
- #154 of 174 in GA
Livability — Augusta-Richmond County consolidated government (balance)
No livability data for this city. (Only ~50 U.S. cities are tracked.)
Census & demographics
- Census place
- Augusta-Richmond County consolidated government (balance), GA
- County
- Richmond County · 190,917 people
- City population
- 154,035
- Metro
- Augusta-Richmond County, GA-SC
- Population (ZIP)
- 44,109
- Household income
- $70,202
- Rent vs Own
- Severe rent burden
- 867.0
Population outlook (Richmond County) Hauer SSP2
- Today (2025)
- 200,753 people
- By 2030
- 200,232 · -0.3%
- By 2040
- 196,813 · -2.0%
- By 2050
- 190,347 · -5.2%
- By 2075
- 172,496 · -14.1%
- By 2100
- 146,284 · -27.1%
Race, ethnicity, and origin ACS 2023
- Neighborhood character
- Majority Black (62%)
- Race & ethnicity
- Black 62% White 27% Two or more races 5% Hispanic / Latino 4%
- Foreign-born
- 4% · Canada, South Korea
- Languages at home
- 93% English-only · Spanish 3% Other Indo-European 1% Korean 1%
Political lean MEDSL · Richmond
- 2024 margin
- Solid D (+36.1) · D 67.8% · R 31.7%
- 2008→2024 swing
- +4.3pp toward D · 2008: 31.8pp · 2024: 36.1pp
- All cycles
- 2024: D+36.1 2020: D+37.2 2016: D+32.4 2012: D+33.8 2008: D+31.8
Not yet ingested
- Civics
- —
Market trends
- HPI YoY
- ▼ -51.74%
- Current HPI
- 162.4074
- Rent YoY
- ▼ -0.71%
- Metro
- Augusta-Richmond County, GA-SC
- State GDP YoY
- ▲ 2.66%
- F500 in state
- 28
Industry mix (Fortune 500 HQ in GA)
| Industry | F500 HQs | Revenue |
|---|---|---|
| Paper / Packaging | 2 | $29B |
|
||
| Retail | 1 | $160B |
|
||
| Transportation / Logistics | 1 | $91B |
|
||
| Airlines | 1 | $62B |
|
||
| Consumer Goods | 1 | $47B |
|
||
| Utilities | 1 | $25B |
|
||
Price history
+186.1% since first listed20 events — show timeline
- 2026-05-26 Price Changed $240,000 Hive MLS
- 2026-05-11 Listing Removed — Hive MLS
- 2026-04-24 Listed $250,000 Hive MLS
- 2026-04-24 Listed $250,000 Hive MLS
- 2026-02-13 Price Changed $125,900 Hive MLS
- 2023-04-12 Sold (MLS) $113,500 Hive MLS
- 2023-02-24 Listed $314,900 Hive MLS
- 2022-10-25 Listing Removed — Hive MLS
- 2022-10-25 Listing Removed — Hive MLS
- 2022-09-08 Listed $259,900 Hive MLS
- 2022-09-08 Listed $259,900 Hive MLS
- 2020-01-29 Listing Removed — Hive MLS
- 2020-01-29 Listing Removed — Hive MLS
- 2019-04-26 Listed $155,000 Hive MLS
- 2019-04-26 Listed $155,000 Hive MLS
- 2007-08-03 Sold (Public Records) $113,500 Public Records
- 2007-08-01 Sold (MLS) $113,500 Hive MLS
- 2007-08-01 Sold (MLS) $113,500 Hive MLS
- 2007-04-25 Listed $125,900 Hive MLS
- 1988-10-01 Sold (Public Records) $83,900 Public Records
Property tax history
+2.2%/yrLatest (2025): $470 · +15.8% YoY. Source: county tax records.
Cash-flow waterfall
monthlySold comps — $/sqft
last 12 mo · ≤1 miLoading sold comps…